CHAPTER 12 PRODUCTIVITY - Bryophyte Ecology - Michigan ...
CHAPTER 12 PRODUCTIVITY - Bryophyte Ecology - Michigan ...
CHAPTER 12 PRODUCTIVITY - Bryophyte Ecology - Michigan ...

You also want an ePaper? Increase the reach of your titles
YUMPU automatically turns print PDFs into web optimized ePapers that Google loves.
<strong>CHAPTER</strong> <strong>12</strong><br />
<strong>PRODUCTIVITY</strong><br />
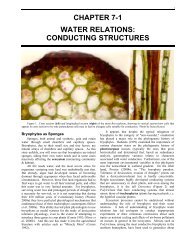
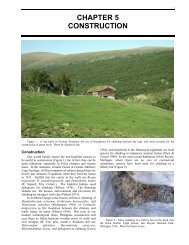
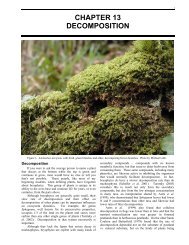
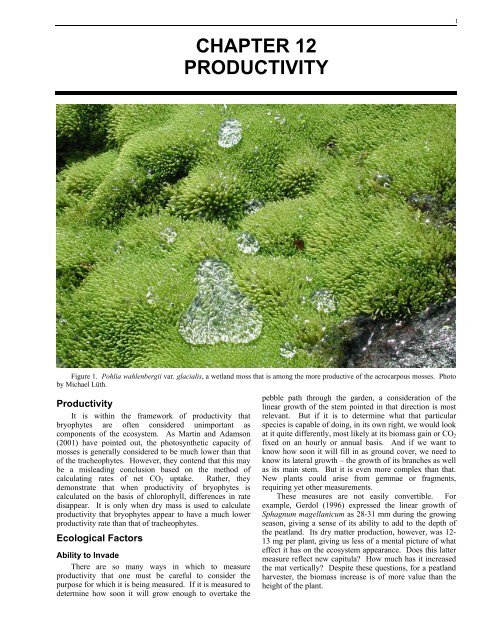
Figure 1. Pohlia wahlenbergii var. glacialis, a wetland moss that is among the more productive of the acrocarpous mosses. Photo<br />
by Michael Lüth.<br />
Productivity<br />
It is within the framework of productivity that<br />
bryophytes are often considered unimportant as<br />
components of the ecosystem. As Martin and Adamson<br />
(2001) have pointed out, the photosynthetic capacity of<br />
mosses is generally considered to be much lower than that<br />
of the tracheophytes. However, they contend that this may<br />
be a misleading conclusion based on the method of<br />
calculating rates of net CO2 uptake. Rather, they<br />
demonstrate that when productivity of bryophytes is<br />
calculated on the basis of chlorophyll, differences in rate<br />
disappear. It is only when dry mass is used to calculate<br />
productivity that bryophytes appear to have a much lower<br />
productivity rate than that of tracheophytes.<br />
Ecological Factors<br />
Ability to Invade<br />
There are so many ways in which to measure<br />
productivity that one must be careful to consider the<br />
purpose for which it is being measured. If it is measured to<br />
determine how soon it will grow enough to overtake the<br />
pebble path through the garden, a consideration of the<br />
linear growth of the stem pointed in that direction is most<br />
relevant. But if it is to determine what that particular<br />
species is capable of doing, in its own right, we would look<br />
at it quite differently, most likely at its biomass gain or CO2<br />
fixed on an hourly or annual basis. And if we want to<br />
know how soon it will fill in as ground cover, we need to<br />
know its lateral growth – the growth of its branches as well<br />
as its main stem. But it is even more complex than that.<br />
New plants could arise from gemmae or fragments,<br />
requiring yet other measurements.<br />
These measures are not easily convertible. For<br />
example, Gerdol (1996) expressed the linear growth of<br />
Sphagnum magellanicum as 28-31 mm during the growing<br />
season, giving a sense of its ability to add to the depth of<br />
the peatland. Its dry matter production, however, was <strong>12</strong>-<br />
13 mg per plant, giving us less of a mental picture of what<br />
effect it has on the ecosystem appearance. Does this latter<br />
measure reflect new capitula? How much has it increased<br />
the mat vertically? Despite these questions, for a peatland<br />
harvester, the biomass increase is of more value than the<br />
height of the plant.<br />
1
2 Chapter <strong>12</strong>: Productivity<br />
Niche Differences<br />
Conditions that favor one species of bryophyte may be<br />
detrimental to another. This permits the slow-growing<br />
bryophytes to co-exist for a long time, with one species<br />
advancing more in one year and the other advancing more<br />
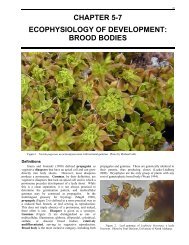
in another (Zhang . Arscott et al. (2000) demonstrated this<br />
with their 13-year experiment in two Arctic streams. An<br />
increase in phosphorus caused little difference in the<br />
clump-forming Schistidium agassizii (Figure 2), whereas<br />
the formerly rare mat-forming species of Hygrohypnum<br />
(Figure 2) increased rapidly. Furthermore, Hygrohypnum<br />
species had greater tolerance to elevated temperatures<br />
(>20ºC) than did S. agassizii, whereas the latter recovered<br />
easily from desiccation, while Hygrohypnum was<br />
susceptible to damage.<br />
Figure 2. Upper: Hygrohypnum ochraceum forming mats.<br />
Lower: Schistidium agassizii forming clumps. Photos by<br />
Michael Lüth.<br />
Growth<br />
Growth is one measure of productivity, but it has two<br />
components: biomass gain and increase in length<br />
(including branches). As Schwinning (1993) pointed out,<br />
unequal growth rates within a species can result from<br />
environmental and other factors independent of the<br />
productivity. She attributed these unequal rates to genetic<br />
differences, site differences, and competition (both infraand<br />
interspecies).<br />
Growth Measurements<br />
Growth measurement is never easy in a non-linear<br />
subject such as a pleurocarpous moss. For example,<br />
several authors (Rincon & Grime 1989; Zechmeister 1995;<br />
Stark et al. 2001) have concluded that measuring stem<br />
elongation only may provide an inaccurate picture of true<br />
productivity. In fact, biomass accumulation and shoot<br />
elongation are uncoupled events and biomass is a better<br />
predictor of productivity than is elongation (Stark 2002).<br />
As a result, the methods used for measuring bryophyte<br />
growth are varied, each having its own purpose for a<br />
particular growth habit.<br />
In larger, perennial mosses it is possible to determine<br />
growth because the plant provides natural markers (innate<br />
markers of Russell 1988; Figure 3). In their seminal papers<br />
on phenology of bryophytes, Longton and Greene (1969a,<br />
b) estimated annual growth rates using attached cotton<br />
markers to measure each stem, measuring distances<br />
between innate markers (inflorescence position), and<br />
measuring the length of the green apical portion of the<br />
stem. Hagerup (1935) used the alternating leaf sizes of<br />
taxa such as Ceratodon purpureus to measure annual<br />
growth.<br />
Figure 3. Left: Alternating regions of large and small<br />
leaves illustrating natural markers of growth on a species of<br />
Bryum, based on Hagerup (1935). Right: Hylocomium splendens<br />
– arrows indicate region markers for a new season of growth.<br />
Drawings by Margaret Minahan.<br />
In others, such as Philonotis fontana (Figure 4) and<br />
Aulacomnium palustre, innovations (new branches just<br />
below the apex) often mark new growth, but the first leaves<br />
of new growth also cause a constriction compared to the<br />
smaller (or larger) leaves ending the previous growing<br />
season. In other taxa, there is a wider spacing of the leaves<br />
at the beginning of each new season, again causing a clear<br />
demarcation between years.<br />
Figure 4. Philonotis calcarea showing multiple innovations<br />
just beneath the antheridial splash cup. Photo by Michael Lüth.<br />
In males of Polytrichaceae and others, new growth can<br />
arise from a splash cup so that one can trace back through a
series of splash cups to measure growth (Figure 5). These<br />
various interruptions are useful in many of the acrocarpous<br />
moss taxa and at least some leafy liverworts. In<br />
pleurocarpous taxa, a new set of branches may arise,<br />
providing a marker, as is most exquisitely exhibited in the<br />
stair-step moss, Hylocomium splendens (Figure 3). But<br />
these markers tell us only the total growth for the year, and<br />
not the season of growth, and in many pleurocarpous<br />
mosses, more than one set of branches can arise in a single<br />
year, as in Fontinalis (Glime 1982).<br />
Figure 5. Polytrichastrum showing new growth from splash<br />
cups (arrows). Photo by Michael Lüth.<br />
Changes in color can demarcate the growth of the<br />
current season, but these are difficult to discern for more<br />
than one year (Figure 6).<br />
Figure 6. Polytrichum commune showing change in color<br />
from dark green to light green where the current year's growth<br />
begins. Photo by Michael Lüth.<br />
Hawes et al. (2002) determined the ages of mosses in a<br />
lake bed of the Canadian High Arctic by using annual<br />
growth bands. These bands were 10-30 mm in length and<br />
were apparent due to changes in leaf density and size. The<br />
most recent growth provided four - five bands with<br />
recognizable leaves and measurable concentrations of<br />
chlorophyll a. Another twelve bands were recognizable<br />
from leaf scars. However, their attempt to correlate effects<br />
of ice cover with growth in a given year failed, and they<br />
suggested that the relationship of ice cover to growth (and<br />
growth bands) was more complex.<br />
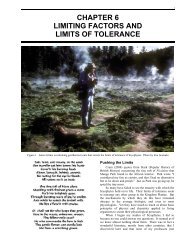
Russell (1988) described eight methods for measuring<br />
growth (Figure 7), including innate markers. The cranked<br />
Chapter <strong>12</strong>: Productivity 3<br />
wire technique is commonly employed for Sphagnum, but<br />
suffers from the problem of compaction of the mat,<br />
particularly as a result of snow, thus underestimating<br />
growth, particularly for more than one year. Tags can be<br />
used to mark a specific point on the moss from which<br />
future measurements are taken, but one must be careful not<br />
to injure the stem or interfere with water movement. A<br />
modification of this method works well for Fontinalis and<br />
other aquatics (Glime 1980, 1982); narrow strips of white<br />
velcro are placed around the stem as markers (black velcro<br />
seems to have a toxic dye); for terrestrial mosses, the velcro<br />
may interfere with water transport, spacing, and drying.<br />
Figure 7. Methods usable for measuring bryophyte shoot<br />
extension growth. Left figure of each pair represents the starting<br />
condition and time; right figure represents end of measuring<br />
period. Modified from Russell (1988).<br />
Nets placed over the mosses (Figure 7) likewise<br />
provide a starting point for measurements but suffer<br />
problems similar to the compaction problems with the<br />
cranked wire, although generally it is the older parts that<br />
get compacted most. Vital stains that are not water soluble<br />
can serve as markers, including fluorescent dyes and<br />
powders; these must be selected not to interfere with<br />
photosynthesis or alter nutrient concentrations. Bags<br />
constructed of nylon mesh can be used to mark a starting<br />
point, with an initial measurement of the protruding stems.<br />
Russell (1988) recommends cutting the stems to a known<br />
length and putting them in the bag, neatly arranged upright;<br />
note that this is a flat bag, and the growing tip should not<br />
be removed. Gremmen et al. (1975) and Russell (1984)<br />
used a coring method in which they cut horizontally<br />
through the soil beneath the bryophytes, then spread small<br />
pieces of polystyrene pellets or other marker before
4 Chapter <strong>12</strong>: Productivity<br />
replacing the moss, thus providing a marker from which to<br />
measure. This method could again suffer from compaction<br />
problems, depending on the species of bryophyte.<br />
Photography can give rates of advancement of a colony<br />
but cannot provide details of growth and provides only<br />
horizontal growth, not vertical assessment. Similarly,<br />
sheets of clear plastic can be placed over the moss patch<br />
and outlines drawn for future comparison. Zhang (1998)<br />
used the latter method to show that location of moss<br />
patches on the forest floor is quite dynamic.<br />
Growth rates may include only the dominant stem, or<br />
the sum of all the branches as well. Smith (1982) found<br />
that the epiphytic Isothecium myosuroides (Figure 8) in<br />
England never grew more than 16 mm per year. In an even<br />
drier habitat, on dry, exposed, granite ledges in<br />
northwestern Ontario, Vitt (1989) measured a yearly<br />
growth rate of 2.3-3.1 mm yr -1 for Racomitrium<br />
microcarpon. Vitt (1990) also measured growth as lateral<br />
expansion of a clone. In clumps of Pylaisiella polyantha<br />
on the bases of poplars, the yearly increase was about 6-8<br />
mm yr -1 .<br />
Figure 8. Isothecium myosuroides on tree. Photo by<br />
Michael Lüth.<br />
Biomass measurements for living bryophytes are often<br />
meaningless because of their tremendous ability to<br />
sequester water, not only internally but also externally.<br />
Wet mass can be up to 20 times the dry mass of Sphagnum,<br />
making any wet mass measure meaningless for comparison<br />
purposes. Drying the moss, however, creates a new<br />
variable that necessarily terminates the experiment and may<br />
therefore not be practical. Furthermore, dry mosses can<br />
gain sufficient atmospheric moisture to show measurable<br />
mass gain during the short time required to weigh them<br />
(personal observation). In cases where light availability is<br />
the same for all members of a population, biomass and<br />
growth in length can be correlated and either might be<br />
chosen as a measure of productivity, depending on the<br />
goals of the study.<br />
Annual Length Increase<br />
Length increase is generally related to growth form,<br />
with acrocarpous mosses exhibiting slow rates of growth in<br />
length compared to pleurocarpous mosses (Table 1). The<br />
pleurocarpous taxa further increase their biomass by<br />
development of new branches, creating an exponential<br />
growth pattern. Among these pleurocarpous bryophytes,<br />
some can become very long and have high growth rates,<br />
with some Fontinalis (Glime 1987b) and Sphagnum species<br />
growing 400 mm in a season. Taxiphyllum barbieri (Java<br />
moss, often mistakenly called Vesicularia dubyana) can<br />
quickly fill a 50 gallon aquarium through extensive<br />
branching and length gain.<br />
On Signy Island in the Antarctic, the upright<br />
Polytrichum strictum grows 2-5 mm, whereas at Pinawa,<br />
Manitoba it grows 15-55 mm per year, exhibiting<br />
differences due to microclimate and habitat (Longton 1974,<br />
1979). Pitkin (1975) showed wide variation in growth of<br />
Hypnum cupressiforme, depending on its height on the tree<br />
trunk, with mm of growth at 30-100 cm above ground<br />
doubling that at 150-200 cm from 23 May to 6 October.<br />
Not surprisingly, growth of the upper side of a sloping<br />
trunk was more than double that on the lower side.<br />
Table 1. Comparison of growth in length of various mosses from a variety of locations and habitats.<br />
Species mm yr -1 Location Reference<br />
Forsstroemia trichomitria 3.85-4.45 Virginia Stark 1986<br />
Calliergon 10-30 Arctic Hawes et al. 2002<br />
lake species 10 Canadian Arctic Sand-Jensen et al. 1999<br />
Leucobryum glaucum 9.1 S. England Bates 1989<br />
Meesia triquetra 3.7-14.8 Devon Island Vitt & Pakarinen 1977<br />
Ptilidium pulcherrimum 3.5-6.3 N. Sweden Jonsson & Söderström 1988<br />
Sphagnum magellanicum 28-31 S. Alps, Italy Gerdol 1996<br />
Sphagnum papillosum 33 Gaberscik & Martincic 1987<br />
Sphagnum spp. 4-24 northern Quebec Moore 1989<br />
Polytrichum strictum 2-5 Antarctic Longton 1979<br />
Polytrichum strictum 15-55 1 Pinawa, Manitoba, Canada Longton 1979<br />
Fontinalis duriaei 400 (incl branches) N. <strong>Michigan</strong> Glime 1987a<br />
Rhynchostegium riparioides 33.4-73.3 streams, Northern Pennines, England Kelly & Whitton 1987<br />
Racomitrium lanuginosum 5.4-6.7 Marion Island Russell 1984<br />
Racomitrium lanuginosum 2.3 Mt Fuji Nakatsubo 1990<br />
Racomitrium lanuginosum 5-15 England Tallis 1959, 1964<br />
Racomitrium microcarpon 2.3-3.1 NW Ontario Vitt 1989
Uncoupling<br />
In bryophytes, as in some other plants, the increase in<br />
height/length may not be well correlated with increase in<br />
biomass. For example, in loblolly pine, branching becomes<br />
denser in low-density populations, but in high-density<br />
populations the trees grow taller. Likewise, self shading or<br />
other causes of low light cause elongation without a<br />
concomitant gain in biomass, as illustrated by grass<br />
elongation under a board on your lawn. A more interesting<br />
phenomenon is that biomass increases and elongation may<br />
not occur at the same time. Rincon and Grime (1989)<br />
showed very clearly that growth in length and increase in<br />
biomass of Brachythecium rutabulum, Thuidium<br />
tamariscinum, and Lophocolea bidentata may be almost<br />
inverse relationships. When dry matter production<br />
declined, there was an increase in length, causing a<br />
negative biomass production (Figure 9). This, however, is<br />
not true for all species, as seen by Plagiomnium undulatum<br />
and Pseudoscleropodium purum (Figure 9).<br />
The uncoupling of growth in length with that of<br />
branches is not surprising. As branches elongate, more<br />
distance is available for branch buds to form. In<br />
Leptodictyum riparium, total growth and growth of<br />
branches increase together (Sanford 1979). The rate of<br />
main axis growth, on the other hand, decreases as the rate<br />
of branch growth increases.<br />
Figure 9. Comparison of relative growth rates in length and<br />
dry matter production in five bryophytes from calcareous<br />
grasslands. Redrawn from Rincon & Grime (1989).<br />
At least in Sphagnum, this uncoupling seems to be<br />
reflected in seasonal carbohydrate content as well<br />
(Shiraishi et al. 1996). In the Hakkoda Mountains of<br />
Chapter <strong>12</strong>: Productivity 5<br />
Japan, the glucose content of three Sphagnum species was<br />
highest in summer. Shiraishi et al. (1996) attributed this to<br />
an uncoupling between the active periods of matter<br />
production and growth. Sucrose, however, peaked in<br />
autumn in S. papillosum and S. nemoreum, presumably in<br />
preparation for winter, and the seasonal changes were<br />
different between these two hummock species and S.<br />
tenellum, a hollow species.<br />
Gaberscik and Martincic (1987) likewise found that<br />
net photosynthesis did not correlate with growth. In<br />
August, when photosynthesis was maximal, biomass<br />
accumulation actually decreased. Chlorophyll content<br />
correlated positively with this period of high net<br />
photosynthesis, and consequently did not correlate with<br />
growth. Rather, the most intensive dry mass increase was<br />
at the beginning of the growing season. Winter was a low<br />
period for both photosynthesis and growth.<br />
Seasonal Differences<br />
We have assumed maximum growth of most temperate<br />
bryophytes to be in the spring when moisture is usually<br />
abundant and temperatures are cool. In their study of<br />
standing crops, Al-Mufti et al. (1977) supported this<br />
premise, showing that the peak standing crop in bryophytes<br />
occurred in May, the culmination of spring growth, and<br />
again in December, following cooler and more moist<br />
weather of autumn. The lowest biomass was in August<br />
when bryophytes would have suffered respiratory loss in<br />
the heat of summer. Zotz and Rottenberger (2001) likewise<br />
found this for three moss species [Grimmia pulvinata<br />
(Figure 10), Schistidium apocarpum, Syntrichia ruralis] on<br />
an exposed limestone wall in temperate Europe, with a<br />
strong seasonal pattern showing highest carbon fixation in<br />
autumn and near zero in summer.<br />
Figure 10. Grimmia pulvinata showing white awns that are<br />
common among xerophytic bryophytes. Photo by Michael Lüth.<br />
However, we need more field studies to corroborate<br />
this assumption of spring growth on a broad scale. Growth<br />
in bryophytes has been difficult to measure because it is<br />
slow and increments are small, with yearly increments<br />
measuring in mm in many taxa.<br />
Kershaw and Webber (1986) approached the seasonal<br />
behavior from a different angle, showing that in a forest<br />
habitat, chlorophyll was highest in Brachythecium<br />
rutabulum in summer when light intensity was lowest.
6 Chapter <strong>12</strong>: Productivity<br />
Low light, coupled with high temperatures, contributes to<br />
low summer productivity.<br />
In a temperate, semi-arid, sandy grassland, Syntrichia<br />
ruralis was strongly dependent on its microclimatic<br />
conditions and followed the same general principles I have<br />
suggested (Juhász et al. 2002). Its highest productivity,<br />
however, was in December and January, with carbon gain<br />
beginning in October. It was dormant throughout the hot,<br />
dry summer. In a different study where the temperate<br />
grassland had cover provided by Juniperus communis<br />
shrubs, those species that occurred in the open exhibited a<br />
decline in photosynthetic efficiency from the humid spring<br />
to the hot, dry summer and exhibited lower efficiency<br />
(Fv/Fm) than those bryophytes growing in the shade of the<br />
shrubs (Kalapos & Mázsa 2001).<br />
But not all habitats create such pronounced seasonal<br />
differences. In the subarctic, Dicranum fuscescens<br />
exhibited no clear seasonal differences in daily CO2 uptake,<br />
nor were there any apparent differences between lowland<br />
and highland sites (Hicklenton & Oechel 1977). Melick<br />
and Seppelt (1994) found no seasonal differences in<br />
carbohydrates levels in continental Antarctica, although<br />
chlorophyll levels did decrease during winter. One reason<br />
for this apparent lack of seasonality is the high degree of<br />
daily variation that is experienced by bryophytes in Arctic<br />
and Antarctic areas.<br />
Nevertheless, seasonal water availability can impose<br />
seasonal differences, even in these northern regions. In<br />
peatland habitats, productivity may respond to greater<br />
water availability in summer, but decrease if the moss<br />
becomes submerged (Suyker et al. 1997), increasing again<br />
as they achieve greater CO2 exchange with receding water.<br />
Skré and Oechel (1981) demonstrated, in their two years of<br />
study of the Alaskan taiga, that increased amounts of<br />
young, photosynthetically active tissue near the end of the<br />
growing season in the mosses Polytrichum commune,<br />
Pleurozium schreberi, Hylocomium splendens, and<br />
Sphagnum subsecundum accounted for their highest<br />
maximum net photosynthesis occurring in August.<br />
Williams and Flanagan (1998) reported maximum<br />
photosynthetic rates of Sphagnum in summer (14 µmol m -2<br />
s -1 ) compared to spring (5 µmol m -2 s -1 ) and autumn (6<br />
µmol m -2 s -1 ). In the same habitat, however, Pleurozium<br />
schreberi had no seasonal variation, with mean rates of 7,<br />
5, and 7 µmol m -2 s -1 during spring, summer, and autumn,<br />
respectively.<br />
Asada et al. (2003) showed that winter growth was<br />
important for the Sphagnum species in the hypermaritime<br />
coastal peatland of British Columbia, Canada. Position in<br />
the hummock seemed to be important, with lower<br />
productivity on the hummocks than in the hollows, again<br />
emphasizing the importance of water availability.<br />
In the maritime Antarctic, respiration in<br />
Brachythecium is highest in summer and lowest in winter,<br />
regardless of temperature, whereas in Chorisodontium and<br />
Andreaea, there is little difference, perhaps relating to their<br />
drier habitats (Davey & Rothery 1996). Photosynthesis<br />
rates are generally higher in summer. The optimum<br />
temperature for photosynthesis does not change between<br />
summer and winter.<br />
Etiolation<br />
Elongation can be misleading. Low radiation causes<br />
greater elongation, with the highest elongation in Dicranum<br />
majus (Figure 11) from various polluted areas occurring at<br />
the lowest irradiance (20 µM m -2 s -1 ) (Bakken 1995).<br />
Etiolation (excessive elongation and loss of chlorophyll<br />
due to insufficient light) can easily be observed if mosses<br />
are collected fresh, then put into a sealed plastic bag and<br />
stored in a nearly dark place. More on this phenomenon is<br />
discussed in the chapter on light.<br />
Figure 11. Dicranum majus exhibiting a large plant size<br />
typical of low light conditions. Photo by Michael Lüth.<br />
Belowground Productivity<br />
It is rather presumptuous to title anything related to<br />
bryophytes as "Belowground Productivity" because data<br />
reporting such values are woefully lacking. Yet,<br />
bryophytes have rhizoids, and much of that biomass exists<br />
below ground, so such a title is not absurd. Furthermore,<br />
bryophytes have underground rhizomes, particularly in the<br />
Polytrichaceae. Sveinbjörnsson and Oechel (1981) have<br />
shown the respiration in the rhizome relative to whole plant<br />
CO2 gain (Figure <strong>12</strong>). Nevertheless, this is but an indirect<br />
indication that biomass is in place and active there with no<br />
indication of the carbon needed to put it there.<br />
Figure <strong>12</strong>. Relationship of aboveground and belowground<br />
CO2 flux in Polytrichastrum alpinum and Polytrichum commune<br />
in the Alaskan tundra. Redrawn from Sveinbjörnsson & Oechel<br />
(1981).
Sporophyte Productivity<br />
A discussion of the ability of the sporophyte to carry<br />
out photosynthesis is in Chapter 2-7, Bryopsida, and in<br />
Chapter 5-9, Ecophysiology of Development: Sporophyte.<br />
We know that bryophyte sporophytes have chlorophyll,<br />
even in thallose liverworts (Bold 1948), but few<br />
independent measurements of their rates of productivity<br />
seem to exist. These are further complicated by the<br />
photosynthetic capacity of the spores inside.<br />
Nevertheless, Paolillo and Bazzaz (1968) demonstrated<br />
in Funaria and Polytrichum that the shape of the light<br />
saturation curve of the sporophyte is close to that of the<br />
gametophyte. For Polytrichum, the weight of the<br />
gametophyte decreases as that of the sporophyte increases<br />
and there is no net photosynthetic gain by the sporophyte,<br />
but such is not the case in Funaria. In Funaria, there is a<br />
net photosynthetic gain. In Funaria the calyptra is perched<br />
at the end of the capsule and covers little of it, whereas in<br />
Polytrichum the capsule is completely covered (Figure 13).<br />
The authors conclude that the seta serves as a reservoir for<br />
the developing capsule.<br />
Figure 13. Left: Polytrichum calyptra covering capsule<br />
completely. Photo by Janice Glime. Right: Funaria calyptra<br />
covering only the end of the capsule. Photo by Michael Lüth.<br />
Productivity and Aging<br />
The current year's tissues seem to be the primary site<br />
of photosynthesis for most mosses. Collins and Oechel<br />
(1974) found that early in the season, the photosynthesis of<br />
Alaskan mosses relied on tissues produced the previous<br />
year, or even previous two years, but those rates were<br />
lower than for tissues produced in the current year (75%<br />
and 40% for 1 and 2 years earlier, respectively). Callaghan<br />
and coworkers (1978) found an even greater reduction in<br />
Swedish Lapland mosses. One-year-old tissues had rates<br />
55% lower in Hylocomium splendens and 58% lower in<br />
Polytrichum commune than those tissues produced in the<br />
current year.<br />
Life Span<br />
We have expressed productivity in measurements from<br />
seconds to annual, but in consideration of the ecosystem, it<br />
is also appropriate to speak in terms of a lifetime.<br />
Although our knowledge of life spans is still meager, we do<br />
have indications in some species, although they may be<br />
Chapter <strong>12</strong>: Productivity 7<br />
minimal rather than maximal ages. For example, Frye<br />
(1928) found specimens of Stokesiella oregana that were<br />
up to six years old. Ulychna (1963) reported mean ages for<br />
Polytrichum commune of 3-4 years, with dead parts of 15-<br />
17 years age, although if they were not growing in<br />
hummocks the dead parts seemed to be only 4-5 years old.<br />
Corollary to the importance of life span is the effect<br />
that age has on growth rate. Ulychna (1963) found no<br />
effect in Hylocomium splendens or Polytrichum commune.<br />
In the same two species, Callaghan et al. (1978) found that<br />
Hylocomium splendens grows its fronds for two years, then<br />
produces new segments, a factor that would be misleading<br />
in determining its age by its branching. Other factors can<br />
mislead age determinations based on growth markers.<br />
Polytrichum commune continues to have photosynthesis in<br />
dry conditions, whereas H. splendens ceases.<br />
New growth may keep pace with dying portions<br />
(Callaghan et al. 1978). In Hylocomium splendens,<br />
normally the new shoot replaces the decomposing distal<br />
portion, but if the young segment is damaged, the whole<br />
shoot dies. On the other hand, Polytrichum commune has a<br />
finite life expectancy which may differ with geographic<br />
area, but it also has an underground proliferation that can<br />
give rise to new shoots and compensate for lack of<br />
branching and death of aboveground parts.<br />
In the maritime Antarctic, Polytrichum strictum<br />
(Figure 14) can have the extremely high annual mortality<br />
rate of 32% in young turfs (Collins 1976). However, in<br />
pure older turfs it is closer to 13%.<br />
In the Arctic, longevity may compensate for the slow<br />
growth rates. Sand-Jensen et al. (1999) found that the<br />
slow, but steady-growing lake bottom mosses could persist<br />
for up to 17 years, retaining green leaves for several years,<br />
and decomposing slowly. Their growth rate, however, was<br />
only 10 mm per year, a relatively slow rate compared to<br />
pleurocarpous aquatic mosses elsewhere.<br />
Figure 14. Polytrichum strictum illustrating the protection<br />
plants give each other in older tufts. Photo by Michael Lüth.<br />
Leaf Production and LAI<br />
Vitt (1990) decided to investigate the number of leaves<br />
and other leaf parameters that have been ignored for<br />
bryophytes. He did this to illustrate the complexity of moss<br />
populations, a fact usually not realized by most ecological<br />
observers. Using Drummondia prorepens, a small moss<br />
with large leaves, he found about 90 stems per cm 2 . The
8 Chapter <strong>12</strong>: Productivity<br />
stems averaged ca. 65 leaves each, resulting in 6000 leaves<br />
per cm 2 . Considering the available leaf for photosynthesis,<br />
he determined that one cm 2 has ~15 cm 2 of photosynthetic<br />
moss surface.<br />
The leaf area index has been used to express the<br />
relationship of the leaf-to-light interception (Smith 1990).<br />
It is the ratio of the leaf area to ground area, using the same<br />
units. Thus, a low LAI indicates wasted sunlight. A value<br />
of 1 indicates full usage, and a value of greater than 1<br />
permits maximum usage at more angles of the sun. Since<br />
bryophyte leaves generally are not perpendicular to the sun,<br />
a higher LAI is required to obtain the same amount of light.<br />
Simon (1987) estimated LAI measurements on<br />
Syntrichia ruralis, with 2030 leaves cm -2 , and Ceratodon<br />
purpureus, with 27,966 leaves cm -2 . These had leaf area<br />
indices (LAI) of 44 and <strong>12</strong>9 respectively. We can state the<br />
LAI for Drummondia prorepens, based on Vitt's (1990)<br />
data, as 15, discounting the portion of the leaf that is nonphotosynthetic.<br />
Vitt (1990) reported a mean leaf area of<br />
1960 mm 2 cm -2 (LAI = 19.6) for mosses in the boreal<br />
biome.<br />
Table 2. Comparison of biomass devoted to photosynthesis vs storage and respiration for plants from major biomes. From Larcher<br />
(1983) and compiled from many sources.<br />
Plant Green mass Purely respiratory organs<br />
(photo-<br />
synthetically Woody stems Roots and<br />
active organs) above ground subterranean<br />
shoots<br />
Evergreen trees of tropical ca. 2% 80-90% 10-20%<br />
and subtropical forests<br />
Deciduous trees of the 1-2% ca. 80% ca. 20%<br />
temperate zone<br />
Evergreen conifers of the taiga 4-5% ca. 75% ca. 20%<br />
and in mountain forests<br />
Alpine scrubwood ca. 25% ca. 30% ca .45%<br />
Young conifers 50-60% 40-50% ca. lo%<br />
Ericaceous dwarf shrubs 10-20% ca. 20% 60-70%<br />
Grasses 30-50% 50-70%<br />
Steppe plants<br />
Wet years ca. 30% ca. 70%<br />
Dry years ca. 10% ca. 90%<br />
Desert plants 10-20% 80-90%<br />
Arctic tundra<br />
Tracheophytes 15-20%<br />
Cryptogams (including bryophytes) >95%<br />
Plants of the high mountains 10-20% 80-90%<br />
Energy Content<br />
One distinction among plants is the amount of their<br />
tissue used for storage vs that used for photosynthesis. In<br />
this regard, the bryophyte uses nearly all of its tissue for<br />
photosynthesis, although I question whether it is as high as<br />
the 95% shown in Table 2. Using the category of<br />
cryptogams includes the lichens, club mosses, horsetails,<br />
and ferns, complicating the interpretation of the number.<br />
Fungal Partners<br />
Although most bryophytes are self-reliant,<br />
photosynthetic organisms, some do benefit from fungal<br />
partners. The achlorophyllous thallose liverwort<br />
Cryptothallus mirabilis (Figure 15) relies totally on an<br />
endophytic fungus for its carbon input (Ligrone et al.<br />
1993). The fungus is associated with the bases of the<br />
rhizoids and does not penetrate the thallus. There is no<br />
evidence that a third partner is involved; associated trees<br />
have a different fungal partner. Rather, it most likely gains<br />
its carbon from the organic nutrients in the soil and litter.<br />
Its dependency on this fungal carbon source is supported by<br />
its failure to develop beyond a few cells in sterile culture.<br />
Figure 15. Cryptothallus mirabilis, an achlorophyllous<br />
thallose liverwort. Photo by Michael Lüth.<br />
In Aneura pinguis (Figure 16; Ligrone et al. 1993),<br />
Conocephalum conicum (Ligrone & Lopes 1989), and<br />
Phaeoceros laevis (Ligrone 1988), it appears that it is the<br />
fungus that benefits, not the liverwort.
Figure 16. Aneura pinguis, a thallose liverwort. Photo by<br />
Michael Lüth.<br />
Recent History<br />
Previous conditions have a strong influence on the<br />
photosynthetic performance of plants, at least among some<br />
Alaskan mosses (Alpert & Oechel 1987). Assemblages of<br />
mosses having recent experience with low water<br />
availability achieved maximum net photosynthesis at lower<br />
water contents than did those that had remained hydrated.<br />
Likewise, those mosses that occurred in sites with low light<br />
availability achieved higher net photosynthesis at lower<br />
light intensities than mosses that had recent history in high<br />
light intensities. And a close relationship exists between<br />
the lower temperature limit for 85% photosynthesis and the<br />
mean maximum tissue temperature for the previous fiveday<br />
period (Oechel 1976).<br />
Recent history most likely accounts for the<br />
considerably lower productivity in spring, compared to<br />
summer, in Atrichum undulatum, Plagiomnium affine, and<br />
Polytrichum formosum (Baló 1967). One reason for this is<br />
the much higher chlorophyll a content in summer,<br />
compared to spring. Such previous histories can account<br />
for much of the variation we see between measurements of<br />
the same species and even the same individuals.<br />
Mitotic Activity<br />
It appears that mitotic activity, the initial step in new<br />
growth, has its own clock. In a study on Pellia borealis, a<br />
thallose liverwort, the greatest activity occurs between<br />
11:00 and 14:00 hours (Szewczyk 1978). However, further<br />
studies are needed to determine if this is an endogenous<br />
rhythm or is tied to a daily ecological event in its habitat.<br />
Respiration<br />
Nearly every photosynthetic study includes respiration<br />
measurements. However, these may not be reported<br />
separately. Net photosynthesis is that incorporated carbon<br />
that remains after carbon is lost as CO2 in respiration.<br />
<strong>Bryophyte</strong>s, as C3 plants, exhibit both dark respiration<br />
and photorespiration. Photorespiration is difficult to<br />
measure because of the ability of a plant to put that same<br />
lost CO2 immediately back into carbohydrate through the<br />
photosynthetic pathway. Photorespiration in C3 plants is<br />
generally up to three times greater than dark respiration and<br />
accounts for the loss of energy at high temperatures. But<br />
even dark respiration increases in summer, as noted in<br />
Plagiomnium acutum and P. maximoviczii in China (Liu et<br />
al. 2001).<br />
Chapter <strong>12</strong>: Productivity 9<br />
Davey and Rothery (1996) found respiration in<br />
Brachythecium in the maritime Antarctic was highest in<br />
summer and lowest in winter at all temperatures, whereas<br />
Chorisodontium and Andreaea exhibited little change.<br />
Priddle (1980b) found that the dark respiration of two<br />
Antarctic species of aquatic mosses (Calliergon<br />
sarmentosum and Drepanocladus sp.) differed little from<br />
that of the algal communities in the same lake. At normal<br />
lake temperatures (up to 5ºC), the mosses respired<br />
approximately 0.3 g mg -1 ash-free dry mass h -1 .<br />
In the high Arctic Svalbard, Sanionia uncinata exhibits<br />
a high Q10 (ratio of reaction rates for a 10ºC rise) of 3 for<br />
respiration in the range of 7-23°C (Uchida et al. 2002). In<br />
the same range, photosynthesis exhibits very little<br />
difference, resulting in low temperature optima.<br />
Habitat and Geographic Comparisons<br />
Because of the length of the growing season,<br />
temperatures during the growing season, day length,<br />
available water, and other geographic and climatic factors,<br />
productivity in various biomes differs. Table 3 compares<br />
the various biomes to provide a framework for the<br />
discussion of habitat differences among bryophytes. Table<br />
4 and Table 5 compare rates on biomass and area bases,<br />
respectively.<br />
Although water may be a good indicator of<br />
productivity of a habitat, the general water availability of<br />
the habitat is not a good indicator of the productivity at the<br />
time that water is available. In fact, the relationship seems<br />
to be inverse. As can be seen in Table 3, the highest<br />
productivity seems to be from the driest habitats and from<br />
the plants adapted to those habitats. On the other hand,<br />
Suba et al. (1982) found that hygrophytic and mesophytic<br />
mosses of a beechwood community had more<br />
photosynthetic intensity than more xerophytic rockinhabiting<br />
mosses. History is probably important here.<br />
In the boreal forest, it appears that the light use<br />
efficiency of Pleurozium schreberi (102 mM CO2 M -1 ) is<br />
well above that of most of the plants there (70-80 mM CO2<br />
M -1 ), but its productivity is still lower (1.9 µM m -2 s -1<br />
(Whitehead & Gower 2001). Other understory shrubs and<br />
herbaceous plants had productivity mostly between 9 and<br />
11 µM m -2 s -1 .<br />
For aquatic bryophytes, depth affects light intensity.<br />
Growth rates of deepwater mosses can be quite slow (10<br />
mm per year in Canadian High Arctic lakes), and vary little<br />
between years (Sand-Jensen et al. 1999). Martínez Abaigar<br />
et al. (1994) found that Scapania undulata had a leaf<br />
specific area of 317 cm 2 g -1 DM at 5 cm depth, but at 45 cm<br />
depth, the LSA increased to 399 cm 2 g -1 DM.<br />
Concomitantly, the leaf specific weight (mass) was reduced<br />
from 3.16 mg cm -2 to 2.50 mg cm -2 . These differences can<br />
be interpreted as a response to the lower light availability at<br />
45 cm. Canopy leaf fall, on the other hand, caused an<br />
increase in accessory pigments relative to chlorophyll a.<br />
Furness and Grime (1982) found that species of<br />
disturbed habitats (ruderal species) such as Funaria<br />
hygrometrica had high relative growth rates, as did<br />
perennial pleurocarpous species such as Brachythecium<br />
rutabulum from fertile habitats. Most species grew best at<br />
temperatures of 15-25°C, whereas temperatures above 30ºC<br />
eventually killed moist mosses.
10 Chapter <strong>12</strong>: Productivity<br />
Rates of Productivity<br />
Productivity varies with habitat (Table 3). Mosses,<br />
typically living in shaded habitats, are low in productivity<br />
compared to other plant groups (Table 6). In the Antarctic,<br />
Davey and Rothery (1996) found greater seasonal variation<br />
in bryophytes from hydric habitats than from the less<br />
hydric sites.<br />
Probably the highest productivity ever measured for a<br />
bryophyte is that of Sphagnum, with a productivity of <strong>12</strong><br />
tons per hectare per year (Schofield 1985). C4 plants<br />
average a CO2 uptake of up to 80 mg dm -2 hr -1 , whereas C3<br />
plants seem to have a max of about 45 (Larcher 1983).<br />
Mosses, on the other hand, have a max of only 3! For some<br />
reason, perhaps the thick cuticle and other adaptations that<br />
reduce the light, CAM plants have a maximum of only 20.<br />
However, since measurement time may not coincide with<br />
the period of photosynthesis, we may need to interpret<br />
these numbers somewhat differently.<br />
Table 3. Comparison of net primary production, biomass, chlorophyll, and leaf surface area in major biomes. From Whittaker et<br />
al. (1974); Larcher (1983).<br />
Leaf Surf Area<br />
Net Primary Production Biomass (dry matter) Chlorophyll LAI<br />
Normal Mean Total Normal Mean Total Mean Total Mean Total<br />
Area range g m -2 yr -1 10 9 range kg m -2 10 9 t g m -2 10 6 t m 2 m -2 10 6 km 2<br />
Ecosystem Type 10 6 km 2 g m -2 yr -1 t yr -1 kg m -2<br />
Tropical rain forest 17.0 1000-3500 2200 37.4 6-80 45 765 3.0 51.0 8 136<br />
Tropical seasonal forest 7.5 1000-2500 1600 <strong>12</strong>.0 6-60 35 260 2.5 18.8 5 38<br />
Temperate forest:<br />
Evergreen 5.0 600-2500 1300 6.5 6-200 35 175 3.5 17.5 <strong>12</strong> 60<br />
Deciduous 7.0 600-2500 <strong>12</strong>00 8.4 6-60 30 210 2.0 14.0 5 35<br />
Boreal forest <strong>12</strong>.0 400-2000 800 9.6 6-40 20 240 3.0 36.0 <strong>12</strong> 144<br />
Woodland and 8.5 250-<strong>12</strong>00 700 6.0 2-20 6 50 1.6 13.6 4 34<br />
shrubland<br />
Savanna 15.0 200-2000 900 13.5 0.2-15 4 60 1.5 22.5 4 60<br />
Temperate grassland 9.0 200-1500 600 5.4 0.2-5 1.6 14 1.3 11.7 3.6 32<br />
Tundra and alpine 8.0 10-400 140 1.1 0.1-3 0.6 5 0.5 4.0 2 16<br />
Desert and 18.0 10-250 90 1.6 0.1-4 0.7 13 0.5 9.0 1 18<br />
semidesert scrub<br />
Extreme desert- 24.0 0-10 3 0.07 0-0.2 0.02 0.5 0.02 0.5 0.05 1.2<br />
rock, sand, ice<br />
Cultivated land 14.0 100-4000 650 9.1 0.4-<strong>12</strong> 1 14 1.5 21.0 4 56<br />
Swamp and marsh 2.0 800-6000 3000 6.0 3-50 15 30 3.0 6.0 7 14<br />
Lake and stream 2.0 100-1500 400 0.8 0-0.1 0.02 0.05 0.2 0.5<br />
Total continental: 149 782 117.5 <strong>12</strong>.2 1837 1.5 226 4.3 644<br />
Open ocean 332.0 2-400 <strong>12</strong>5 41.5 0-0.005 0.003 1.0 0.03 10.0<br />
Upwelling zones 0.4 400-1000 500 0.2 0.005-0.1 0.02 0.008 0.3 0.1<br />
Continental shelf 26.6 200-600 360 9.6 0.001-0.04 0.001 0.27 0.2 5.3<br />
Algal beds and reefs 0.6 500-4000 2500 1.6 0.04-4 2 1.2 2.0 1.2<br />
Estuaries (excluding 1.4 200-4000 1500 2.1 0.01-4 1 1.4 1.0 1.4<br />
marsh)<br />
Total marine 361 - 155 55.0 - 0.01 3.9 0.05 18.0<br />
Full total 510 336 172.5 3.6 1841 0.48 243<br />
Table 4. Productivity rates for bryophytes based on bryophyte mass, ordered from most productive to least. Values refer to CO 2<br />
incorporated; dm refers to dry mass – if dm is not indicated, dry or wet mass is not known for certain.<br />
Species Productivity Value Conditions/Location Reference<br />
Sphagnum auriculatum 232 mg g -1 h -1 submersed at light compensation point Wetzel et al. 1985<br />
Rhynchostegium rusciforme 20.24 mg g -1 h -1 max; converted from mM O2 g -1 h -1 Allen & Spence 1981<br />
Fontinalis antipyretica 15.4 mg g -1 h -1<br />
max; converted from mM O2 g -1 h -1 Allen & Spence 1981<br />
Plagiomnium acutum 19.9 mg g -1 h -1 summer; converted from µM kg -1 s -1 Liu et al. 2001<br />
Plagiomnium maximoviczii 15.0 mg g -1 h -1 summer; converted from µM kg -1 s -1 Liu et al. 2001<br />
Plagiomnium acutum 9.20 mg g -1 h -1 winter; converted from µM kg -1 s -1 Liu et al. 2001<br />
Plagiomnium maximoviczii 9.86 mg g -1 h -1 winter; converted from µM kg -1 s -1 Liu et al. 2001<br />
Hygrohypnum spp. 2.3-8.7 mg g -1 dm h -1 Alaska stream Arscott et al. 2000<br />
Polytrichum formosum 8 mg g -1 dm h -1 Hungary, summer, light saturation Baló 1967<br />
Plagiomnium affine 6 mg g -1 dm h -1 Hungary, summer, light saturation Baló 1967<br />
Atrichum undulatum 5 mg g -1 dm h -1 Hungary, summer, light saturation Baló 1967<br />
Calliergon sarmentosum 4.4 mg g -1 dm h -1 max, Alaska Arctic tundra Oechel & Sveinbjörnsson 1978<br />
Polytrichastrum alpinum 4.4 mg g -1 dm h -1 max, Alaska Arctic tundra Oechel & Sveinbjörnsson 1978<br />
Rhytidiadelphus squarrosus 3.5 mg g -1 dm h -1 max, South Sweden Stǻlfelt 1937<br />
Ptilium crista-castrensis 3.4 mg g -1 dm h -1 max, South Sweden Stǻlfelt 1937<br />
Hylocomium splendens 3.2 mg g -1 dm h -1 max, South Sweden Stǻlfelt 1937
Table 4 (cont.).<br />
Chapter <strong>12</strong>: Productivity 11<br />
Species Productivity Value Conditions/Location Reference<br />
Sphagnum girgensohnii 3.0 mg g -1 dm h -1 Polytrichum commune 2.79 mg g<br />
max, South Sweden Stǻlfelt 1937<br />
-1 h -1<br />
Sphagnum balticum 2.7 mg g<br />
max, mature veg, Fairbanks, Alaska; moist? Skré & Oechel 1981<br />
-1 dm h -1<br />
Polytrichum commune 2.65 mg g<br />
subarctic mire<br />
Johansson & Linder 1980<br />
-1 h -1<br />
Hylocomium splendens 2.5 mg g<br />
max, mature veg, Fairbanks, Alaska; moist? Skré & Oechel 1981<br />
-1 h -1<br />
Rhytidiadelphus triquetrus 2.5 mg g<br />
max, subarctic Finland Kallio & Kärenlampi 1975<br />
-1 h -1<br />
Sphagnum magellanicum 2.2 mg g<br />
max, South Sweden Stǻlfelt 1937<br />
-1 dm h -1 Pleurozium schreberi 2.0 mg g<br />
Petersen 1984<br />
-1 dm h -1 Pohlia drummondii 2.0 mg g<br />
max, South Sweden Stǻlfelt 1937<br />
-1 h -1<br />
Sphagnum papillosum 1.95 mg g<br />
max, subarctic Finland Kallio & Kärenlampi 1975<br />
-1 dm h -1 Sphagnum fuscum 1.7 mg g<br />
max, Aug Gaberscik & Martincic 1987<br />
-1 dm h -1<br />
Polytrichum juniperinum 1.6 mg g<br />
subarctic mire<br />
Johansson & Linder 1980<br />
-1 h -1<br />
Schistidium agassizii 0.59-1.6 mg g<br />
max, subarctic Finland Kallio & Kärenlampi 1975<br />
-1 dm h -1<br />
Dicranum fuscescens 0.1-2 mg g<br />
Alaska stream, converted from O2 to CO2 Arscott et al. 2000<br />
-1 dm h -1 Dicranum fuscescens 1.5 mg g<br />
Arctic, 10 Oct & 7 July, respectively Hicklenton & Oechel 1976<br />
-1 dm h -1 Pterobryum arbuscula 1.5 mg g<br />
max, Alaska Arctic tundra Oechel & Sveinbjörnsson 1978<br />
-1 h -1<br />
Thuidium kanedae 1.4 mg g<br />
max, epiphyte, Japan Hosokawa et al. 1964<br />
-1 h -1<br />
Leucobryum neilgherrense 1.4 mg g<br />
max, epiphyte, Japan Hosokawa et al. 1964<br />
-1 h -1<br />
Hylocomium splendens 1.39 mg g<br />
max, epiphyte, Japan Hosokawa et al. 1964<br />
-1 h -1 Dicranum elongatum 1.3 mg g<br />
max, mature veg, Fairbanks, Alaska; moist? Skré & Oechel 1981<br />
-1 dm h -1 Macromitrium gymnostomum 1.3 mg g<br />
max, Alaska Arctic tundra Oechel & Sveinbjörnsson 1978<br />
-1 h -1<br />
Sphagnum nemoreum 1.2 mg g<br />
max, epiphyte, Japan Hosokawa et al. 1964<br />
-1 dm h -1<br />
Ulota crispula 1.2 mg g<br />
lake, New York, USA<br />
Titus et al. 1983<br />
-1 h -1<br />
Pleurozium schreberi 1.20 mg g<br />
max, epiphyte, Japan Hosokawa et al. 1964<br />
-1 h -1 1.1 mg g<br />
max, mature veg, Fairbanks, Alaska; moist? Skré & Oechel 1981<br />
-1 h -1<br />
Hylocomium splendens 1.08 mg g<br />
max, south Finland Kallio & Kärenlampi 1975<br />
-1 h -1 Dicranum bonjeanii 1.0 mg g<br />
max, mature veg, Fairbanks, Alaska; moist? Skré & Oechel 1981<br />
-1 dm h -1 subsp angustum<br />
max, Alaska Arctic tundra Oechel & Sveinbjörnsson 1978<br />
Neckera konoi 1.0 mg g -1 h -1<br />
Calliergon austrostramineum 1.0 mg g<br />
max, epiphyte, Japan Hosokawa et al. 1964<br />
-1 h -1<br />
Sphagnum rubellum 0.9 mg g<br />
max, Antarctica Rastorfer 1972<br />
-1 dm h -1 Anomodon giraldii 0.9 mg g<br />
max, moorland Grace 1970<br />
-1 h -1<br />
Macrosporiella scabriseta 0.9 mg g<br />
max, epiphyte, Japan Hosokawa et al. 1964<br />
-1 h -1<br />
Boulaya mittenii 0.9 mg g<br />
max, epiphyte, Japan Hosokawa et al. 1964<br />
-1 h -1<br />
Pohlia nutans 0.9 mg g<br />
max, epiphyte, Japan Hosokawa et al. 1964<br />
-1 h -1<br />
Dicranum elongatum 0.9 mg g<br />
max, Antarctica Rastorfer 1972<br />
-1 h -1<br />
Sanionia uncinata 0.9 mg g<br />
max, subarctic Finland Kallio & Kärenlampi 1975<br />
-1 h -1<br />
0.9 mg g<br />
max, Antarctica Rastorfer 1972<br />
-1 h -1<br />
Neckera pennata 0.8 mg g<br />
max, subarctic Finland Kallio & Kärenlampi 1975<br />
-1 dm h -1 Racomitrium lanuginosum 0.8 mg g<br />
May, Adirondack Mt. Forest on tree Tobiessen et al. 1977<br />
-1 h -1<br />
Polytrichum strictum 0.7 mg g<br />
max, Antarctica Kallio & Kärenlampi 1975<br />
-1 h -1<br />
Racomitrium lanuginosum 0.6 mg g<br />
max, Antarctica Rastorfer 1972<br />
-1 dm h -1<br />
Thuidium cymbifolium 0.6 mg g<br />
Fennoscandia tundra<br />
Kallio & Heinonen 1975<br />
-1 h -1<br />
Hylocomium var. brevirostre 0.6 mg g<br />
max, epiphyte, Japan Hosokawa et al. 1964<br />
-1 h -1<br />
max, epiphyte, Japan Hosokawa et al. 1964<br />
cavifolium<br />
Homaliodendron 0.6 mg g -1 h -1<br />
max, epiphyte, Japan Hosokawa et al. 1964<br />
flabellatum<br />
Sphagnum subsecundum 0.57 mg g -1 h -1 Pleurozium schreberi 0.46 mg g<br />
max, mature veg, Fairbanks, Alaska; moist? Skré & Oechel 1981<br />
-1 h -1 Sphagnum nemoreum 0.25 mg g<br />
max, mature veg, Fairbanks, Alaska; moist? Skré & Oechel 1981<br />
-1 h -1 Mnium cuspidatum 0.16 mg g<br />
max, mature veg, Fairbanks, Alaska; moist? Skré & Oechel 1981<br />
-1 dm h -1 Anomodon rugelii<br />
0.00 mg g<br />
July, Adirondack Mt. Forest on tree Tobiessen et al. 1977<br />
-1 dm h -1<br />
July, Adirondack Mt. Forest on tree Tobiessen et al. 1977<br />
Neckera pennata<br />
Ulota crispa<br />
no PS<br />
no PS<br />
July, Adirondack Mt. Forest on tree<br />
July, Adirondack Mt. Forest on tree<br />
Tobiessen et al. 1977<br />
Tobiessen et al. 1977<br />
Calliergon sarmentosum 6 mg g -1 dm d -1 max, Antarctica lake bottoms Priddle 1980a<br />
& Drepanocladus spp.<br />
Calliergon giganteum 48.8 mg g -1 dm d -1<br />
293.0 mg g<br />
0.03% CO2, Arctic mineral sedge marsh D’Yachenko 1976<br />
-1 dm d -1<br />
Lophozia quinquedentata 25.4 mg g<br />
1% CO2, Arctic mineral sedge marsh D’Yachenko 1976<br />
-1 dm d -1 155.2 mg g<br />
0.03% CO2, Arctic mineral sedge marsh D’Yachenko 1976<br />
-1 dm d -1<br />
Polytrichum juniperinum 14.5 mg g<br />
1% CO2, Arctic mineral sedge marsh D’Yachenko 1976<br />
-1 dm d -1<br />
87.2 mg g<br />
dry, 0.03% CO2, Arct mineral sedge marsh D’Yachenko 1976<br />
-1 dm d -1 Sphagnum squarrosum 13.0 mg g<br />
dry, 1% CO2, Arctic mineral sedge marsh D’Yachenko 1976<br />
-1 dm d -1 77.8 mg g<br />
0.03% CO2, Arctic mineral sedge marsh D’Yachenko 1976<br />
-1 dm d -1<br />
Dicranum fuscescens 7 mg g<br />
1% CO2, Arctic mineral sedge marsh D’Yachenko 1976<br />
-1 dm d -1 max, subarctic Hicklenton & Oechel 1977
<strong>12</strong> Chapter <strong>12</strong>: Productivity<br />
Table 5. Productivity rates for bryophytes on an area basis. Values refer to CO 2 incorporated.<br />
Species Productivity Value Conditions/Location Reference<br />
Sphagnum spp. 14 µM m -2 s -1 max, summer Williams & Flanagan 1998<br />
Sphagnum spp. 6 µM m -2 s -1 max, autumn Williams & Flanagan 1998<br />
Sphagnum spp. 5 µM m -2 s -1 max, spring Williams & Flanagan 1998<br />
Pleurozium schreberi 1.9 µM m -2 s -1 Canadian boreal forest Whitehead & Gower 2001<br />
Ceratodon purpureus 4 µM m -2 s -1 max, Langhovde, East Antarctica, 9-17 Jan Ino 1990<br />
& Bryum pseudotriquetrum<br />
Hypnum cupressiforme 0.045 g m -2 s -1 Southern Finland, 5°C Kallio & Kärenlampi 1975<br />
Pleurozium schreberi 0.045 g m -2 s -1 Southern Finland, 15°C (optimum) Kallio & Kärenlampi 1975<br />
Hydrogonium consanguinium 0.88 g m -2 d -1 July, India Munshi 1974<br />
Hydrogonium consanguinium 1.05 g m -2 d -1 August, India Munshi 1974<br />
Hydrogonium consanguinium 1.05 g m -2 d -1 September, India Munshi 1974<br />
Physcomitrium spp. 0.17 g m -2 d -1 December Munshi 1974<br />
Physcomitrium spp. 0.08 g m -2 d -1 January Munshi 1974<br />
Physcomitrium spp. 0.07 g m -2 d -1 February Munshi 1974<br />
Hydrogonium consanguinium 31.53 g m -2 mo -1 August, India Munshi 1974<br />
Hydrogonium consanguinium 26.60 g m -2 mo -1 July, India Munshi 1974<br />
Hydrogonium consanguinium 14.80 g m -2 mo -1 September, India Munshi 1974<br />
Physcomitrium spp. 5.13 g m -2 mo -1 December Munshi 1974<br />
Physcomitrium spp. 2.44 g m -2 mo -1 January Munshi 1974<br />
Physcomitrium spp. 2.10 g m -2 mo -1 February Munshi 1974<br />
bryophyte cover 754 g m -2 yr -1 Marion Island (45º54'S) drainage line Russell 1985<br />
Hypnum cupressiforme 188 g m -2 yr -1 Austria Zechmeister 1998<br />
Pleurozium schreberi 161 g m -2 yr -1 Austria Zechmeister 1998<br />
Abietinella abietina 144 g m -2 yr -1 Austria Zechmeister 1998<br />
Hylocomium splendens <strong>12</strong>9.8 g m -2 yr -1 Tamm 1953<br />
Hylocomium splendens <strong>12</strong>7 g m -2 yr -1 Austria Zechmeister 1998<br />
Sphagnum papillosum 101.0 g m -2 yr -1 moor Newbould 1960<br />
Hydrogonium consanguinium<br />
72.93 g m -2 yr -1 net production, India Munshi 1974<br />
Calliergon sarmentosum 40 g m -2 yr -1 max, Antarctica lake bottoms Priddle 1980a<br />
& Drepanocladus (sensu lato) spp.<br />
Sanionia uncinata 30 g m -2 yr -1 max, High Arctic, Svalbard (79°N) Uchida et al. 2002<br />
bryophyte cover 21 g m -2 yr -1 Marion Island (45º54'S) fellfield Russell 1985<br />
bryophyte cover <strong>12</strong>.8 g m -2 yr -1 max, East Ongul Island, Antarctica Ino 1983<br />
Physcomitrium spp. 11.30 g m -2 yr -1 Annual net production Munshi 1974<br />
Polytrichum strictum 2-5 mm yr -1 Antarctic Longton 1974?<br />
Polytrichum strictum 15-55 mm yr -1 Pinawa, Manitoba Longton 1979?
Table 6. Mean maximum values for photosynthesis (CO 2<br />
uptake) and biomass (DM) increase at natural CO2 levels,<br />
saturating light intensity, optimal temperature, and adequate water<br />
availability. From Larcher (1983).<br />
Plant group CO2 uptake<br />
mg dm -2 h -1 mg gDM -1 h -1<br />
Land Plants<br />
Phanerogams<br />
Herbaceous plants<br />
C4 plants 30-80 (108) 60-140<br />
C3 plants<br />
Crop plants 20-45 (60) 30-60<br />
Plants of sunny habitats<br />
(heliophytes)<br />
20-40 (94) 30-60<br />
Shade plants (sciophytes) 4-20 10-30<br />
Plants of dry habitats<br />
(xerophytes)<br />
20-45 15-33<br />
Grain and fodder grasses 15-35 (40)<br />
Wild grasses and sedges<br />
CAM plants<br />
8-20 (25) 8-35<br />
In the light 3-20 0.3-2<br />
In the dark<br />
Woody plants<br />
Tropical and subtropical trees<br />
10-15 1-1.5<br />
Fruit trees 18-22 10-25<br />
Forest canopy trees <strong>12</strong>-24<br />
Understory trees<br />
Broad-leaved evergreens of the<br />
5-10<br />
subtropics and warm-temperate regions<br />
Sun leaves 10-18<br />
Shade leaves<br />
Seasonally deciduous trees<br />
3-6<br />
Sun leaves 15-25 (35)<br />
Shade leaves<br />
Conifers<br />
5-10<br />
Winter-deciduous 10-40<br />
Evergreen 5-18 4-18<br />
Mangrove trees 6-<strong>12</strong> (20)<br />
Sclerophylls of periodically<br />
dry regions<br />
5-15 3-10<br />
Bamboos 5-10<br />
Palms 6-10 (<strong>12</strong>)<br />
Desert shrubs (4) 6-20 (30) (2) 5-15 (35)<br />
Dwarf shrubs of heath and tundra<br />
Winter- deciduous 10-25 15-30<br />
Evergreen<br />
Cryptogams<br />
5-10(15) 2-10<br />
Ferns 3-5<br />
Mosses up to 3 0.6-3.5<br />
Lichens<br />
Aquatic Plants<br />
0.5-2 (6) 0.3-2.5 (4)<br />
Swamp plants, emersed hydrophytes 20-40 (50)<br />
Submersed cormophytes 2-6 5-25<br />
Seaweeds 3-10 1-20 (30)<br />
Planktonic algae 2-3<br />
Latitude differences<br />
It is difficult to determine if responses of populations<br />
in different parts of the world are the result of genetic<br />
differences or differences in acclimation history<br />
(Sveinbjörnsson & Oechel 1983). Polytrichum commune<br />
from five diverse regions from Alaska (71°N) to Florida<br />
(29°N) were grown under common garden conditions in<br />
constant temperature conditions of 5 and 20°C. In this<br />
common set of conditions, plants from lower latitudes had<br />
higher photosynthetic rates except for the temperate St.<br />
Chapter <strong>12</strong>: Productivity 13<br />
Hilaire population. There was a sevenfold difference<br />
between the extreme values. Populations from the lower<br />
latitudes had more maximum photosynthetic response to<br />
the two temperatures than did populations from higher<br />
latitudes. On the other hand, bryophytes from higher<br />
latitudes had higher energy contents than those from lower<br />
latitudes (Russell 1990; Figure 17).<br />
Figure 17. Comparison of mean energy content of<br />
bryophytes related to latitude in several tundra sites in Devon<br />
Island and Point Barrow, Alaska; Hardangervidda, Denmark; Mt.<br />
Washington, New Hampshire; and Marion Island and South<br />
Georgia, Antarctica. Reprinted from Russell (1990).<br />
Antarctic<br />
Temperatures in the Antarctic have rather large daily<br />
fluctuations during the growing season. Therefore, it is not<br />
surprising to find that bryophytes growing there show little<br />
response to changes in temperature and little acclimation to<br />
any temperature (Davey & Rothery 1996). Nevertheless,<br />
the species exhibit summer maxima; no seasonal variation<br />
existed for optimum temperature of gross or net<br />
photosynthesis.<br />
Frigid Antarctic<br />
The frigid Antarctic, with mean air temperatures<br />
generally below 0ºC and very dry air, is entirely vegetated<br />
by cryptogams: Cyanobacteria, algae, lichens, and mosses.<br />
The most conspicuous vegetation is small turf and cushionforming<br />
mosses including Bryum and Grimmia species<br />
(Longton 1979). Standing biomass is similar to the annual<br />
production of the tundra, reaching 1000 g m -2 , but more<br />
typically 5-200 g m -2 (Longton 1974, Kappen 1985).<br />
Annual production seems to be less than 5 g m -2 yr -1<br />
(Longton 1974, Ino 1983).<br />
The cold Antarctic, with summer mean air<br />
temperatures of 0-2ºC, has a production of 200-900 g m -2 in<br />
the larger moss turfs and carpets (Longton 1970, Davis<br />
1981), comparable to temperate grassland (Longton 1992)!<br />
In this area, the biomass is more commonly 300-1000 g m -2<br />
for green shoots, and reaches 20,000 - 30,000 g m -2 for<br />
total biomass, including older brown parts (Longton 1992).<br />
It is interesting that the production here is generally higher<br />
than in the Arctic tundra (Longton 1988, Russell 1990),<br />
exceeding 1000 g m -2 yr -1 (Russell 1990), perhaps due to<br />
greater precipitation and enhanced soil N and P from the<br />
marine environment (Longton 1992).<br />
Arctic<br />
Even in the cold Arctic, water is a major controlling<br />
factor in photosynthesis. Sanionia uncinata has high<br />
photosynthetic activity only when water content is high<br />
during or following rainfall (Uchida et al. 2002).<br />
Temperature has little effect on net photosynthetic rates in<br />
this species, being constant in the range of 7-23°C.
14 Chapter <strong>12</strong>: Productivity<br />
Wetlands<br />
In the Arctic wetlands, mosses account for 91% of the<br />
above ground biomass (Oechel & Sveinbjörnsson 1978).<br />
Grasses and sedges usually arise from a bed of mosses,<br />
including the turf-forming Meesia and Cinclidium and<br />
carpet-forming Calliergon and Drepanocladus species<br />
(Longton 1992). The annual production of 100-300 g m -2<br />
can be 20-45% bryophyte (Longton 1992) and the biomass<br />
is up to 150 g m -2 (Oechel & Sveinbjörnsson 1978).<br />
Tundra<br />
In the tundra, mosses exhibit about 10% of the<br />
productivity of higher plants, despite occupying 50% of the<br />
above ground biomass. Whereas Polytrichum strictum can<br />
have an annual production of 450-500 g m -2 in the cool<br />
Antarctic grassland, it reaches only 100-150 g m -2 in the<br />
Arctic spruce woodland (Longton 1979). However, in<br />
some areas, the production reaches 50-90% of higher plant<br />
production and values up to 1000 g dry wt m -2 yr -1 can be<br />
measured (Clarke et al. 1971, Kallio & Kärenlampi 1975,<br />
Oechel & Sveinbjörnsson 1978, Russell 1990). More<br />
typical values are 1-50 g dry wt m -2 yr -1 . Ratios of biomass<br />
to production can be exceedingly high, up to 70:1,<br />
illustrating the slow growth and the extreme longevity of<br />
the plants (Longton 1992). In heath communities in the<br />
tundra of northern Sweden, biomass reaches 156 g m -2<br />
(Jonasson 1982). However, in below ground biomass, the<br />
phanerogams far exceed the bryophytes, with underground<br />
parts contributing more than 50% of the total production of<br />
all plants (Longton 1984).<br />
Coxson and Mackey (1990) found that the subalpine<br />
Pohlia wahlenbergii (Figure 1) exhibited strong diel<br />
periodicity in midsummer conditions, declining from 8 mg<br />
CO2 g -1 hr -1 to ~5 mg CO2 g -1 hr -1 .<br />
Boreal forest<br />
In the boreal forest, the dominant mosses are feather<br />
mosses, especially Hylocomium splendens and Pleurozium<br />
schreberi (Figure 18; Longton 1992). Biomass can reach<br />
170-290 g m -2 under spruce in Alaska, but only 4-6 g m -2<br />
under Betula and Populus species. Likewise, production<br />
was hardly measurable in the Betula and Populus forests,<br />
but reached 70-150 g m -2 under spruce, often exceeding the<br />
productivity of the spruce itself (Longton 1992)! Similar<br />
rates to those under spruce are found for feather mosses in<br />
other coniferous forests (Tamm 1953, Weetman 1968,<br />
Pakarinen 1978). Pleurozium schreberi in black spruce<br />
forests in New Brunswick, Canada, had an annual<br />
productivity of 44-66 g m -2 (Timmer 1970). Tamm (1953)<br />
reported 45-60 g m -2 for Hylocomium splendens in a<br />
Swedish spruce forest and Damman reported 50 g m -2 for it<br />
in Newfoundland black spruce forests. Van Cleve and<br />
coworkers (1983), for black spruce forests near Fairbanks,<br />
Alaska, reported an even higher value of 100 g m -2 .<br />
Figure 18. Pleurozium schreberi. Photo by Jan-Peter<br />
Frahm.<br />
In addition to feather mosses, Sphagnum is a<br />
prominent member of many boreal communities. In a<br />
black spruce forest, Swanson and Flanagan (2001) found<br />
that Sphagnum had higher maximum rates of gross<br />
photosynthesis than did the feather mosses and exhibited<br />
distinct seasonal changes in its photosynthetic capacity.<br />
Several species of Dicranum occur in boreal forests,<br />
and Kellomäki et al. (1978) found that they differ<br />
physiologically in their ability to tolerate desiccation and<br />
photosynthesize. Even within the same species, two<br />
varieties can differ substantially. For example, the<br />
photosynthetic rate of D. fuscescens var. congestum<br />
increases more rapidly at <strong>12</strong>.5ºC than at 17.5ºC with<br />
increasing light than does that of D. fuscescens var.<br />
flexicaule, in which the rates at the two temperatures are<br />
essentially identical. In D. fuscescens var. congestum, the<br />
rate at <strong>12</strong>.5ºC is nearly double that at 17.5ºC. However,<br />
water deficit has a strong effect on the photosynthetic rate.<br />
The best photosynthesis seems to occur in the morning<br />
when the plants are able to use morning dew.<br />
Temperate forest<br />
Ground cover of bryophytes in temperate forests varies<br />
widely. In oak forests in Hungary, production is only 4.3 g<br />
m -2 (Smith 1982). Oceanic European oak forests may<br />
reach 35.5 g m -2 (Pócs 1982). Forman (1969) reported a<br />
scant 2-3 g m -2 in deciduous forests in New Hampshire,<br />
USA, whereas Rieley and coworkers (1979) reported 1600<br />
- 2900 g m -2 in a Welsh Quercus petraea woods. In these<br />
oakwoods, the production was 170-210 g m -2 for the<br />
mosses, whereas the herbs had a production of only <strong>12</strong>0 g<br />
m -2 . Many of the oakwoods in England are on rocky<br />
hillsides where litter accumulation is small, whereas many<br />
North American temperate forests bury the mosses in litter<br />
just as the fall growth season for mosses begins (Pitkin<br />
1975). However, Rieley and coworkers (1979) offer<br />
another explanation. Sheep eat the grasses selectively and<br />
leave the mosses behind. On tree trunks and logs, above<br />
the litter, temperate forest bryophytes can be significant.<br />
In the temperate rainforest of Washington, USA,<br />
biomass can be as great as 800 g m -2 of tree surface,<br />
translating to 500 g m -2 of forest floor. In the Douglas fir<br />
forests of Oregon, USA, bryophyte biomass can be as high<br />
as 8.9 kg on a single 65 m tall tree (Pike et al. 1972). On<br />
Mt. Baker in Washington, bryophyte biomass averages ca<br />
180 g m -2 (Edwards et al. 1960). However, in pine forests
in France, the moss Pseudoscleropodium purum (Figure<br />
19) has a relatively low annual production of only 39 g m -2<br />
(Kilbertus 1968).<br />
Figure 19. Pseudoscleropodium purum. Photo by Michael<br />
Lüth.<br />
Epiphytes<br />
Neckera pennata (Figure 20) demonstrates that colony<br />
growth in area is proportional to colony size, thus<br />
exhibiting exponential growth (Wiklund & Rydin 2004).<br />
Precipitation was an important parameter in determining<br />
colony growth. Presence of other species reduced growth.<br />
Wicklund and Rydin estimated that the colony needs to<br />
attain a size of <strong>12</strong>-79 cm 2 before reproducing sexually,<br />
taking 19-29 years to attain that size.<br />
Figure 20. Neckera pennata, an epiphytic moss. Photo by<br />
Michael Lüth.<br />
Peatlands<br />
Moore (1989) found a slight tendency for production<br />
of Sphagnum to decrease as temperatures decrease<br />
northward. Wider differences, however, occur within a<br />
single peatland. Hummocks can have annual production of<br />
100-150 g m -2 , lawns 500 g m -2 , and pools 600-800 g m -2<br />
(Clymo 1970, Clymo & Hayward 1982), suggesting that<br />
water availability is the limiting factor for production. Vitt<br />
(1990) reported that production varies from 70 to 400 g m -2<br />
per year, with fen mosses at the lower half of the range.<br />
The highest productivity measured in peatlands seems to be<br />
that of Sphagnum (868 g m -2 yr -1 ) in a recently burned<br />
Eriophorum community in Great Britain (Heal et al. 1975).<br />
Grigal (1985) found a productivity of 320-380 g m -2 yr -1 in<br />
a forested Minnesota bog and Elling & Knighton (1984)<br />
Chapter <strong>12</strong>: Productivity 15<br />
found slightly higher results (390 g m -2 yr -1 ) in an open<br />
Minnesota bog. These figures of production compare with<br />
a standing crop of 500 g m -2 in west Norway (Laennergren<br />
& Oevstedal 1983). Somewhat lower values have been<br />
reported for Moor House, England, Sphagnum, where the<br />
productivity was 213 g m -2 yr -1 (Forrest & Smith 1975).<br />
Surprisingly, rich fen production is lower. Vitt (1990)<br />
found that in Alberta, Canada, at higher elevations it was<br />
47-93 g m -2 yr -1 , whereas in the lower boreal sites it was<br />
<strong>12</strong>5-131 g m -2 yr -1 . Vitt attributes the lack of increased<br />
productivity in rich fens to the similarity of N and P<br />
concentrations in the poor, rich, and extreme-rich fens.<br />
Nevertheless, in poor fens, Bartsch and Moore (1985)<br />
found that productivity of Sphagnum in Quebec was only<br />
58-73 g m -2 yr -1 in hummocks and 9-19 g m -2 yr -1 in lawns.<br />
It is somewhat puzzling that bog hummocks have less<br />
production than carpets, but that poor fen hummocks have<br />
double the production of lawns (Vitt 1990).<br />
In peatlands, bryophytes are major contributors to the<br />
primary productivity. At a peatland in West Virginia,<br />
bryophytes covered 68% of the ground and contributed<br />
43% of the aboveground net primary productivity, with 20,<br />
10, and 27% contributed by herbaceous species, trailing<br />
shrubs, and upright shrubs, respectively (Wieder et al.<br />
1989). <strong>Bryophyte</strong>s covered 68% of the ground.<br />
Precipitation plays a major role in the productivity. Moore<br />
(1989) found that growth at the lawn sites was higher than<br />
that of hummocks in an average rainfall year, but in a dry<br />
year, growth in two of the three lawn sites was less than<br />
that in the hummocks.<br />
Species can differ widely in their photosynthetic<br />
activity. Dry matter accumulated 141-206 g m –2 in<br />
Sphagnum tenellum, 32-190 g m -2 in S. papillosum, and<br />
187-219 g m -2 in S. nemoreum (=S. capillifolium) at the<br />
Takadayachi Moor in Hakkoda Mountains, Japan<br />
(Fukushima et al. 1995).<br />
Temperature influences the light compensation point<br />
of peatland mosses in Alaska (Harley et al. ). The light<br />
compensation point increased from 37 µM m -2 s -1 at 10°C<br />
to <strong>12</strong>7 µM m -2 s -1 at 20°C, despite little increase in the<br />
maximum CO2 uptake rate. Laboratory experiments<br />
indicated that responses could be quite different from that<br />
in the field, with considerably lower light compensation<br />
points and higher light saturation rates of assimilation.<br />
Peatlands can serve as important carbon sinks. In<br />
restored peatlands, Waddington and Warner (2000) found<br />
that the peatlands resulted in considerable decrease in the<br />
atmospheric CO2 (~70% decrease due to gross productivity,<br />
30% to decreased respiration). Unfortunately, restoration<br />
did not restore the peatlands to a net carbon sink, but it<br />
greatly improved the sequestration of carbon.<br />
Desert<br />
In the Chihuahuan, Sonoran, and Mohave Deserts in<br />
North America, the highest biomass of mosses (2.24 g m -2 )<br />
occurred on the north slope of the Mojave (Nash et al.<br />
1977).<br />
In a sandy semidesert, Juhász et al. (2002) found that<br />
Syntrichia ruralis exhibited their highest daily carbon<br />
fixation rates in December and January, whereas in the<br />
summer it went dormant. A net carbon gain did not occur<br />
until October. This species is able to maintain its<br />
physiological integrity and net photosynthetic gain by
16 Chapter <strong>12</strong>: Productivity<br />
changing the surface reflectance and exhibiting thermal<br />
dissipation of excess light energy (Hamerlynck et al. 2000).<br />
Grimmia laevigata from the inland chaparral of<br />
California, USA, is unable to survive in the most xeric sites<br />
because it is unable to maintain a positive carbon balance<br />
during repeated wet-dry cycles (Alpert & Oechel 1985).<br />
Savannah<br />
In such dry habitats as the savannah, the life cycle can<br />
be shortened to accommodate the lack of water. Mosses<br />
such as Archidium ohioense, Bryum coronatum, Fissidens<br />
minutifolius, and Trachycarpidium tisserantii develop<br />
protonemata and gametophytes in March – April; by<br />
September and October the spores are being dispersed<br />
(Makinde & Odu 1994). All of these events occur within<br />
the rainy season, permitting maximum photosynthesis.<br />
Temperate Rainforest<br />
Although the rainforest has its season of daily rain, it<br />
also has periods of continued dryness. Under these<br />
circumstances, respiration may exceed photosynthesis,<br />
causing negative photosynthetic gain (DeLucia et al. 2003).<br />
Forest floor bryophytes in a New Zealand rainforest have<br />
an annual net carbon uptake of 103 g m -2 , compared to<br />
annual carbon efflux from the forest floor (bryophyte + soil<br />
respiration) of -1010 g m -2 . <strong>Bryophyte</strong>s were unable to<br />
recover more than 10% of carbon lost from the forest floor.<br />
Tropical rainforest<br />
The biomass of bryophytes in the tropics rises sharply<br />
with elevation. Frahm (1990a) found standing biomass of<br />
bryophytes to be less than 10-<strong>12</strong> g m -2 of tree trunk at low<br />
elevations (up to 1000 m), up to 140 g m -2 in Peru, and 400<br />
- 800 g m -2 in Borneo. Exceptionally high biomass of<br />
bryophytes, up to 1030 g m -2 , can occur in high altitude<br />
epiphytes in Tanzania (Pócs 1982). The astonishingly high<br />
figure of 1400 g m -2 productivity occurs among the<br />
epiphytic bryophytes of a Tanzanian cloud forest (Pócs<br />
1980).<br />
High temperatures and low light place severe<br />
limitations on tropical net productivity (Frahm 1990b).<br />
Temperatures above 25°C drastically decrease the net<br />
assimilation. Coupled with the lowlight, temperature<br />
causes productivity of bryophytes in tropical lowlands to be<br />
the lowest of any tropical altitude, with high rates of<br />
respiration often resulting in no net carbon gain.<br />
Aquatic<br />
Rivers and Streams<br />
Naiman (1983) considered mosses in 4th order or<br />
higher streams to be the most productive autotrophic<br />
members of the stream community in boreal forest<br />
watersheds, producing 3.9 x 10 10 g yr -1 . This compares to<br />
periphyton productivity of only 2.1 x 10 10 g yr -1 in the same<br />
watersheds. These higher order streams occupy 76.8% of<br />
the lotic surface area and are responsible for 86.3% of the<br />
gross productivity, demonstrating the importance of<br />
bryophytes in the stream ecosystem.<br />
But stream habitats can be rather unfavorable,<br />
especially for mosses. In one study in Oregon, Fontinalis<br />
only had positive photosynthesis in the winter (Naiman &<br />
Sedell 1980). It was negative the rest of the year.<br />
Despite their slow growth and low nutrient<br />
requirements, higher nutrients can favor enhanced growth<br />
in some bryophyte taxa. In Alaskan streams,<br />
Hygrohypnum alpestre and H. ochraceum increased in<br />
cover following phosphorus enrichment, whereas<br />
Schistidium agassizii showed little response (Arscott et al.<br />
2000). Although the Hygrohypnum species were intolerant<br />
of desiccation, they were more tolerant of high<br />
temperatures than S. agassizii, having the higher<br />
productivity (1676-6342 µg O2 g -1 dry mass h -1 ) compared<br />
to that of S. agassizii (428-1163 µg O2 g -1 dry mass h -1 ).<br />
Lakes and Ponds<br />
<strong>Bryophyte</strong>s in lakes enjoy the presence of constant<br />
water, permitting photosynthesis at any time other factors<br />
are favorable. Instead of being at the mercy of water<br />
availability like most bryophytes, these bryophytes face the<br />
limits of low light intensity, rapidly attenuated red light,<br />
and poorly dissolved CO2. In most lakes, temperature is<br />
not a problem, with bottom temperatures of deep lakes<br />
generally not going below 4ºC, and summer temperatures<br />
often not exceeding 10ºC. In more shallow lakes and<br />
ponds, summer temperatures may become a problem if they<br />
reach 20ºC and sustain that temperature for extended<br />
periods. Under those conditions, hydrated bryophytes not<br />
only lose more energy to respiration than they gain by<br />
photosynthesis, but they must compete with aquatic<br />
tracheophytes and algae that benefit from the higher<br />
temperatures. Sediment CO2 can often contribute to the<br />
productivity of bottom-dwelling bryophytes in lake<br />
systems.<br />
The floating liverwort Riccia fluitans (Figure 21)<br />
increased its relative growth rate from 0.011 d -1 at low light<br />
and CO2 to 0.138 d -1 at high light and CO2 (Andersen &<br />
Pedersen 2002). There was strong acclimation to light and<br />
CO2 conditions. Nevertheless, high light intensities<br />
resulted in decreased maximum net photosynthesis while<br />
increasing CO2 continued to increase the maximum net<br />
photosynthesis. The CO2 compensation point for<br />
photosynthesis was strongly depressed by high light and<br />
low CO2 and increased in low light and high CO2. High<br />
levels of CO2 within the floating mat permits<br />
photosynthesis at greater depths where the light intensity<br />
attenuates.<br />
Wagner et al. (2000) found that in Waldo Lake,<br />
Oregon, liverworts, comprising 98% of the bryophyte<br />
biomass, exhibited growth similar to that of upland plants<br />
(1.5-3 cm annually).<br />
Figure 21. Riccia fluitans, a floating thallose liverwort.<br />
Photo by Michael Lüth.
Summary<br />
Productivity can be considered in many ways,<br />
including ability to invade, linear growth, biomass increase,<br />
CO2 uptake, O2 production, C 14 incorporation, chlorophyll<br />
concentration, and surface expansion. Biomass gain may<br />
often be uncoupled from linear growth, with the former<br />
typically occurring first.<br />
Likewise, annual growth of the plant can be measured<br />
in many different ways, including length of branch<br />
internodes; distance between splash cups on a stem; height<br />
above a cranked wire, tag, nylon net, plastic bubbles, or<br />
dye, growth out of a nylon bag; photographic record of<br />
expansion on a grid. Pleurocarpous mosses typically<br />
exhibit exponential growth, whereas unbranched<br />
acrocarpous mosses have linear growth, thus requiring<br />
different measures of growth.<br />
Etiolation (excessive elongation and loss of<br />
chlorophyll due to insufficient light) may occur in low-light<br />
environments, giving a false measurement of length as an<br />
indication of productivity.<br />
Productivity is generally highest when there is a good<br />
supply of water and ceases when the bryophyte is<br />
desiccated, causing seasonal differences. Once the<br />
moisture requirement is met, temperature and light are<br />
important in determining maximum productivity, with most<br />
bryophytes diminishing in productivity above 20-25ºC and<br />
dying at prolonged exposure above 30ºC if hydrated. The<br />
lower limit varies geographically and with species, with<br />
some species having their compensation point as low as -<br />
10ºC. In water, bryophytes are limited by low light and<br />
low concentrations of CO2, but those on the bottom can<br />
take advantage of CO2 from the sediments.<br />
Belowground productivity may be extensive in some<br />
bryophytes, such as those in the Polytrichaceae. Capsules,<br />
and even spores, can contribute to overall productivity, but<br />
at the same time, they typically reduce productivity of the<br />
leafy gametophyte.<br />
Life span may be months to centuries, but unlike<br />
tracheophytes, generally only the upper portion of the stem<br />
supports active productivity. Mortality of the whole stem<br />
can be high, reaching 32% in Antarctic young populations<br />
of Polytrichum strictum. On the other hand, longevity may<br />
reach 17 years in the Arctic, compensating for the slow<br />
growth, and apparently is even higher in some cold lakes.<br />
The Leaf Area Index (LAI) indicates that bryophytes<br />
are well adapted to take advantage of the many angles of<br />
the sun, reaching such levels as 44 and <strong>12</strong>9 for sun-adapted<br />
species, whereas a value of 1 indicates full usage; anything<br />
higher than 1 permits maximum usage at more angles of<br />
the sun. Mosses in the boreal biome have an LAI of about<br />
20. Light use efficiency can be very high, but productivity<br />
still remains low, perhaps due to CO2 limitation. Mosses<br />
have a maximum CO2 uptake of about 3 mg dm -2 hr -1 ,<br />
whereas C3 tracheophytes reach 45 and C4 plants reach 80.<br />
Some bryophytes, especially Cryptothallus mirabilis,<br />
rely on fungal partners for their carbon input. Other<br />
thallose liverworts can lose energy to fungi.<br />
The highest productivity, when it occurs, seems to be<br />
from bryophytes in the driest habitats. On the other hand,<br />
yearly productivity seems to be highest in Sphagnum,<br />
reaching <strong>12</strong> tons per hectare.<br />
Chapter <strong>12</strong>: Productivity 17<br />
Striking differences occur among latitudes and<br />
habitats. For example, Antarctic bryophytes have drastic<br />
daily temperature fluctuations and show little response<br />
temperature differences. Cool tundra populations of<br />
Polytrichum strictum may have only 1/4 – 1/3 the<br />
production they exhibit in the cool Antarctic grassland.<br />
The ultimate limit to productivity, hence to distribution, is<br />
achieving a positive carbon balance. Heat causes<br />
respiratory loss and frequent wet-dry cycles require<br />
excessive repair, both reducing the net carbon gain in some<br />
habitats to 0 and ultimate death.<br />
Acknowledgments<br />
Klaus Weddeling, Brian O'Shea, and Marshall Crosby<br />
helped me find the new name for Hylocomium parietale. It<br />
appears to have been H. parietinum, now Pleurozium<br />
schreberi. Several bryonetters helped me locate the current<br />
name of Homaliodendron scalpellifolium, which is now H.<br />
flabellatum.<br />
Literature Cited<br />
Al-Mufti, M. M., Sydes, C. L., Furness, S. B., Grime, J. P., and<br />
Band, S. R. 1977. A quantitative analysis of shoot<br />
phenology and dominance in herbaceous vegetation. J. Ecol.<br />
65: 759-92.<br />
Allen, E. D. and Spence, D. H. N. 1981. The differential ability<br />
of aquatic plants to utilize the inorganic C supply in<br />
freshwater. New Phytol. 87: 269-283.<br />
Alpert, P. and Oechel, W. A. 1985. Carbon balance limits the<br />
microdistribution of Grimmia laevigata, a desiccationtolerant<br />
plant. <strong>Ecology</strong> 66: 660-669.<br />
Alpert, P. and Oechel, W. C. 1987. Comparative patterns of net<br />
photosynthesis in an assemblage of mosses with contrasting<br />
microdistributions. Amer. J. Bot. 74: 1787-1796.<br />
Andersen, T. and Pedersen, O. 2002. Interactions between light<br />
and CO2 enhance the growth of Riccia fluitans.<br />
Hydrobiologia 477: 163-170.<br />
Arscott, D. B., Bowden, W. B., and Finlay, J. C. 2000. Effects of<br />
desiccation and temperature/irradiance on the metabolism of<br />
2 Arctic stream bryophyte taxa. J. N. Amer. Benthol. Soc.<br />
19: 263-273.<br />
Asada, T., Warner, B. G., and Banner, A. 2003. Growth of<br />
mosses in relation to climate factors in a hypermaritime<br />
coastal peatland in British Columbia, Canada. Bryologist<br />
106: 516-527.<br />
Bakken, S. 1995. Effects of nitrogen supply and irradiance on<br />
growth and nitrogen status in the moss Dicranum majus from<br />
differently polluted areas. J. Bryol. 18: 707-721.<br />
Baló, K. 1967. Some photosynthesis-ecological characteristics of<br />
forest bryophytes. Symp. Biol. Hung. 35: <strong>12</strong>5-135.<br />
Bartsch, L. and Moore, T. E. 1985. A preliminary investigation<br />
of primary production and decomposition in four peatlands<br />
near Schefferville, Quebec. Can. J. Bot. 63: <strong>12</strong>41-<strong>12</strong>48.<br />
Bates, J. W. 1989. Growth of Leucobryum glaucum cushions in a<br />
Berkshire oakwood. J. Bryol. 15: 785-791.<br />
Bold, H. C. 1948. The occurrence of chlorophyll in the<br />
sporophyte of Ricciocarpus natans. Amer. J. Bot. 35: 440-<br />
443.<br />
Callaghan, T. V., Collins, N. J., and Callaghan, C. H. 1978.<br />
Photosynthesis, growth, and reproduction of Hylocomium<br />
splendens and Polytrichum commune in Swedish Lapland.<br />
Oikos 31: 73-88.
18 Chapter <strong>12</strong>: Productivity<br />
Clarke, G. C. S., Greene, S. W., and Greene, D. M. 1971.<br />
Productivity of bryophytes in polar regions. Ann. Bot. 35:<br />
99-108.<br />
Cleve, K. van, Dyrness, C. T., Viereck, L. A., Fox, J., Chapin, F.<br />
S. III, and Andoechel, W. 1983. Taiga ecosystems in<br />
interior Alaska. BioScience 33: 39-44.<br />
Clymo, R. S. 1970. The growth of Sphagnum: Methods of<br />
measurement. J. Ecol. 58: 13-49.<br />
Clymo, R. S. and Hayward, P. M. 1982. The ecology of<br />
Sphagnum. Chapt. 8. In: Smith, A. J. E. (ed.). <strong>Bryophyte</strong><br />
<strong>Ecology</strong>. Chapman & Hall, New York, pp. 229-289.<br />
Collins, N. J. 1976. Growth and population dynamics of the<br />
moss Polytrichum alpestre in the Maritime Antarctic. Oikos<br />
27: 389-401.<br />
Collins, N. J. and Oechel, W. C. 1974. The pattern of growth and<br />
translocation of photosynthate in a tundra moss, Polytrichum<br />
alpinum. Can. J. Bot. 52: 355-363.<br />
Coxson, D. S. and Mackey, R. L. 1990. Diel periodicity of<br />
photosynthetic response in the subalpine moss Pohlia<br />
wahlenbergii. Bryologist 93: 417-422.<br />
D'Yachenko, A. P. 1976. Photosynthesis of Arctic moss under<br />
natural conditions. Soviet J. Ecol. 1: 71-73.<br />
Davey, M. C. and Rothery, P. 1996. Seasonal variation in<br />
respiratory and photosynthetic parameters in three mosses<br />
from the maritime Antarctic. Ann. Bot. 78: 719-728.<br />
Davis, R. C. 1981. Structure and function of two Antarctic<br />
terrestrial moss communities. Ecol. Monogr. 51: <strong>12</strong>5-143.<br />
DeLucia, E. H., Turnbull, M. H., Walcroft, A. S., Griffin, K. L.,<br />
Tissue, D. T., Glenny, D., McSeveny, T. M., and Whitehead,<br />
D. 2003. The contribution of bryophytes to the carbon<br />
exchange for a temperate rainforest. Global Change Biol. 9:<br />
1158-1170.<br />
Edwards, R. Y, Soos, J., and Ritcey, R. W. 1960. Quantitative<br />
observations on epidendric lichens used as food by caribou.<br />
<strong>Ecology</strong> 41: 425-431.<br />
Elling, A. E. and Knighton, M. D. 1984. Sphagnum moss<br />
recovery after harvest in a Minnesota bog. J. Soil Water<br />
Cons. 39: 109-211.<br />
Forman, R. T. T. 1969. Comparison of coverage, biomass and<br />
energy as measures of standing crop of bryophytes on<br />
various ecosystems. Bull. Torrey Bot. Club 96: 582-591.<br />
Forrest, G. I. and Smith, R. A. H. 1975. The productivity of<br />
blanket bog types in the northern Pennines. J. Ecol. 63: 173-<br />
202.<br />
Frahm, J.-P. 1990a. <strong>Bryophyte</strong> phytomass in tropical<br />
ecosystems. International Symposium on <strong>Bryophyte</strong><br />
<strong>Ecology</strong>, Edinburgh, UK.<br />
Frahm, J.-P. 1990b. <strong>Bryophyte</strong> phytomass in tropical<br />
ecosystems. J. Linn. Soc. Bot. 104: 23-33.<br />
Frye, T. C. 1928. Observations on the age of a few bryophytes.<br />
Bryologist 31: 25-27.<br />
Fukushima, S., Kume, A., Ino, Y., and Mochida, Y. 1995.<br />
Growth and production of Sphagnum mosses from<br />
Takadayachi Moor in Hakkoda Mountains, northeast Japan.<br />
1. Dry matter production estimated from photosynthesis and<br />
respiration. Ecol. Rev. 23(2): 77-92.<br />
Furness, S. B. and Grime, J. P. 1982. Growth rate and<br />
temperature responses in bryophytes. I. An investigation of<br />
Brachythecium rutabulum. J. Ecol. 70: 513-523.<br />
Gaberscik, A. and Martincic, A. 1987. Seasonal dynamics of net<br />
photosynthesis and productivity of Sphagnum papillosum.<br />
Lindbergia 13: 105-110.<br />
Gerdol, R. 1996. The seasonal growth pattern of Sphagnum<br />
magellanicum Brid. in different microhabitats on a mire in<br />
the southern Alps (Italy). Oecol. Mont. 5(1): 13-20.<br />
Glime, J. M. 1980. Effects of temperature and flow on rhizoid<br />
production in Fontinalis. Bryologist 83: 477-485.<br />
Glime, J. M. 1982. Response of Fontinalis hypnoides to seasonal<br />
temperature variations. J. Hattori Bot. Lab. 53: 181-193.<br />
Glime, J. M. 1987a. Growth model for Fontinalis duriaei based<br />
on temperature and flow conditions. J. Hattori Bot. Lab. 62:<br />
101-109.<br />
Glime, J. M. 1987b. Phytogeographic implications of a<br />
Fontinalis (Bryopsida) growth model based on temperature<br />
and flow conditions for six species. Mem. N. Y. Bot. Gard.<br />
45: 154-170.<br />
Grace, J. 1970. The Growth-Physiology of Moorland Plants in<br />
Relation to their Aerial Environment. Ph. D. Thesis,<br />
University of Sheffield.<br />
Gremmen, N. J. M. Jebelius, S. W., and Smith, V. R. 1975.<br />
Preliminary study of different methods to assess the primary<br />
productivity of bryophytes on Marion Island. Report on 8th<br />
Biological Expedition to Marion Island, Sub-Antarctic.<br />
C.S.I.R., Pretoria.<br />
Grigal, D. F. 1985. Sphagnum production in forested bogs of<br />
northern Minnesota. Can. J. Bot. 63: <strong>12</strong>04-<strong>12</strong>07.<br />
Hagerup, O. 1935. Zur Periodizitat im Laubwechsel der Moose.<br />
Danske Vidensk. Selskab Biol. Medd. 11(9): 1-88.<br />
Hamerlynck, E., Tuba, Z., Csintalan, Z., Nagy, Z., Henebry, G.,<br />
and Goodin, D. 2000. Diurnal variation in photochemical<br />
dynamics and surface reflectance of the desiccation-tolerant<br />
moss, Tortula ruralis. Plant Ecol. 151: 55-63.<br />
Hawes, I., Andersen, D. T., and Pollard, W. H. 2002. Submerged<br />
aquatic bryophytes in Colour Lake, a naturally acidic polar<br />
lake with occasional year-round ice-cover. Arctic 55: 380-<br />
388.<br />
Heal, O. W., Jones, H. E., and Whittaker, J. B. 1975. Moor<br />
House, U. K. Ecol. Bull. (Stockholm) 20: 295-320.<br />
Hicklenton, P. R. and Oechel, W. C. 1976. Physiological aspects<br />
of the ecology of Dicranum fuscescens in the subarctic. I.<br />
Acclimation and acclimation potential of CO2 exchange in<br />
relation to habitat, light, and temperature. Can. J. Bot. 54:<br />
1104-1119.<br />
Hicklenton, P. R. and Oechel, W. C. 1977. The influence of light<br />
intensity and temperature on the field carbon dioxide<br />
exchange of Dicranum fuscescens in the subarctic. Arct.<br />
Alp. Res. 9: 407-419.<br />
Hosokawa, T., Odani, N., and Tagawa, H. 1964. Causality of the<br />
distribution of corticolous species in forests with special<br />
reference to the physio-ecological approach. Bryologist 67:<br />
396-411.<br />
Ino, Y. 1983. Estimation of primary production in moss<br />
community on East Ongul Island, Antarctica. Antarct. Rec.<br />
(Tokyo) 80: 30-38.<br />
Ino, Y. 1990. Field measurement of net photosynthesis of<br />
mosses at Langhovde, East Antarctica. Ecol. Res. 5(2): 195-<br />
205.<br />
Johansson, L.-G. and Linder, S. 1980. Photosynthesis of<br />
Sphagnum in different microhabitats on a subarctic mire. In:<br />
Sonnesson, M. (ed.). <strong>Ecology</strong> of a Subarctic Mire. Swedish<br />
Natural Science Research Council, Stockholm, pp. 181-190.<br />
Jonasson, S. 1982. Organic matter and phytomass on three north<br />
Swedish tundra sites and some connections with adjacent<br />
tundra areas. Holarct. Ecol. 5: 367-375.<br />
Jonsson, B. G. and Söderström, L. 1988. Growth and<br />
reproduction in the leafy hepatic Ptilidium pulcherrimum (G.<br />
Web.) Vainio during a 4-year period. J. Bryol. 15: 315-325.
Juhász, A., Balogh, J., Csintalan, Z., and Tuba, Z. 2002. Carbon<br />
sequestration of the poikilohydric moss carpet vegetation in<br />
semidesert sandy grassland ecosystem. Acta Biol. Szeged.<br />
46(3-4): 223-225.<br />
Kalapos, T. and Mázsa, K. 2001. Juniper shade enables<br />
terricolous lichens and mosses to maintain high<br />
photochemical efficiency in a semiarid temperate sand<br />
grassland. Photosynthetica (Prague) 39: 263-268.<br />
Kallio, P. and Heinonen, S. 1975. CO2 exchange and growth of<br />
Rhacomitrium lanuginosum and Dicranum elongatum. In:<br />
Wielgolaski, F. E. (ed.). Fennoscandian Tundra<br />
Ecosystems. Part 1. Plants and Microörganisms. Springer-<br />
Verlag, New York, Ecol. Stud. pp. 138-148.<br />
Kallio, P. and Kärenlampi, L. 1975. Photosynthesis in mosses<br />
and lichens. In: Cooper, J. P. Photosynthesis and<br />
Productivity in Different Environments, Chapt. 17. IBP,<br />
Cambridge University Press, Cambridge, pp. 393-423.<br />
Kappen, L. 1985. Vegetation and ecology of ice-free areas of<br />
northern Victoria Land, Antarctica. I. The lichen vegetation<br />
of Birthday Ridge and an inland mountain. Polar Biol. 4:<br />
213-235.<br />
Kellomäki, S., Hari, P., and Koponen, T. 1978. <strong>Ecology</strong> of<br />
photosynthesis in Dicranum and its taxonomic significance.<br />
Bryophyt. Biblioth. 13: 485-507.<br />
Kelly, M. G. and Whitton, B. A. 1987. Growth rate of the<br />
aquatic moss Rhynchostegium riparioides in northern<br />
England. Freshwat. Biol. 18: 461-468.<br />
Kershaw, K. A. and Webber, M. R. 1986. Seasonal changes in<br />
the chlorophyll content and quantum efficiency of the moss<br />
Brachythecium rutabulum. J. Bryol. 14: 151-158.<br />
Kilbertus, G. 1968. Décomposition d'une mousse:<br />
Pseudoscleropodium purum (Hedw.) Fleisch. dans la nature.<br />
Bul. l'Ecole Nat. Supérieure Agron. Nancy 10: 20-32.<br />
Laennergren, C. and Oevstedal, D. O. 1983. A limnological<br />
investigation of the tarn Syslaktjoenn, W. Norway. Holarct.<br />
Ecol. 6: 211-220.<br />
Larcher, W. 1983. Physiological Plant <strong>Ecology</strong>, corrected<br />
printing of the second printing. Springer-Verlag, New York,<br />
303 pp.<br />
Ligrone, R. 1988. Ultrastructure of a fungal endophyte in<br />
Phaeoceros laevis (L.) Prosk. (Anthocerotophyta). Bot. Gaz.<br />
(Crawfordsville) 149: 92-100.<br />
Ligrone, R. and Lopes, C. 1989. Cytology and development of a<br />
mycorrhiza-like infection in the gametophyte of<br />
Conocephalum conicum (L.) Dum., Marchantiales,<br />
Hepatophyta. New Phytol. 111: 423-434.<br />
Ligrone, R., Pocock, K., and Duckett, J. G. 1993. A comparative<br />
ultrastructural study of endophytic Basidiomycetes in the<br />
parasitic achlorophyllous hepatic Cryptothallus mirabilis and<br />
the closely allied photosynthetic species Aneura pinguis<br />
(Metzgeriales). Can. J. Bot. 71: 666-679.<br />
Liu, Y., Chen, J., Zhang, L., and Cao, T. 2001. [Photosynthetic<br />
characteristics of two Plagiomnium mosses in summer and<br />
winter.]. Ying Yong Sheng Tai Xue Bao = the Journal of<br />
Applied <strong>Ecology</strong> / Zhongguo Sheng Tai Xue Xue Hui,<br />
Zhongguo Ke Xue Yuan Shenyang Ying Yong Sheng Tai<br />
Yan Jiu Suo Zhu Ban <strong>12</strong>(1): 39-42.<br />
Longton, R. E. 1970. Growth and productivity of the moss<br />
Polytrichum alpestre Hoppe in Antarctic regions. In:<br />
Holdgate, M. W. (ed.). Antarctic <strong>Ecology</strong>. Academic Press,<br />
London, pp. 818-837.<br />
Longton, R. E. 1974. Microclimate and biomass in communities<br />
of the Bryum association on Ross Island, continental<br />
Antarctica. Bryologist 77: 109-<strong>12</strong>7.<br />
Chapter <strong>12</strong>: Productivity 19<br />
Longton, R. E. 1979. Studies on growth, reproduction and<br />
population ecology in relation to microclimate in the bipolar<br />
moss Polytrichum alpestre. Bryologist 82: 325-367.<br />
Longton, R. E. 1984. The role of bryophytes in terrestrial<br />
ecosystems. J. Hattori Bot. Lab. 55: 147-163.<br />
Longton, R. E. 1988. The Biology of Polar <strong>Bryophyte</strong>s and<br />
Lichens. Stud. Polar Res., Cambridge University Press, New<br />
York, NY (USA), 391 pp.<br />
Longton, R. E. 1992. The role of bryophytes and lichens in<br />
terrestrial ecosystems. In: Bates, J. W. and Farmer, A. M.<br />
(eds.). <strong>Bryophyte</strong>s and Lichens in a Changing Environment,<br />
Clarendon Press, Oxford, pp. 32-76.<br />
Longton, R. E. and Greene, S. W. 1969a. The growth and<br />
reproductive cycle of Pleurozium schreberi (Brid.) Mitt.<br />
Ann. Bot. 33: 83-105.<br />
Longton, R. E. and Greene, S. W. 1969b. Relationship between<br />
sex distribution and sporophyte production in Pleurozium<br />
schreberi (Brid.) Mitt. Ann. Bot. 33: 107-<strong>12</strong>6.<br />
Makinde, A. M. and Odu, E. A. 1994. Phenological studies of<br />
selected savanna mosses of south-western Nigeria.<br />
Experientia 50: 616-619.<br />
Martin, C. E. and Adamson, V. J. 2001. Photosynthetic capacity<br />
of mosses relative to vascular plants. J. Bryol. 23: 319-323.<br />
Martínez Abaigar, J., Núñez Olivera, E., and Sánchez-Díaz, M.<br />
1994. Seasonal changes in photosynthetic pigment<br />
composition of aquatic bryophytes. J. Bryol. 18: 97-113.<br />
Melick, D. R. and Seppelt, R. D. 1994. Seasonal investigations<br />
of soluble carbohydrates and pigment levels in Antarctic<br />
bryophytes and lichens. Bryologist 97: 13-19.<br />
Moore, T. R. 1989. Growth and net production of Sphagnum at<br />
five fen sites, subarctic eastern Canada. Can. J. Bot. 67:<br />
<strong>12</strong>03-<strong>12</strong>07.<br />
Munshi, J. D. 1974. Seasonal changes in standing crop and<br />
annual net production of two moss communities at Varanasi.<br />
Trop. Ecol. 15: 28-38.<br />
Naiman, R. J. 1983. The annual pattern and spatial distribution<br />
of aquatic oxygen metabolism in boreal forest watersheds.<br />
Ecol. Monogr. 53: 73-94.<br />
Naiman, R. J. and Sedell, J. R. 1980. Relationships between<br />
metabolic parameters and stream order in Oregon. Can. J.<br />
Fish. Aquat. Sci. 37: 834-847.<br />
Nakatsubo, T. 1990. Primary production and nitrogen economy<br />
of Racomitrium lanuginosum at the subalpine lava field of<br />
Mt. Fuji. Proc. Bryol. Soc. Japan 5: 65-82.<br />
Nash, T. H. III, White, S. L., and Marsh, J. E. 1977. Lichen and<br />
moss distribution and biomass in hot desert ecosystems.<br />
Bryologist 80: 470-479.<br />
Newbould, P. J. 1960. The ecology of Cranesmoor, a new forest<br />
valley bog. I. The present vegetation. J. Ecol. 48: 361-183.<br />
Oechel, W. C. 1976. Seasonal patterns of temperature response<br />
of CO2 flux and acclimation in Arctic mosses growing in<br />
situ. Photosynthetica 10: 447-456.<br />
Oechel, W. C. and Sveinbjörnsson, B. 1978. Primary production<br />
process in Arctic bryophytes at Barrow, Alaska. In:<br />
Tieszen, L. (ed.). Vegetation and Production <strong>Ecology</strong> of an<br />
Alaskan Arctic Tundra. Springer-Verlag New York Inc.,<br />
Secaucus, N. J., 686 pp.<br />
Pakarinen, P. 1978. Production and nutrient ecology of three<br />
Sphagnum species in southern Finnish raised bogs. Ann.<br />
Bot. Fenn. 15: 15-26.<br />
Paolillo, D. J. Jr. and. Bazzaz, F. A. 1968. Photosynthesis in<br />
sporophytes of Polytrichum and Funaria. Bryologist 71:<br />
335-343.
20 Chapter <strong>12</strong>: Productivity<br />
Petersen, K. 1984. Untersuchungen zur Photosynthese und<br />
Photorespiration bei Sphagnum magellanicum Brid. Ph.D.<br />
Dissertation, Universität Zu Kiel, Germany, 119 pp.<br />
Pike, L. H., Tracy, D. M., Sherwood, M., and Nielson, D. 1972.<br />
Estimates of biomass and fixed nitrogen of epiphytes from<br />
old-growth Douglas-fir. In: Franklin, J. F., Dempster, L. J.,<br />
and Waring, R. H. (eds.). Proceedings-Research on<br />
Coniferous Forest Ecosystems, USFA Forserv., Portland,<br />
Oregon, pp. 177-187.<br />
Pitkin, P. H. 1975. Variability and seasonality of the growth of<br />
some corticolous pleurocarpous mosses. J. Bryol. 8: 337-<br />
356.<br />
Pócs, T. 1980. The epiphytic biomass and its effect on the water<br />
balance of two rainforest types in the Uluguru Mountains<br />
(Tanzania, East Africa). Acta Bot. Acad. Sci. Hung. 26:<br />
143-167.<br />
Pócs, T. 1982. Tropical forest bryophytes. In: Smith, A. J. E.<br />
(ed.). <strong>Bryophyte</strong> <strong>Ecology</strong>. Chapman & Hall, London.<br />
Chapt. 3, pp. 59-104.<br />
Post, A. and Vesk, M. 1992. Photosynthesis, pigments, and<br />
chloroplast ultrastructure of an Antarctic liverwort from sunexposed<br />
and shaded sites. Can. J. Bot. 70: 2259-2264.<br />
Priddle, J. 1980a. The production ecology of benthic plants in<br />
some Antarctic lakes. 1. In situ production studies. J. Ecol.<br />
68: 141-153.<br />
Priddle, J. 1980b. The production ecology of benthic plants in<br />
some Antarctic lakes. 2. Laboratory physiology studies. J.<br />
Ecol. 68: 155-166.<br />
Rastorfer, J. R. 1972. Comparative physiology of four west<br />
Antarctic mosses. Antarct. Res. Ser. 20: 143-161.<br />
Rieley, J. O., Richards, P. W., and Bebbington, A. D. L. 1979.<br />
The ecological role of bryophytes in a North Wales<br />
woodland. J. Ecol. 67: 497-527.<br />
Rincòn, E. and Grime, J. P. 1989. An analysis of seasonal<br />
patterns of bryophyte growth in a natural habitat. J. Ecol. 77:<br />
447-455.<br />
Russell, S. 1984. Growth measurement in bryophytes: A case<br />
study. J. Hattori Bot. Lab. 56: 147-157.<br />
Russell, S. 1985. <strong>Bryophyte</strong> production at Marion Island. In:<br />
Siegfried, W. R., Condy, P. R., and Laws, R. M. (eds.).<br />
Antarctic Nutrient Cycles and Food Webs. 4. SCAR<br />
Symposium on Antarctic Biology, Wilderness (South<br />
Africa), <strong>12</strong>-16 Sep 1985, pp. 200-203.<br />
Russell, S. 1988. Measurement of bryophyte growth. 1.<br />
Biomass (harvest) techniques. In: Glime, J. M. (ed.).<br />
Methods in Bryology. Proceedings of the Bryological<br />
Methods Workshop, Mainz, Germany, Hattori Bot. Lab.,<br />
Nichinan, Japan, pp. 249-257.<br />
Russell, S. 1990. <strong>Bryophyte</strong> production and decomposition in<br />
tundra ecosystems. J. Linn. Soc. Bot. 104: 3-22.<br />
Sand-Jensen, K., Riis, T., Markager, S., and Vincent, W. F. 1999.<br />
Slow growth and decomposition of mosses in Arctic lakes.<br />
Can. J. Fish. Aquat. Sci. 56: 388-393.<br />
Sanford, G. R. 1979. Temperature related growth patterns in<br />
Amblystegium riparium. Bryologist 82: 525-532.<br />
Schofield, W. B. 1985. Introduction to Bryology. Macmillan<br />
Publ. Co., NY., xvi + 431 pp.<br />
Schwinning, S. 1993. When does one-sided competition fail to<br />
make plant size distributions more skewed? Bull. Ecol. Soc.<br />
Amer. Program and Abstracts, 78th Ann. ESA Meeting, 31<br />
July – 4 August 1993. Suppl. vol. 74(2): 432.<br />
Shiraishi, A., Ino, Y., and Mochida, Y. 1996. Growth and<br />
production of Sphagnum mosses from Takadayachi Moor in<br />
Hakkoda Mountains, northeast Japan 3. Seasonal changes of<br />
carbohydrate contents in shoots. Ecol. Rev. 23(3): 201-208.<br />
Simon, T. 1987. The leaf-area index of three moss species<br />
(Tortula ruralis, Ceratodon purpureus, and Hypnum<br />
cupressiforme). Symp. Biol. Hung. 35: 699-706.<br />
Skré, O. and Oechel, W. C. 1981. Moss functioning in different<br />
taiga ecosystems in interior Alaska. I. Seasonal, phenotypic,<br />
and drought effects on photosynthesis and response patterns.<br />
Oecologia 48: 50-59.<br />
Smith, A. J. E. 1982. Epiphytes and epiliths. In: Smith, A. J. E.<br />
(ed.). <strong>Bryophyte</strong> <strong>Ecology</strong>, Chapman & Hall, New York, pp.<br />
191-228.<br />
Smith, R. L. 1990. <strong>Ecology</strong> and Field Biology. Harper and Row,<br />
Publishers, New York. Chapt. 3.<br />
Stǻlfelt, M.-G. 1937. Über den Gasaustausch bei Moosen.<br />
Planta 27: 30-60.<br />
Stark, L. R. 1986. The life history of Forsstroemia trichomitria<br />
(Hedw.) Lindb., an epiphytic moss. Lindbergia <strong>12</strong>: 20-32.<br />
Stark, L. R. 2002. Invited Essay, New Frontiers in Bryology and<br />
Lichenology: Phenology and its repercussions on the<br />
reproductive ecology of mosses. Bryologist 105: 204-218.<br />
Stark, L. R., McLetchie, D. N., and Mishler, B. D. 2001. Sex<br />
expression and sex dimorphism in sporophytic populations of<br />
the desert moss Syntrichia caninervis. Plant Ecol. 157: 183-<br />
196.<br />
Suba, J., Kiszely-Vamosi, A., Legrady, Gy., and Orbán, S. 1982.<br />
Examination of the photosynthetic fixation 14 CO 2 on<br />
bryophyte and lichen species. Acta Bot. Acad. Sci. Hung.<br />
28(1,2): 181-191.<br />
Suyker, A. E., Verma, S. B., and Arkebauer, T. J. 1997. Seasonlong<br />
measurement of carbon dioxide exchange in a boreal<br />
fen. J. Geophys. Res. D. Atmospheres 102(D24): 29,021-<br />
29,028.<br />
Sveinbjörnsson, B. and Oechel, W. C. 1981. Controls on carbon<br />
dioxide exchange in two Polytrichum moss species, 2. The<br />
implications of belowground plant parts on the whole plant<br />
carbon balance. Oikos 36: 348-354.<br />
Sveinbjörnsson, B. and Oechel, W. C. 1983. The effect of<br />
temperature preconditioning on the temperature sensitivity of<br />
net CO2 flux in geographically diverse populations of the<br />
moss Polytrichum commune. <strong>Ecology</strong> 64: 1100-1108.<br />
Swanson, R. V. and Flanagan, L. B. 2001. Environmental<br />
regulation of carbon dioxide exchange at the forest floor in a<br />
boreal black spruce ecosystem. Agric. Forest Meteorol.<br />
108(3): 165-181.<br />
Szewczyk, E. 1978. Studies in the production of biomass in<br />
Pellia borealis. I. Characteristics of the material. Acta Biol.<br />
Cracoviensia Ser. Bot. 21: 75-84.<br />
Tallis, J. H. 1959. Periodicity of growth in Rhacomitrium<br />
lanuginosum. J. Linn. Soc. Bot. 56: 2<strong>12</strong>-217.<br />
Tallis, J. H. 1964. Growth studies on Rhacomitrium<br />
lanuginosum. Bryologist 67: 417-422.<br />
Tamm, C. O. 1953. Growth, yield and nutrition in carpets of a<br />
forest moss (Hylocomium splendens). Medd. Skogrforskn.<br />
Inst. Stockholm 43: 1-140.<br />
Timmer, V. R. 1970. Observations on the mineral nutrition of<br />
feather mosses under black spruce. Forest Research<br />
Laboratory, Canad. Forest. Serv., Report N-62.<br />
Titus, J. E., Wagner, D. J., and Stephens, M. D. 1983.<br />
Contrasting water relations of photosynthesis for two<br />
Sphagnum mosses. <strong>Ecology</strong> 64: 1109-1115.<br />
Tobiessen, P. L., Mott, K. A., and Slack, N. G. 1977. A<br />
comparative study of photosynthesis, respiration and water<br />
relations in four species of epiphytic mosses in relation to<br />
their vertical distribution. Bryophyt. Biblioth. 13: 253-277.
Uchida, M., Muraoka, H., Nakatsubo, T., Bekku, Y., Ueno, T.,<br />
Kanda, H., and Koizumi, H. 2002. Net photosynthesis,<br />
respiration, and production of the moss Sanionia uncinata on<br />
a glacier foreland in the High Arctic, Ny-Ålesund, Svalbard.<br />
Arct. Antarct. Alp. Res. 34: 287-292.<br />
Ulychna, K. O. 1963. Age of the gametophytes of Polytrichum<br />
commune Hedw. and Hylocomium splendens (Hedw.) Br.<br />
Eur. in the plant groupings (communities) of Chomogora.<br />
Ukrajins'k. Bot. Zurn. 20(5): 61-67.<br />
Vitt, D. H. 1989. Patterns of growth of the drought tolerant<br />
moss, Racomitrium microcarpon, over a three-year period.<br />
Lindbergia 15: 181-187.<br />
Vitt, D. H. 1990. Growth and production dynamics of boreal<br />
mosses over climatic, chemical and topographic gradients. J.<br />
Linn. Soc. Bot. 104: 35-59.<br />
Vitt, D. H. and Pakarinen, P. 1977. The bryophyte vegetation,<br />
production and organic compounds of Truelove Lowland. In<br />
L. C. Bliss (ed.): Truelove Lowland, Devon Island, Canada:<br />
A high Arctic ecosystem. Univ. Alberta Press, Edmonton,<br />
pp. 225-44.<br />
Waddington, J. M. and Warner, K. D. 2000. Atmospheric CO2<br />
sequestration in restored mined peatlands. Ecoscience 8(3):<br />
359-368.<br />
Wagner, D. H., Christy, J. A., and Larson, D. W. 2000. Deepwater<br />
bryophytes from Waldo Lake, Oregon. Lake<br />
Reservoir Mgmt. 16: 91-99.<br />
Weetman, G. F. 1968. The relationship between feather moss<br />
growth and the nutrition of black spruce. In: Lafleur, C. and<br />
Butler, J. (eds.). Proc. 3rd Internat. Peat Cong., Quebec,<br />
Natl. Res. Council Canada, Ottawa, pp. 366-370.<br />
Wetzel, R. G., Brammer, E. S., Lindström, K., and Forsberg, C.<br />
1985. Photosynthesis of submersed macrophytes in acidified<br />
lakes: II. Carbon limitation and utilization of benthic CO2<br />
sources. Aquat. Bot. 22: 107-<strong>12</strong>0.<br />
Whitehead, D. and Gower, S. T. 2001. Photosynthesis and lightuse<br />
efficiency by plants in a Canadian boreal forest<br />
ecosystem. Tree Physiol. 21: 925-929.<br />
Whittaker, R. H., Bormann, F. H., Likens, G. E., and Siccama, T.<br />
G. 1974. The Hubbard Brook Study: Forest biomass and<br />
production. Ecol. Monogr. 44: 233-254.<br />
Wieder, R. K., Yavitt, J. B., Lang, G. E., and Bennett, C. A.<br />
1989. Aboveground net primary production at Big Run Bog,<br />
West Virginia. Castanea 54: 209-216.<br />
Wiklund, K. and Rydin, H. 2004. Colony expansion of Neckera<br />
pennata: Modelled growth rate and effect of microhabitat,<br />
competition, and precipitation. Bryologist 107: 293-301.<br />
Williams, T. G. and Flanagan, L. B. 1998. Measuring and<br />
modelling environmental influences on photosynthetic gas<br />
exchange in Sphagnum and Pleurozium. Plant Cell Environ.<br />
21: 555-564.<br />
Zechmeister, H. G. 1995. Growth rates of five pleurocarpous<br />
moss species under various climatic conditions. J. Bryol. 18:<br />
455-468.<br />
Zechmeister, H. G. 1998. Annual growth of four pleurocarpous<br />
moss species and their applicability for biomonitoring heavy<br />
metals. Environ. Monitor. Assess. 52: 441-451.<br />
Zhang, J. 1998. Ecological studies on interspecific interrelations<br />
between two mosses Pleurozium schreberi and Dicranum<br />
polysetum on the boreal forest floor. Ph. D. Dissertation,<br />
<strong>Michigan</strong> Technological University, Houghton, 254 pp.<br />
Zotz, G. and Rottenberger, S. 2001. Seasonal changes in diel<br />
CO2 exchange of three central European moss species: A<br />
one-year field study. Plant Biol. 3: 661-669.<br />
Chapter <strong>12</strong>: Productivity 21