Article

Grazing Intensity Alters Leaf and Spike Photosynthesis, Transpiration, and Related Parameters of Three Grass Species on an Alpine Steppe in the Qilian Mountains

State Key Laboratory of Grassland Agro-Ecosystems, Key Laboratory of Grassland Livestock Industry Innovation, Ministry of Agriculture and Rural Affairs, College of Pastoral Agriculture Science and Technology, Lanzhou University, Lanzhou 730000, China
*
Author to whom correspondence should be addressed.
Plants 2021, 10(2), 294; https://doi.org/10.3390/plants10020294
Submission received: 26 December 2020 / Revised: 19 January 2021 / Accepted: 29 January 2021 / Published: 4 February 2021

Abstract

:
The effect of grazing on leaf photosynthesis has been extensively studied. However, the influence of grazing on photosynthesis in other green tissues, especially spike, has remained poorly understood. This study investigated the impact of different grazing intensities (light grazing (LG), medium grazing (MG), and heavy grazing (HG)) on leaf and spike photosynthesis parameters and photosynthetic pigments of three grass species (Stipa purpurea, Achnatherum inebrians, and Leymus secalinus) on an alpine steppe in the Qilian Mountains. Grazing promoted leaf photosynthesis rate in S. purpurea and L. secalinus but reduced it in A. inebrians. Conversely, spike photosynthesis rate decreased in S. purpurea and L. secalinus under intense grazing, while there was no significant difference in spike photosynthesis rate in A. inebrians. The leaf and spike net photosynthetic rate (Pn) and transpiration rate (Tr) in S. purpurea were the greatest among the three species, while their organ temperatures were the lowest. On the other hand, grazing stimulated leaf chlorophyll biosynthesis in S. purpurea and L. secalinus but accelerated leaf chlorophyll degradation in A. inebrians. Furthermore, spike chlorophyll biosynthesis was inhibited in the three species under grazing, and only L. secalinus had the ability to recover from the impairment. Grazing had a positive effect on leaf photosynthesis parameters of S. purpurea and L. secalinus but a negative effect on those of A. inebrians. However, spike photosynthesis parameters were negatively influenced by grazing. Among the three species investigated, S. purpurea displayed the greatest ability for leaf and spike photosynthesis to withstand and acclimate to grazing stress. This study suggests that moderate grazing enhanced leaf photosynthetic capacity of S. purpurea and L. secalinus but reduced it in A. inebrians. However, spike photosynthetic capacity of three grass species decreased in response to grazing intensities.

1. Introduction

Rangelands cover more than 50% of the global terrestrial surface, and grazing is one of the most important utilizations of rangelands [1,2]. Photosynthesis, the most fundamental and intricate physiological process in all green plants and the primary source of energy for all life, contributes substantially to plant growth and development [3,4]. Owing to the combined effects of foraging, trampling, and excretion by livestock, grazing exerts a strong effect on the morphological and physiological characteristics of plants, the physical and chemical properties of the soil, and various abiotic and biotic factors, thus influencing the photosynthesis of rangelands [5,6,7]. Previous studies have shown that the effects of grazing on photosynthesis vary with grazing intensity and frequency [6,8]; that is, grazing contributes to either enhancing or reducing photosynthesis [9,10].
Leaves have long been considered the major photosynthetic organs in plants [11]. However, in addition to leaves, nonfoliar green organs containing chlorophyll, which exist on nearly all vegetative and reproductive structures in higher plants, can also be photosynthetically active and can perform photosynthetic CO2 assimilation [12,13]. To date, research on photosynthesis of nonfoliar organs has been performed mostly in crops species because photosynthesis of nonfoliar organs substantially contributes to crop growth and productivity, and more than 90% of crop biomass is derived from photosynthesis products assimilated by chlorenchyma tissue [12,13].
Among nonfoliar organs, spikes are optimized for active photosynthesis because their location is suitable for intercepting and capturing light and CO2. Spikes are composed of glumes, paleae, lemmata, awns, and rachides, which contain chlorophyll [14,15]. Furthermore, ear photosynthesis, which contributes 45–65% of the total grain filling for cereal species, is thought to make significant contributions in terms of the source of photoassimilates [16]. Owing to their delayed senescence, certain reproductive organs may play the same essential role as leaf photosynthesis but at a later stage of plant growth [14,17]. Moreover, reproductive organs often seem to be more resistant than leaves to certain abiotic stresses, which may suggest important adaptive characteristics [14,18]. Hence, because spikes are reproductive organs, research on spike photosynthesis has mainly focused on the different spike structures among cereals, such as wheat, barley, oats, and rice, under drought, high temperature, and heat stress [19,20,21,22]. However, little is known about how grazing impacts spike photosynthesis in graminoids such as Stipa purpurea, Achnatherum inebrians, and Leymus secalinus, which bear spikes as cereal crops.
Grassland degradation induced by overgrazing has become a severe problem on the northern slopes of the Qilian Mountains. The Qilian Mountains, located on the northeastern margin of the Qinghai–Tibetan Plateau in northwestern China, are of extraordinary importance as a water source for the lower reaches of the inland Heihe, Shiyang, and Shule rivers of the Hexi Corridor; these mountains have a crucial influence on ecosystem and water resource use within the Hexi Oasis [23,24,25]. Furthermore, by virtue of considerable glacier and water resource reserves, the Qilian Mountains are also vital ecological shelters in northwestern China [26,27]. As an important region for eco-environmental research, the northern slopes of the Qilian Mountains are not only a natural barrier between the Gobi Desert and the Qinghai–Tibetan Plateau but also a major base for animal husbandry in China [27]. Although transhumance pastoral systems are still in use in this area, which has a long history of livestock grazing, overgrazing has always been common because grazing pressure depends on the livestock number rather than the carrying capacity of grasslands [28]. The mean stocking rate in this area (0.94 sheep ha−1) was once 59% greater than the calculated stocking rate (0.59 sheep ha−1) for sustainable grazing [29].
In the study area, both S. purpurea and L. secalinus are dominant in the upper canopy layer of lightly and moderately grazed communities, while A. inebrians is dominant in the upper canopy layer of lightly, moderately, and heavily grazed communities. However, little is known about how leaf and spike photosynthesis parameters of these three grass species respond to grazing and about their differences in avoidance and tolerance strategies under the different grazing intensities. Therefore, we analyzed how different levels of grazing intensity influenced (i) photosynthesis parameters (net photosynthetic rate (Pn), transpiration rate (Tr), water use efficiency (WUE), leaf temperature (Tl), and spike temperature (Ts)); and (ii) photosynthetic pigments (chlorophyll a (Chl a), chlorophyll b (Chl b), total chlorophyll (TC), carotenoid (Car), chlorophyll a/chlorophyll b ratio (Chl a/b), and total chlorophyll/total carotenoid ratio (TC/Car). Specifically, the objectives of this study were as follows: (i) to examine the photosynthetic response and adaption of the three dominant grass species at different grazing intensities; (ii) to clarify differences in species’ strategies in response to grazing intensities; (iii) to explore the difference in the photosynthesis parameters between leaves and spikes of the three grass species under the different grazing intensities. We hypothesized (i) that owing to the compensatory photosynthesis, moderate grazing can enhance plant photosynthetic capacity; (ii) grazing intensity may have a different impact on photosynthetic capacity of A. inebrians due to its toxicity, which is a species strategy different from the other two species; (iii) due to the distinct spatial location, the photosynthetic capacity of leaf and spike may respond differently to the same grazing intensity.

2. Results

2.1. Environmental Parameters

Conditions were clear and sunny on the days when photosynthesis was measured. The changes in photosynthetically active radiation (PAR), air temperature (Ta), and air relative humidity (RH) were reasonably similar each day (Figure 1). The curve of the diurnal variation of the PAR had a notable single peak on a sunny day. The daily greatest PAR value was achieved at 13:00, peaking at 2002.96 µmol m−2 s−1 and decreasing thereafter. There was similar trend in the Ta diurnal pattern, with a peak value of 36.65 °C at 13:00 and gradually declining in the afternoon. Conversely, different from that which occurred for the PAR and Ta, the diurnal change in the RH presented a slightly valley at 13:00 and varied between 29.29 and 41.99%.

2.2. Photosynthesis Parameters

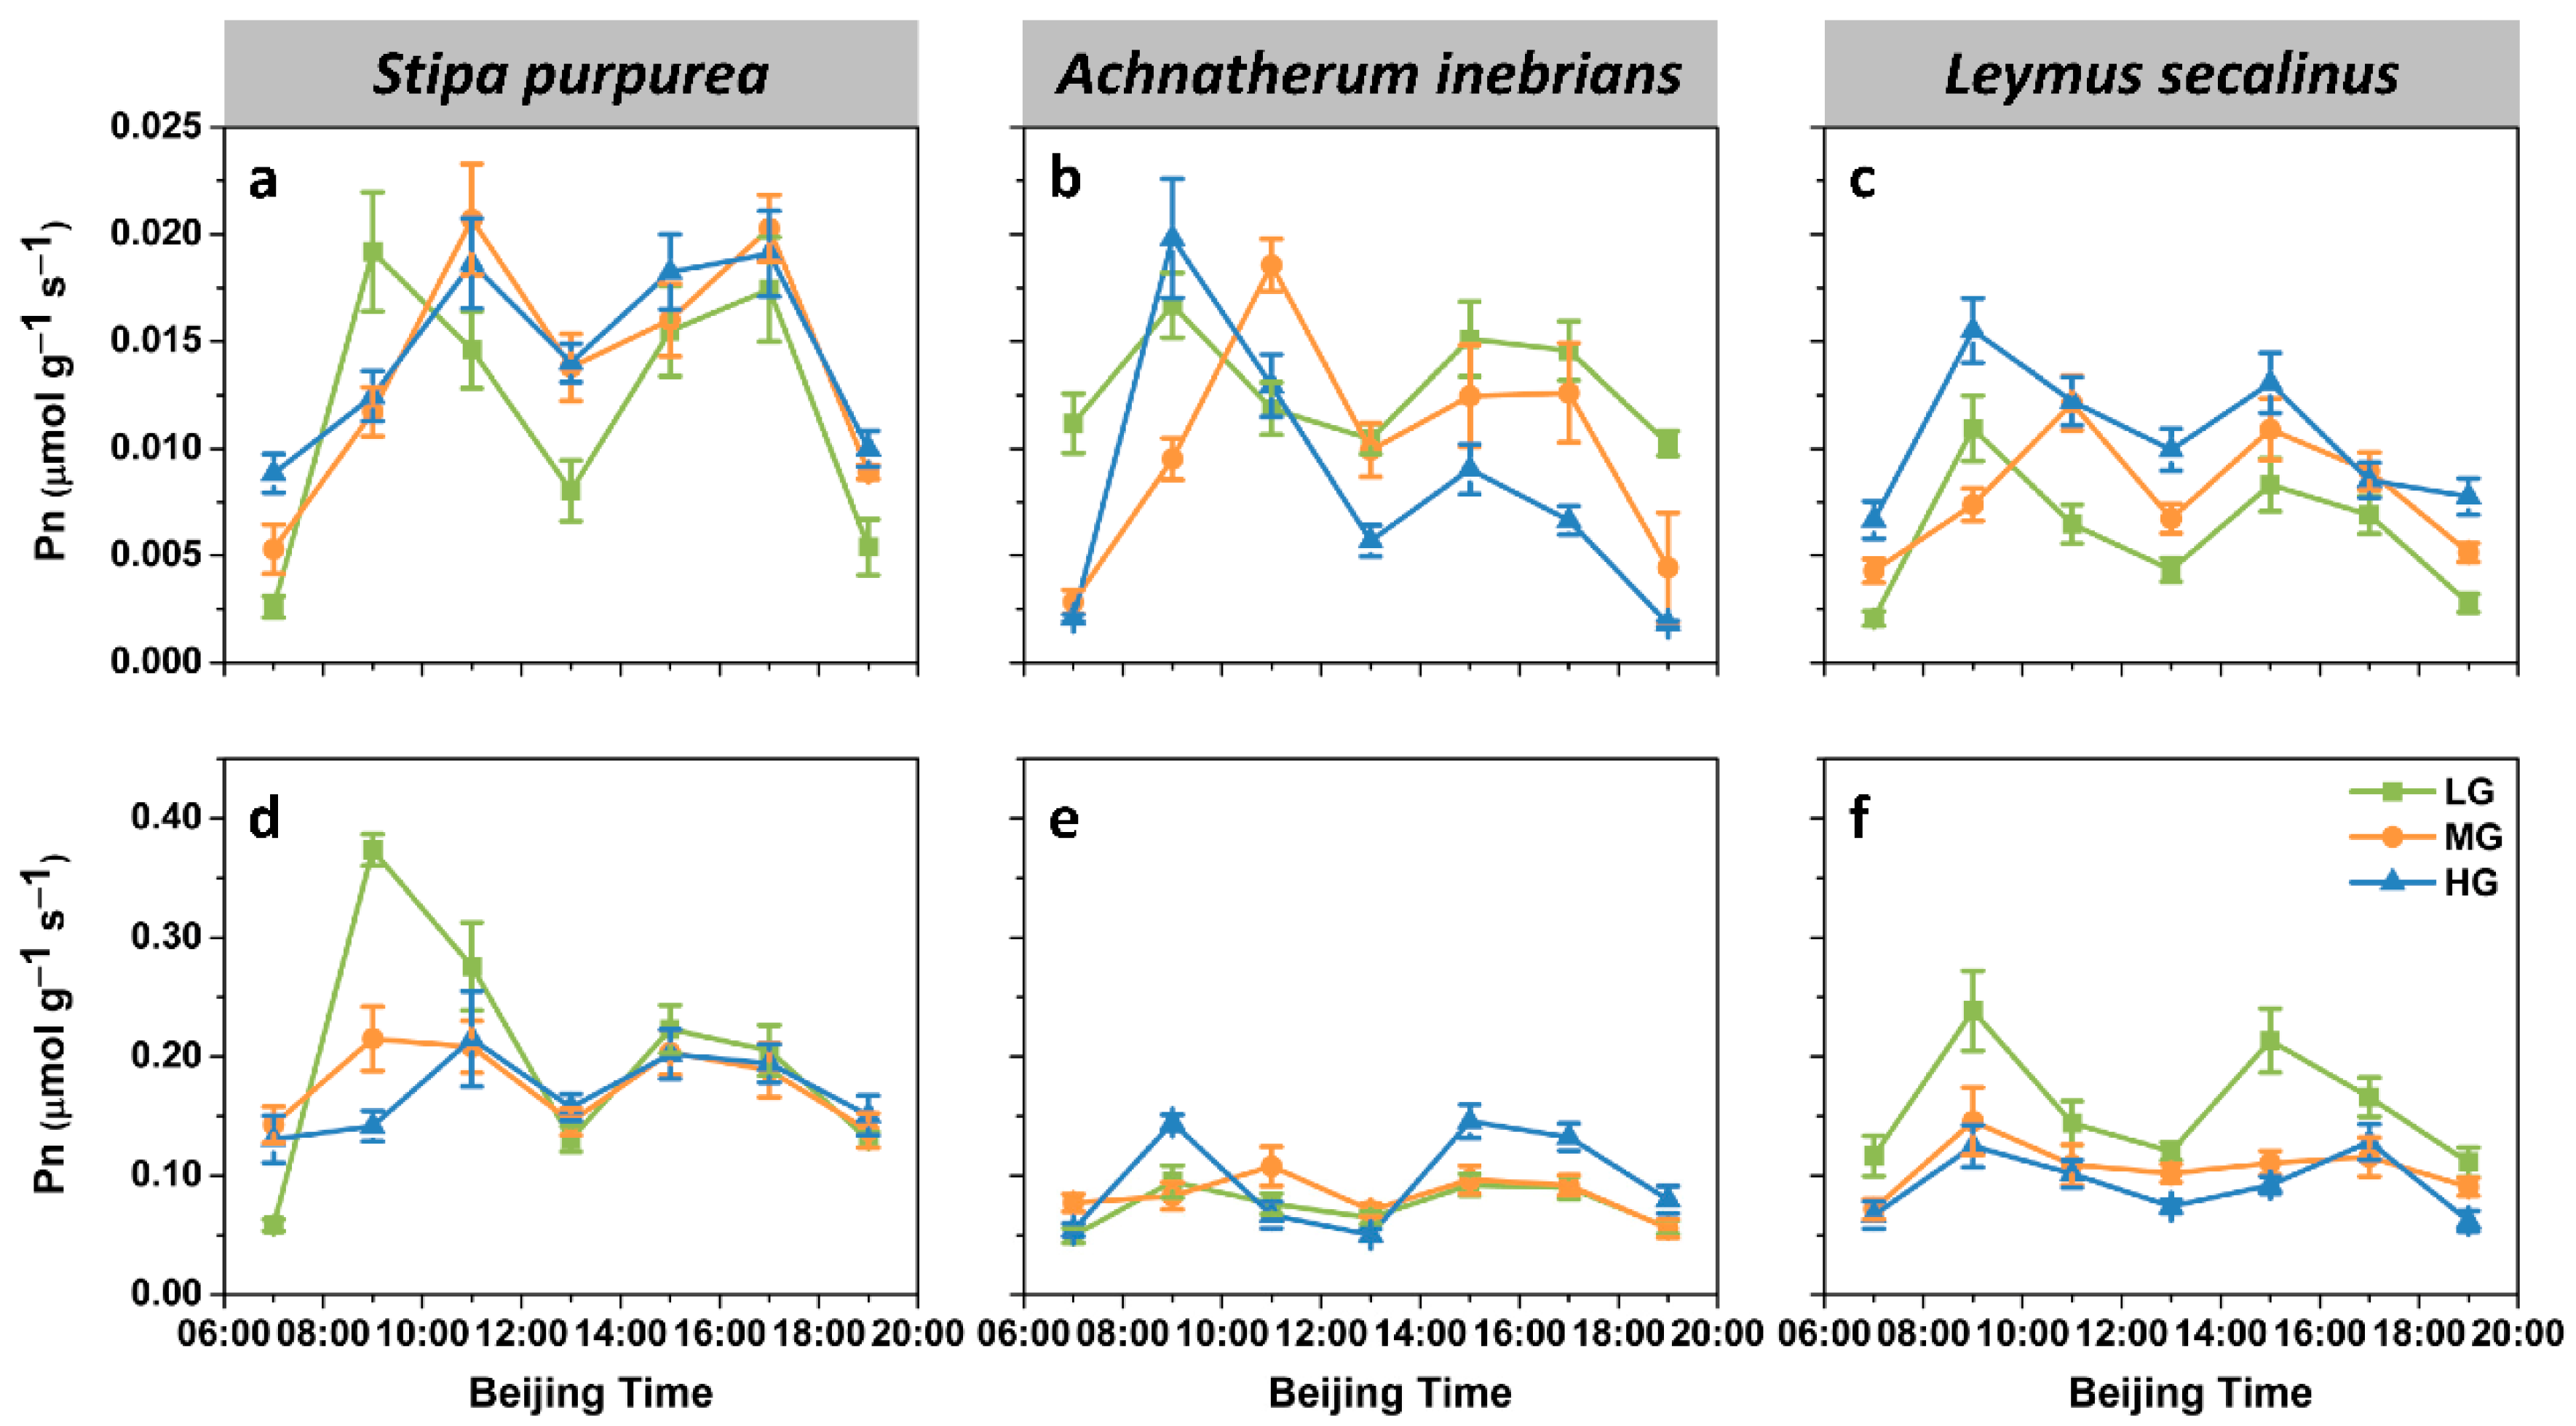
2.2.1. Net Photosynthetic Rate

Regardless grazing intensity, leaf Pn of the three species all showed a bimodal pattern, with peak values in the morning (09:00–11:00) and afternoon (15:00–17:00) and an apparent midday depression at 13:00 (Figure 2a–c). The trends of the Pn patterns of the spikes were the same as those of the leaves for each species (Figure 2d–f). Among the three species, S. purpurea had the highest daily mean Pn values for both leaf and spike.
The ANOVA results showed that the effects of species on the Pn were highly significant (p ≤ 0.001) in both the leaves and spikes (Figure 3a and Figure 4a). Furthermore, grazing intensity significantly affected spike Pn (p ≤ 0.001), whereas no significant differences were found in the leaf Pn (p > 0.05). The daily mean value of the leaf Pn of L. secalinus was the greatest under heavy grazing (HG), was significantly lower under medium grazing (MG) and was much lower under light grazing (LG). There were similar trends in the daily mean value of the leaf Pn of S. purpurea. In contrast, the daily mean value of the leaf Pn of A. inebrians was significantly greater under LG than under MG and HG. Interestingly, the daily mean value of the spike Pn of S. purpurea under HG was not significantly different from that under MG but lower than that under LG. Similarly, compared with those under LG, the daily mean values of the spike Pn of L. secalinus were significantly lower under MG and HG. Conversely, there were no significant differences in the daily mean value of the spike Pn of A. inebrians under LG, MG or HG. Compared with those under LG, the mean values of the spike Pn were significantly lower under MG and HG. However, there were no significant differences in the mean values of the leaf Pn under LG, MG and HG. Furthermore, compared with the mean values of the Pn of S. purpurea, the mean values of the Pn of A. inebrians and L. secalinus were 22.21% and 39.12% lower (p ≤ 0.001) in the leaves, respectively, and were 53.52% and 34.62% lower (p ≤ 0.001) in the spikes, respectively.

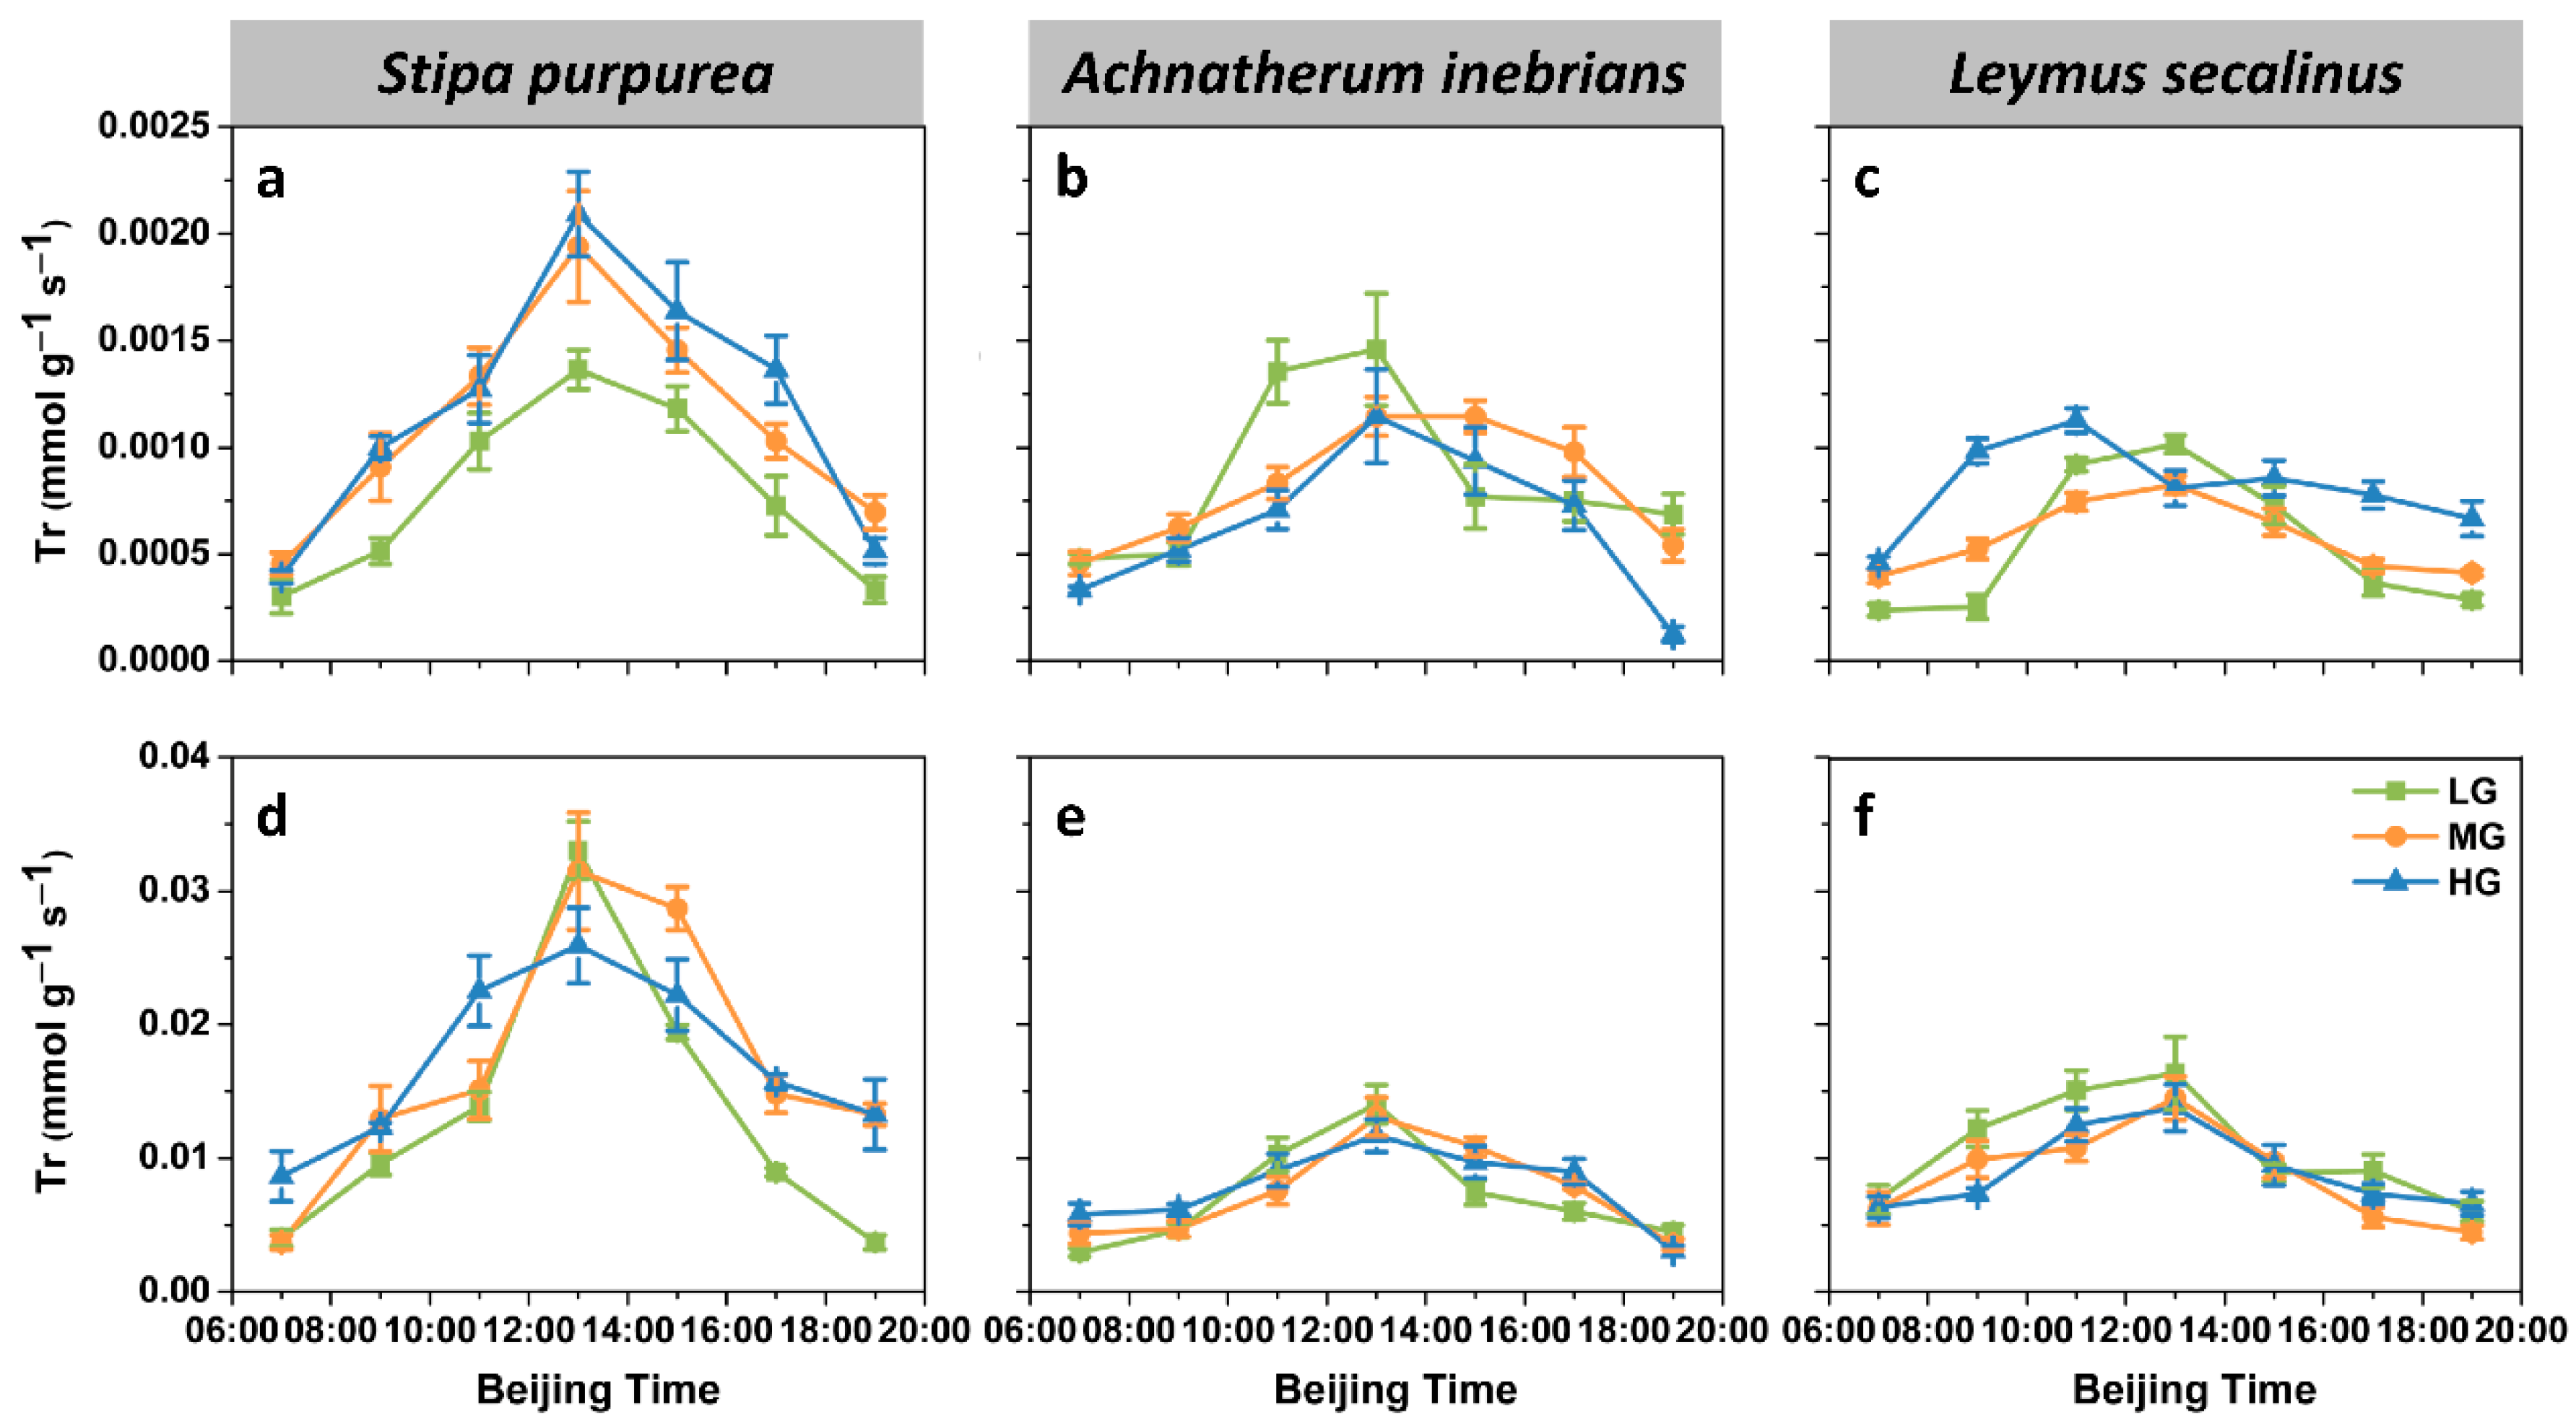
2.2.2. Transpiration Rate

The diurnal variation of the leaf transpiration rate (Tr) was unimodal under each grazing intensity in all three species, peaking at 13:00, except for the leaf Tr under HG in L. secalinus (Figure 5a–c). The maximum leaf Tr in L. secalinus (0.0011 mmol g−1 s−1) was half of the maximum value in S. purpurea (0.0021 mmol g−1 s−1), while the corresponding value in A. inebrians was slightly more than half that in S. purpurea (0.0015 mmol g−1 s−1). The diurnal pattern of the spike Tr was the same as that of the leaf Tr (Figure 5d–f). The maximum value of the spike Tr occurred in S. purpurea (0.033 mmol g−1 s−1), which was slightly more than twice that of A. inebrians (maximum 0.014 mmol g−1 s−1) and L. secalinus (maximum 0.016 mmol g−1 s−1).
ANOVA revealed that the effects of species on the Tr were highly significant (p ≤ 0.001) in both the leaves and spikes (Figure 3b and Figure 4b). Additionally, grazing intensity significantly affected leaf Tr (p ≤ 0.01), whereas no significant differences were found in the spike Tr (p > 0.05). Compared with those under LG, the daily mean values of the leaf Tr of S. purpurea were significantly greater under MG and HG. There were similar trends in the daily mean values of the spike Tr of S. purpurea. The daily mean value of the leaf Tr of L. secalinus was significantly greater under HG than under LG and MG. However, the daily mean value of the leaf Tr of A. inebrians was lower under HG than LG and MG, but no significant differences were detected between MG and HG. Furthermore, there were no significant differences in the daily mean values of the spike Tr under LG, MG and HG, whether in A. inebrians or in L. secalinus. The mean values of the leaf Tr under MG and HG were significantly greater than those under LG, while no significant differences were detected in the mean values of the spike Tr under LG, MG and HG. Compared with the mean values of the Tr of S. purpurea, the mean values of the Tr of A. inebrians and L. secalinus were 24.89% and 37.55%% lower (p ≤ 0.001) in the leaves, respectively, and were 52.79% and 39.87% lower (p ≤ 0.001) in the spikes, respectively.

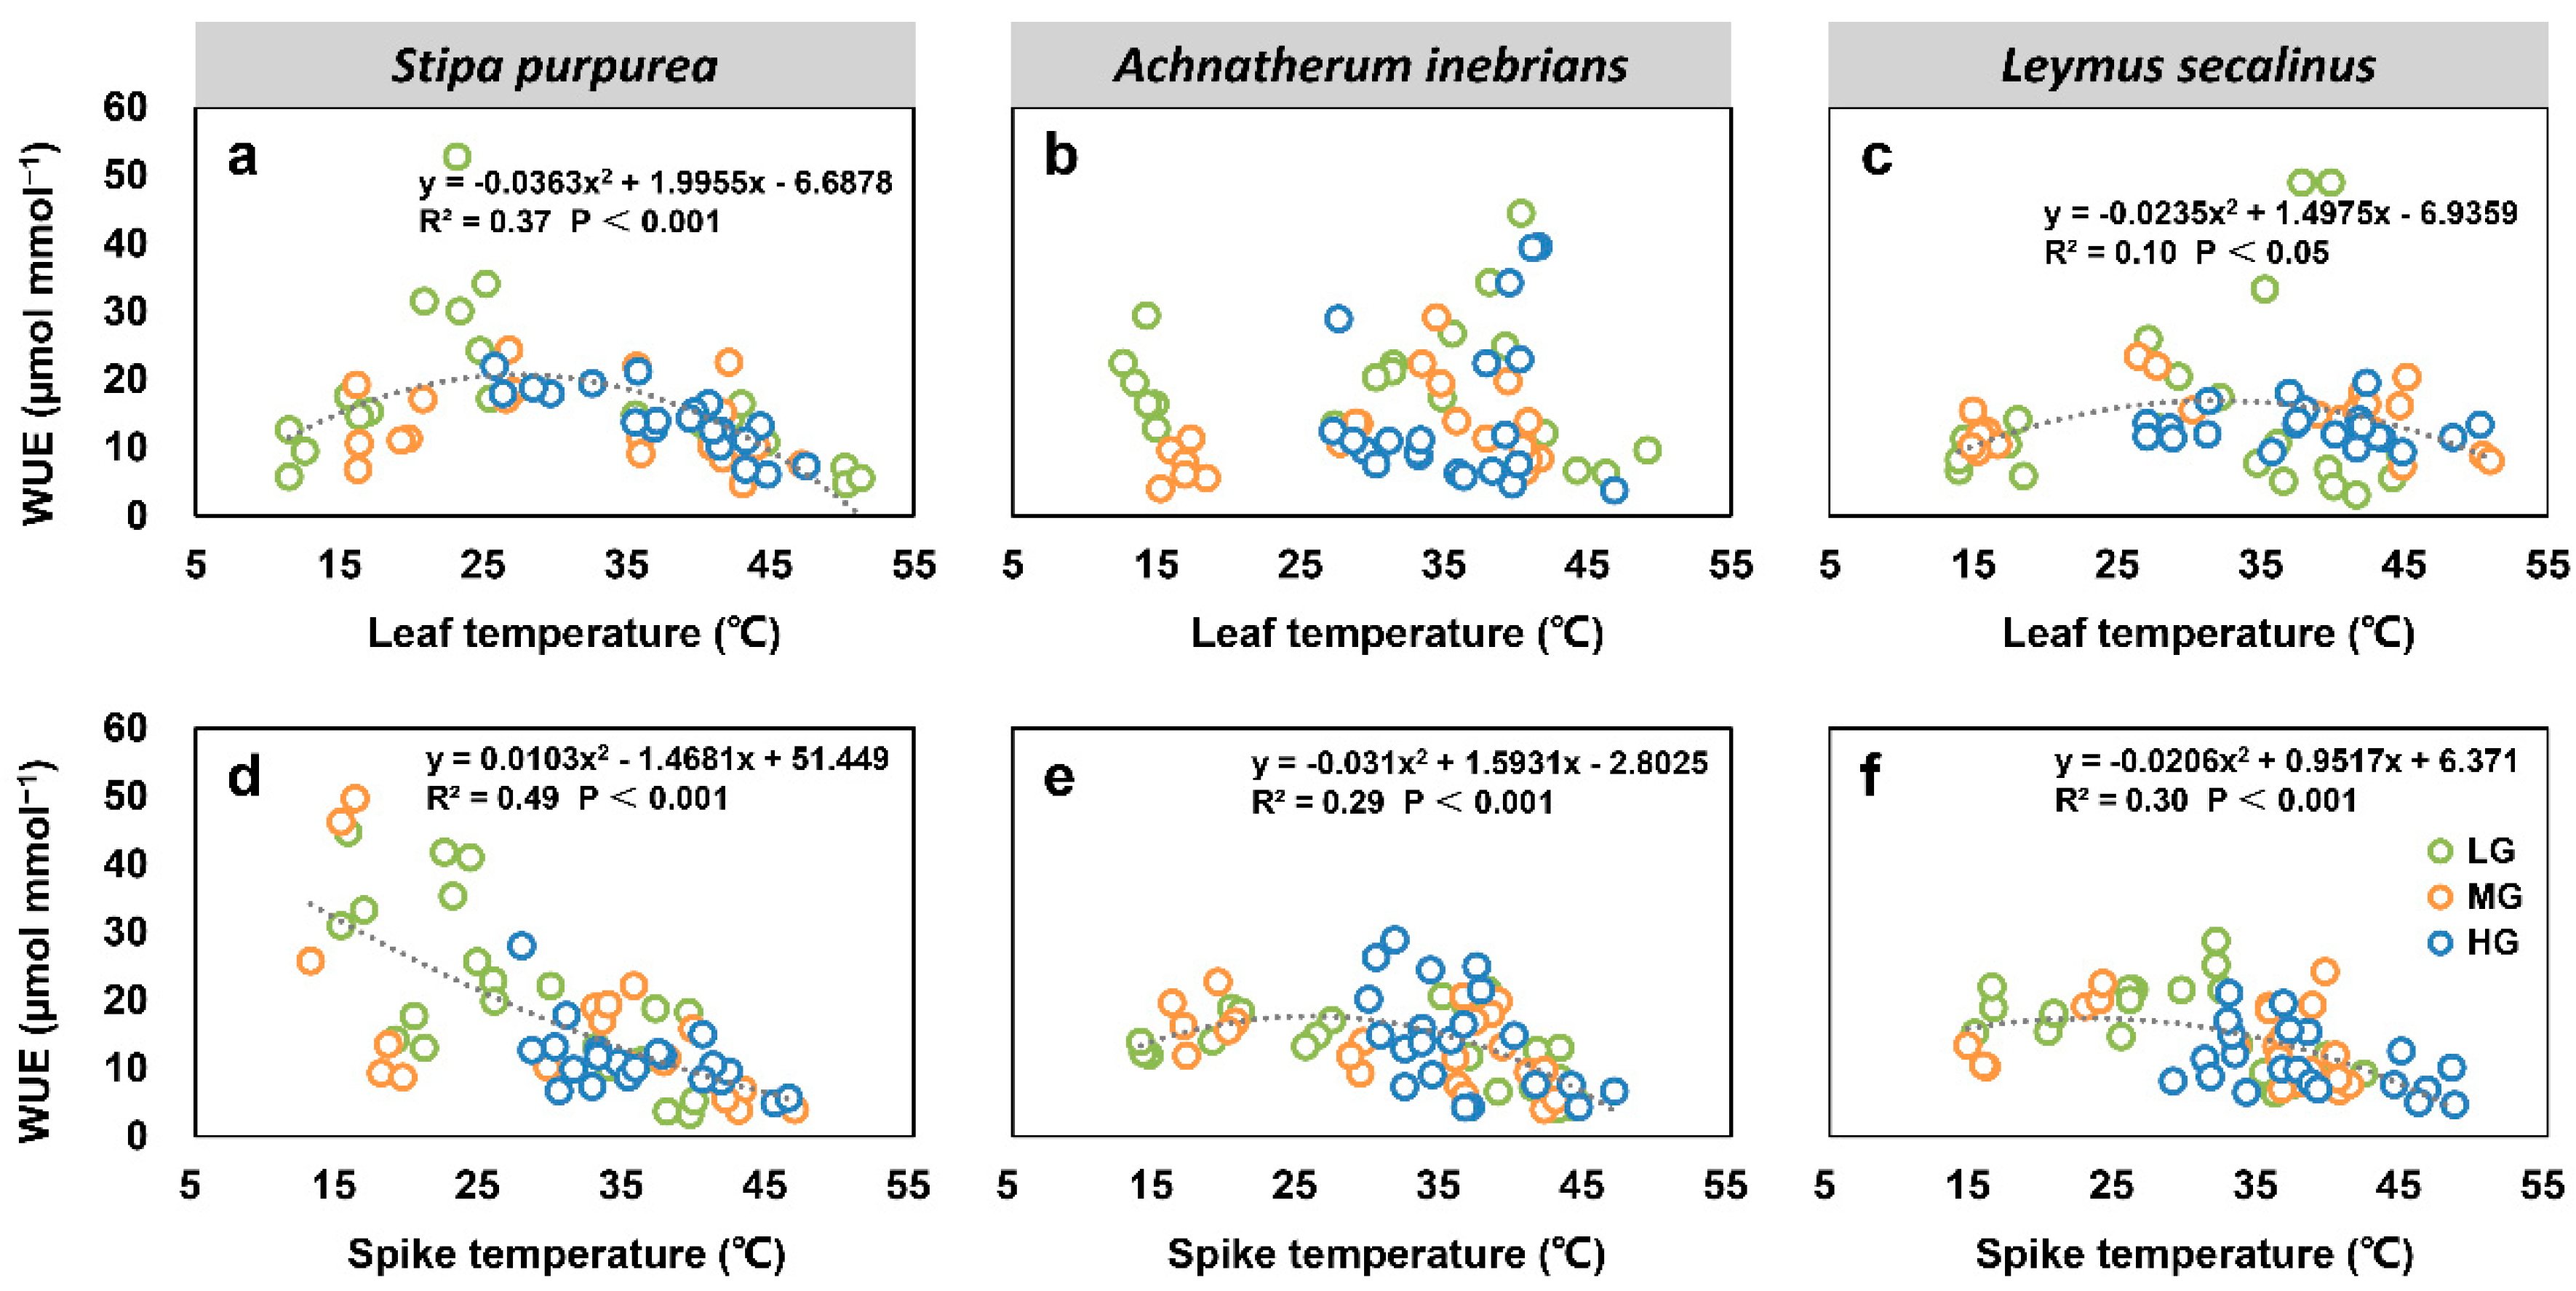
2.2.3. Water Use Efficiency

The grazing intensity had significant effects on the diurnal patterns of the water use efficiency (WUE) (Figure 6). For the leaf WUE under LG and MG in the three species, the first peaks were observed at 09:00 and 11:00, but the second peaks were found at 15:00 and 17:00. However, the leaf WUE of S. purpurea under HG exhibited an inverse unimodal pattern. Conversely, the leaf WUE of L. secalinus under HG was relatively stable throughout the day. The leaf WUE of A. inebrians under HG peaked at 09:00 but exhibited a large reduction at 13:00 and then started to increase again at 19:00. Similarly, the spike WUE of both S. purpurea under LG and A. inebrians under HG exhibited the same trends. Moreover, the spike WUE of S. purpurea under MG and HG decreased from early morning (07:00) until noon (13:00) but then increased. There were similar trends in the spike WUE of A. inebrians under LG and MG. Unlike that which occurred for the spike WUE of the other two species, double peaks were observed for the spike WUE of L. secalinus at 09:00 and 15:00–17:00.
The ANOVA results showed that species significantly affected the spike WUE (p ≤ 0.001), whereas it was not significant for the leaf WUE (p > 0.05) (Figure 3c and Figure 4c). Moreover, the effects of grazing intensity were highly significant (p ≤ 0.001) in both the leaves and spikes. The minimum daily mean value of the leaf WUE was achieved under MG in A. inebrians; this value was 34.48% lower than the maximum daily mean value obtained under LG in the same species. However, no significant differences were detected in the daily mean values of the leaf WUE in either S. purpurea or L. secalinus under LG, MG and HG. Conversely, the daily mean value of the spike WUE of S. purpurea significantly decreased with increasing grazing intensity. A similar trend was observed in the daily mean values of the spike WUE of L. secalinus. The mean value of the spike WUE was the greatest under LG, was significantly lower under MG and was much lower under HG. There were similar trends in the mean values of the leaf WUE but none of the differences were significant between MG and HG. Furthermore, the mean value of the spike WUE was significantly greater in S. purpurea than that in A. inebrians and L. secalinus. However, there were no significant differences in the mean values of the leaf WUE among the three species.

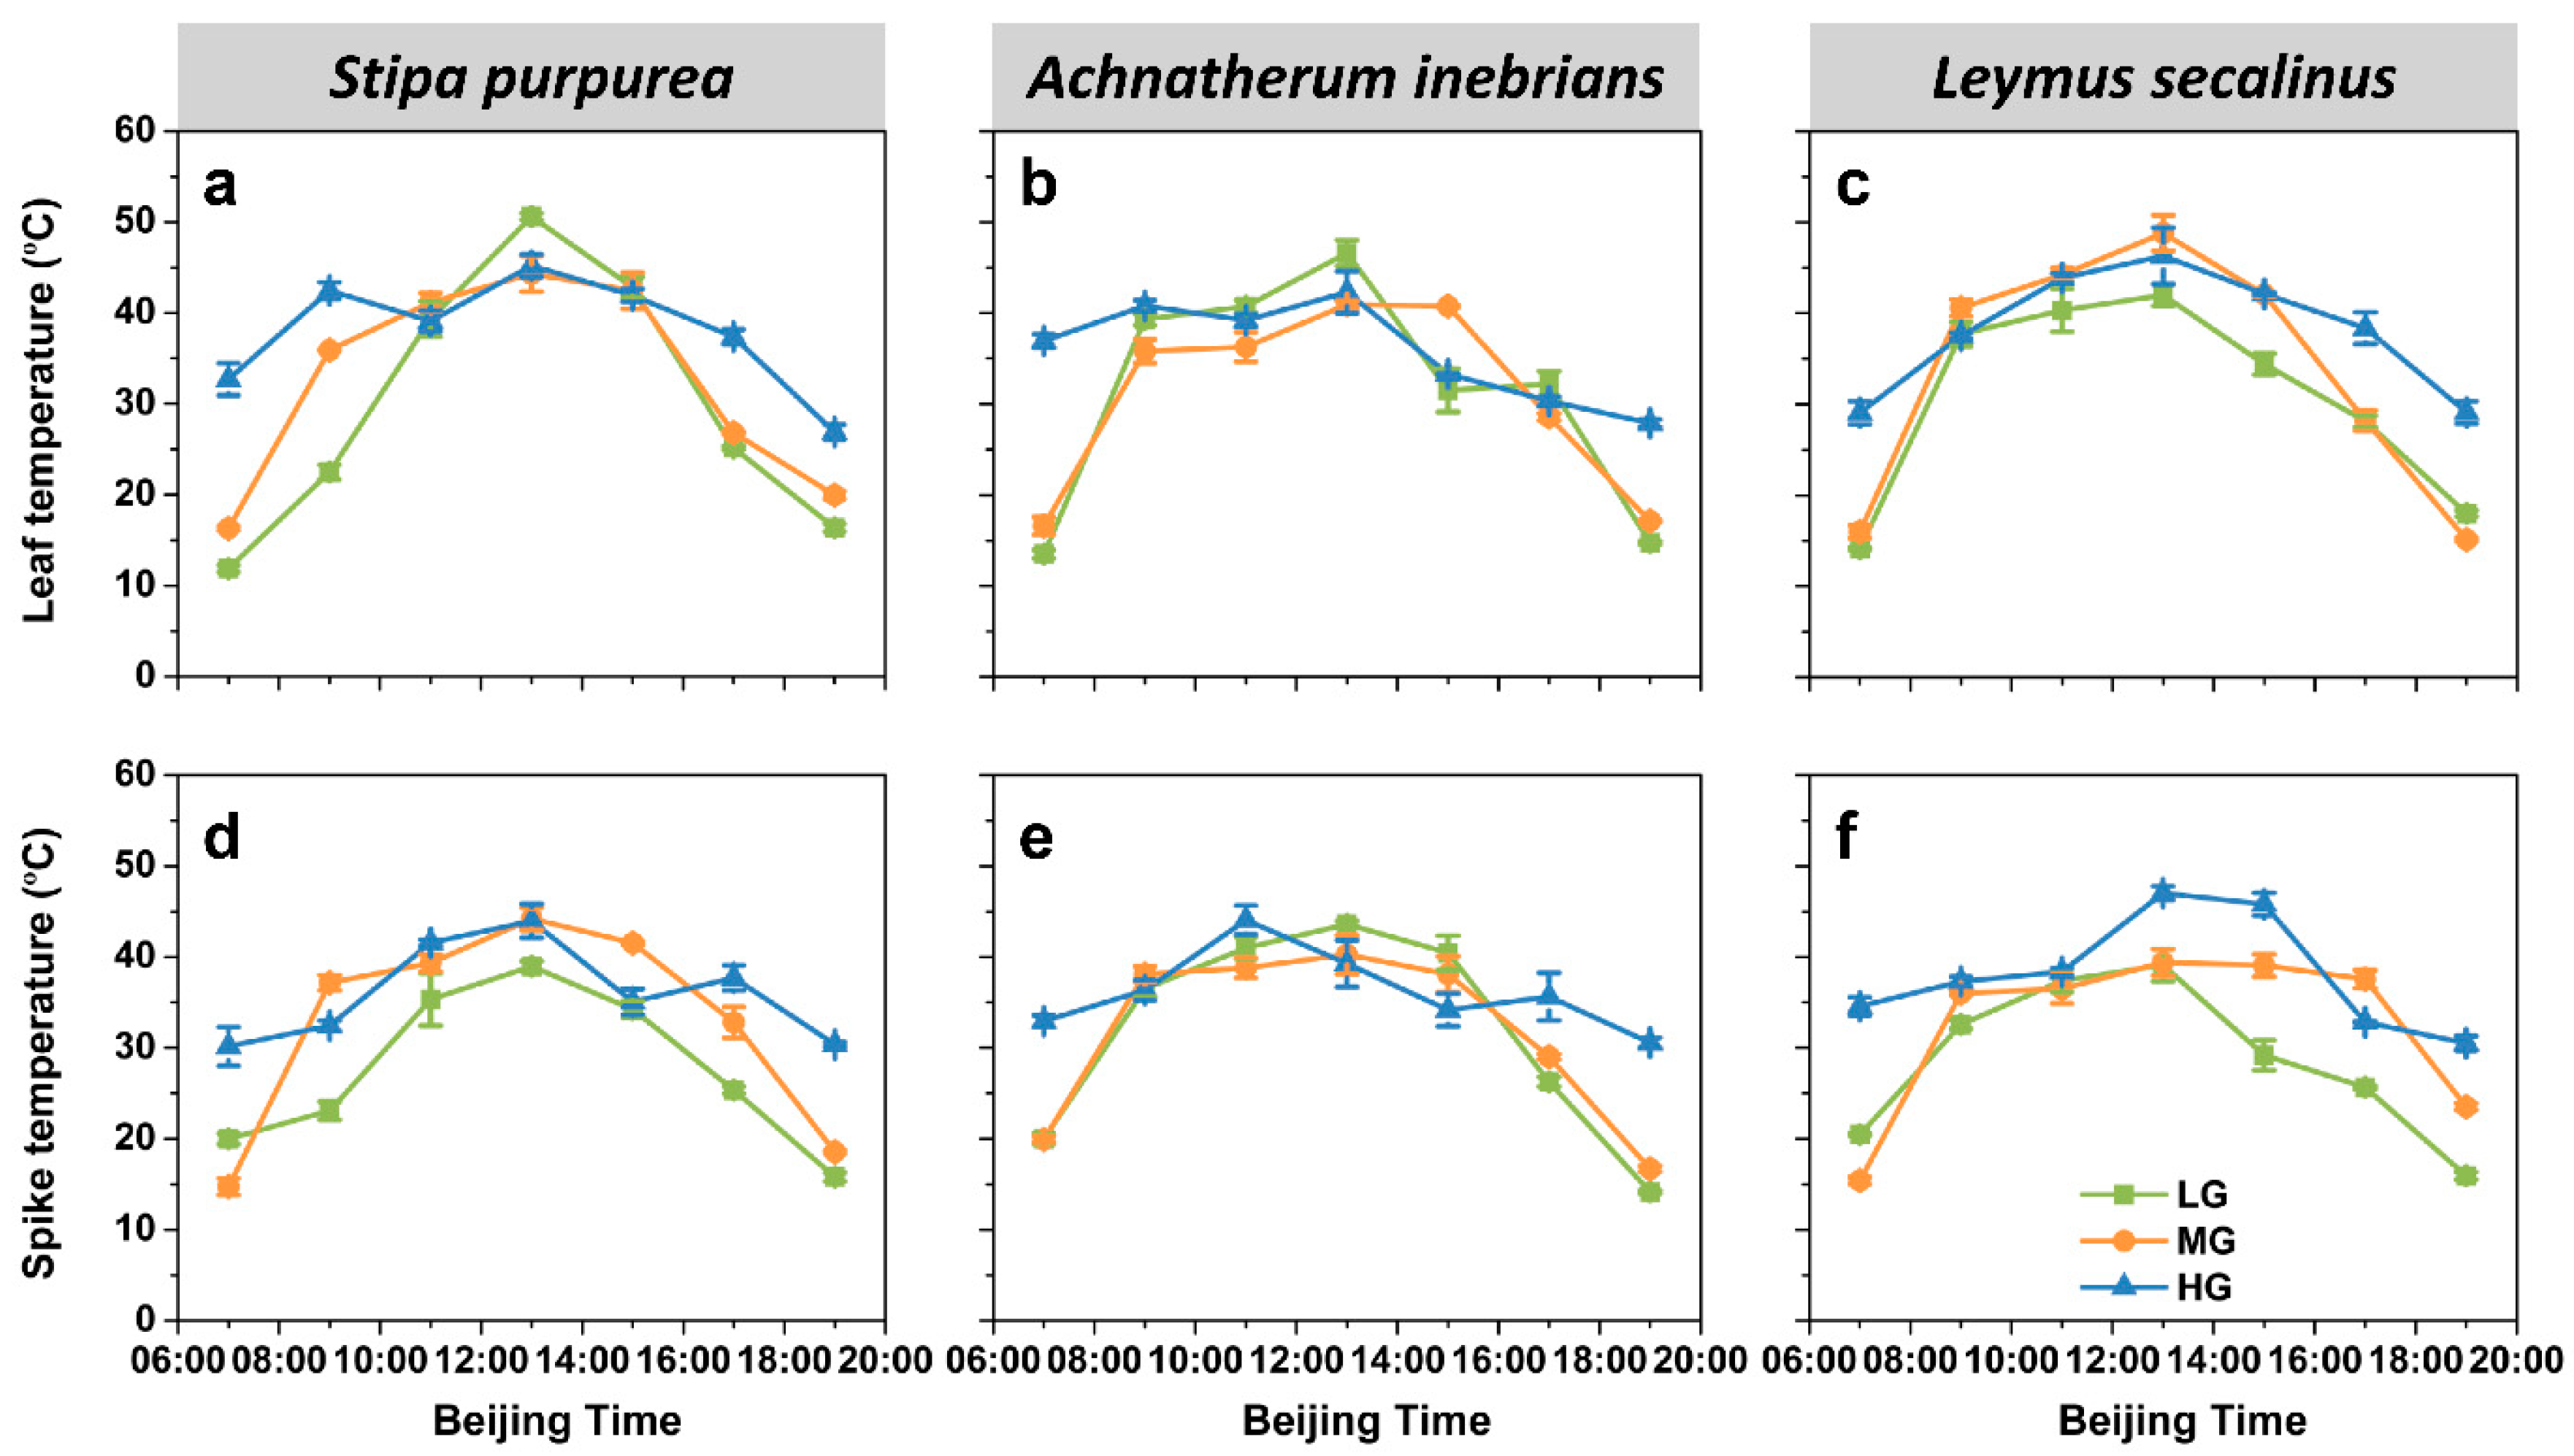
2.2.4. Organ Temperature

The maximum values of both leaf temperature (Tl) and spike temperature (Ts) occurred at approximately 13:00 for all three species (Figure 7). Compared with Tl under HG ranged from 26.9 to 46.9 °C, Tl under LG and MG varied widely within the range of 11.5–51.3 °C. The trend of Ts was similar for each species, similar to the case for Tl. Ts under LG and MG varied from 14.2 to 44.2 °C, while that under HG varied only from 30.2 to 47.0 °C.
ANOVA revealed that the effects of species and grazing intensity on Tl and Ts were highly significant (p ≤ 0.01, p ≤ 0.001) (Figure 3d and Figure 4d). The daily mean value of both Tl and Ts of S. purpurea was the lowest under LG, was significantly greater under MG and was much greater under HG. In addition, there were similar trends in both Tl and Ts of L. secalinus. In addition, the daily mean values of both Tl and Ts of A. inebrians were significantly greater under HG than those under MG but there were no significant differences in both Tl and Ts between MG and LG. The mean values of Tl and Ts significantly increased as grazing intensity increased. Additionally, the mean Tl in A. inebrians was not significantly different from that in S. purpurea but was significantly lower than that in L. secalinus (p ≤ 0.05). However, the mean Ts in S. purpurea was significantly lower (p ≤ 0.05) than that in A. inebrians and in L. secalinus.

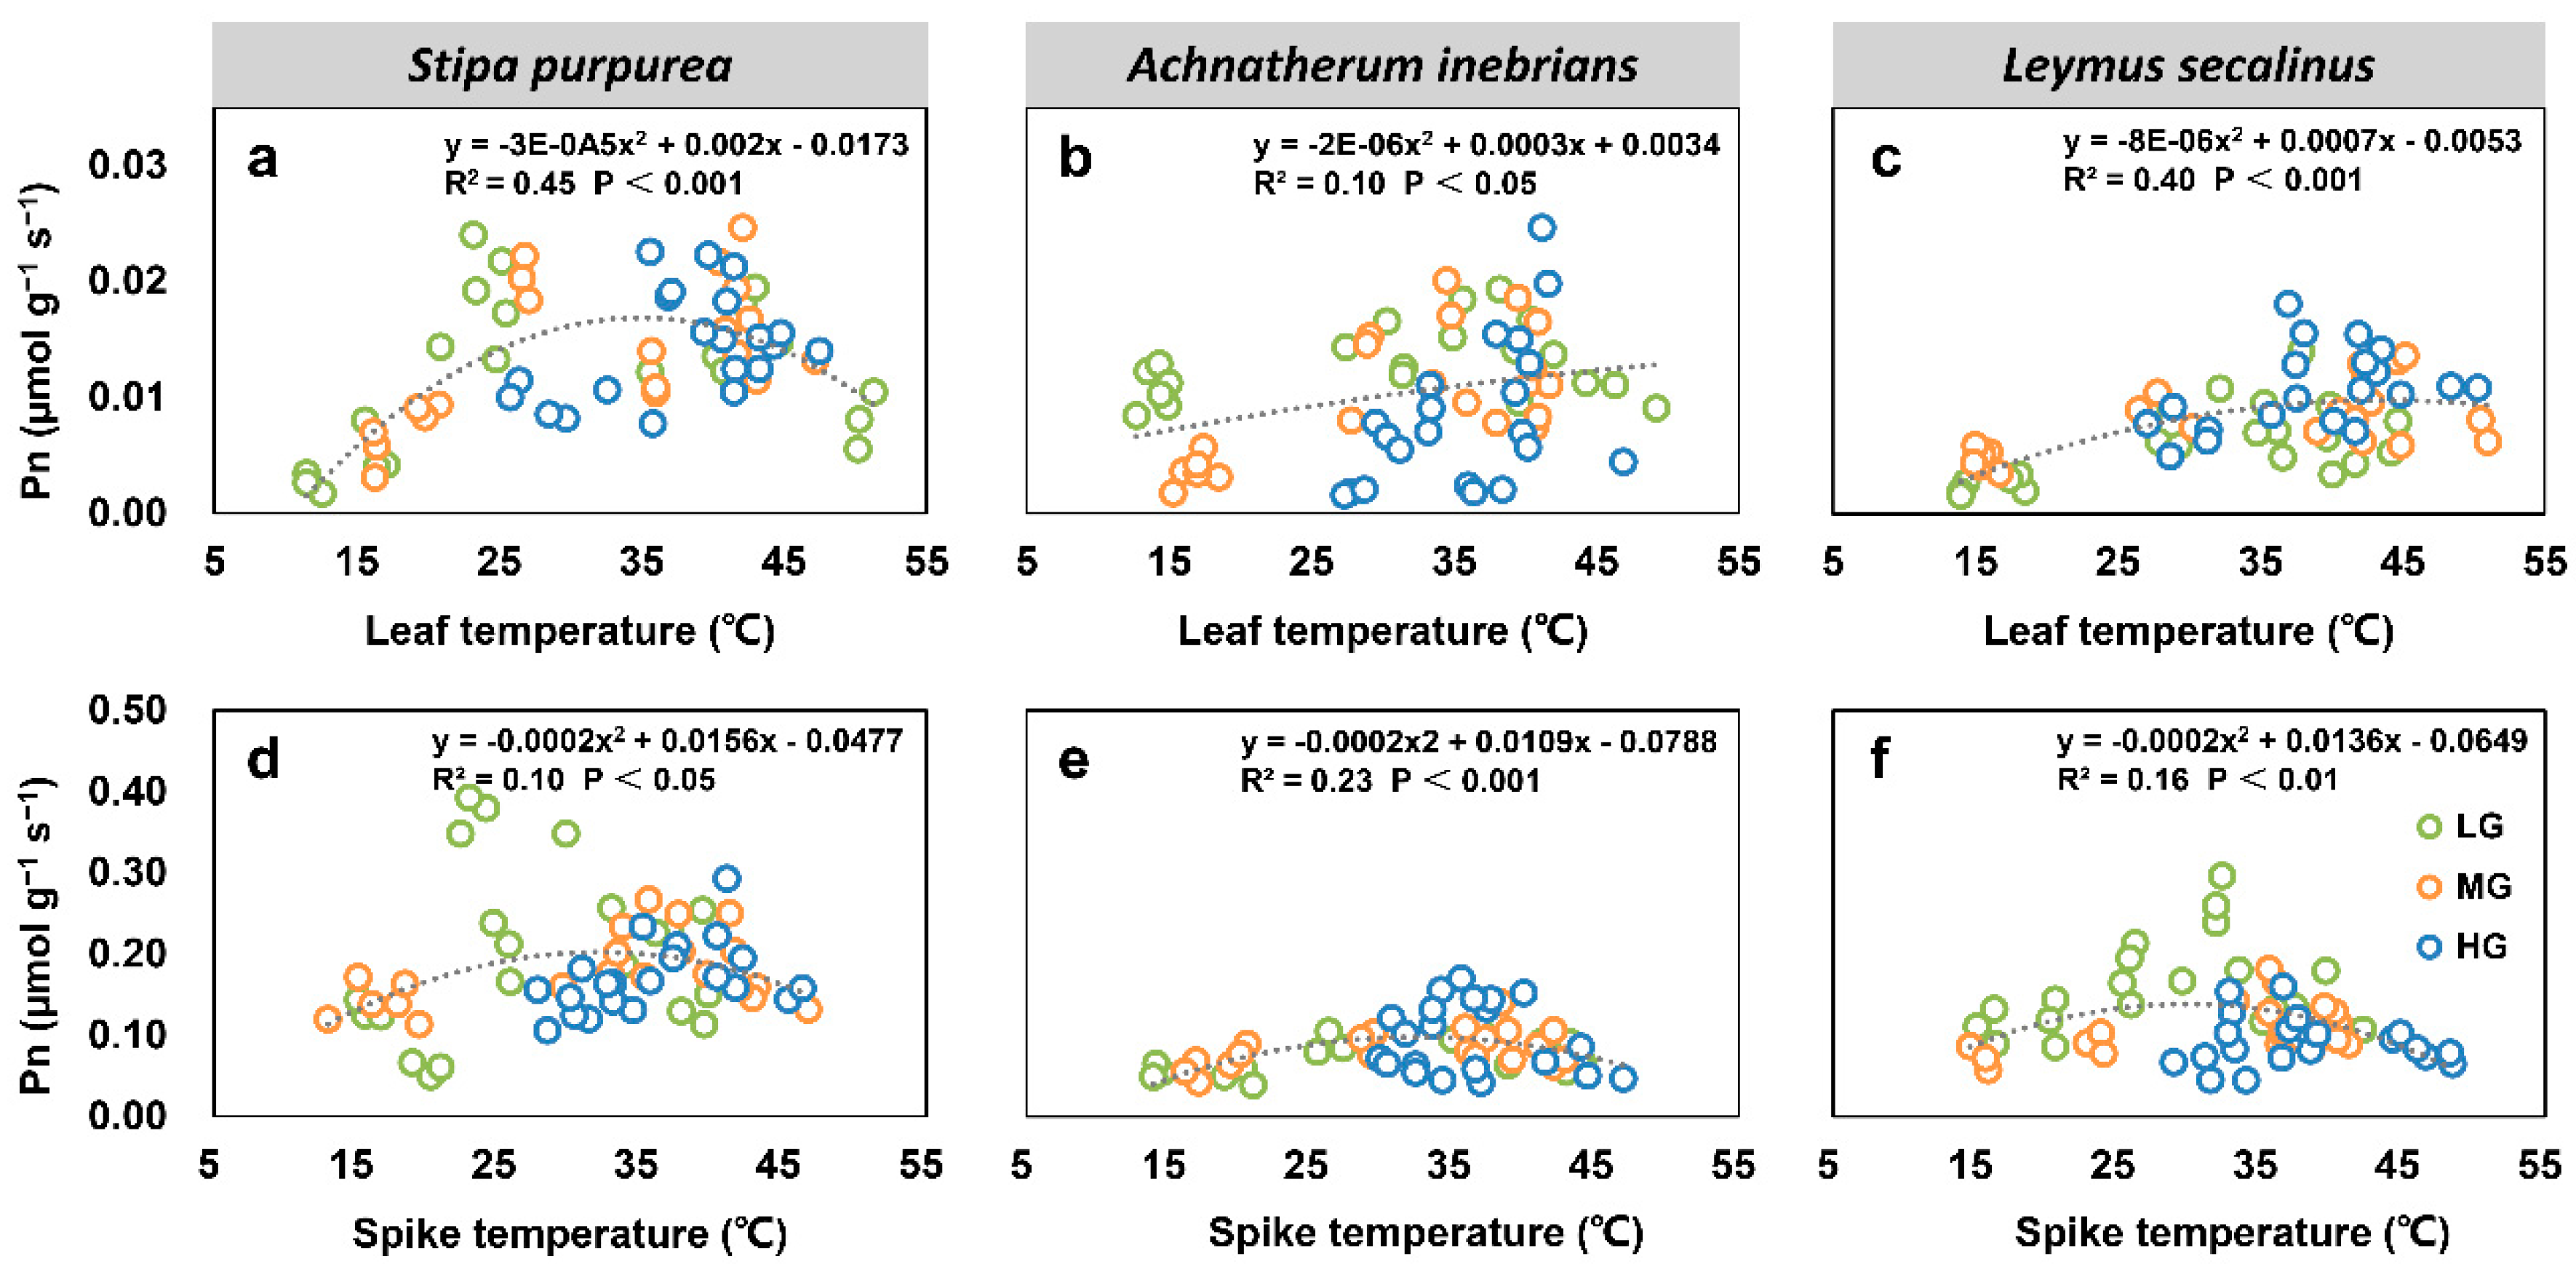
2.2.5. Correlations between Net Photosynthetic Rate, Transpiration Rate, Water Use Efficiency, and Organ Temperature under Grazing Intensity

There were significant correlations between most leaf and spike photosynthesis parameters and the organ temperatures of S. purpurea (a, d), A. inebrians (b, e) and L. secalinus (c, f) under grazing intensity. The leaf Pn and spike Pn of three grass species under grazing intensity showed quadratic relationships with the leaf temperature and spike temperature (p < 0.05) (Figure 8). Similarly, the relationships between leaf and spike Tr and organ temperatures were significant for each species (p < 0.001) (Figure 9). Furthermore, leaf WUE and spike WUE of three grass species under grazing intensity also showed quadratic relationships with leaf temperature and spike temperature (p < 0.05); however, leaf WUE in A. inebrians had no correlation with the leaf temperature (Figure 10).

2.3. Chlorophyll Content

2.3.1. Chlorophyll a, Chlorophyll b and Total Chlorophyll

ANOVA revealed that the effects of species and grazing intensity on the chlorophyll a (Chl a), chlorophyll b (Chl b), and total chlorophyll (TC) contents were significant (p ≤ 0.05 or p ≤ 0.001) in both the leaves and spikes (Table 1 and Table 2). Compared with those under HG, the Chl a, Chl b and TC contents in the leaves of S. purpurea were significantly lower under LG and MG. In contrast, the Chl a and TC contents in the leaves of A. inebrians were significantly lower under HG than those under LG and MG. Additionally, no significant differences were detected in the leaf Chl b content of A. inebrians among the three grazing intensities. Similarly, there were no significant differences in the leaf Chl a and Chl b contents under LG, MG and HG in L. secalinus. However, the TC content in the leaves of L. secalinus under MG was not significantly different from that under LG but was significantly lower than that under HG. Compared with that under LG, the mean Chl a content in the leaves under MG and HG was significantly lower. Furthermore, there were no significant differences in the mean Chl b and TC contents in the leaves under LG, MG and HG. On the other hand, the mean Chl a, Chl b and TC contents in the leaves were the greatest in A. inebrians, were significantly lower in S. purpurea and were much lower in L. secalinus.
The Chl b and TC contents in the spikes of S. purpurea under MG were not significantly different from those under HG but were significantly lower than those under LG (Table 2). Furthermore, the Chl b content in the spikes of A. inebrians significantly decreased with increasing grazing intensity. There were similar trends in the TC content in the spikes of A. inebrians, but none of the differences between LG and MG were significant. Moreover, there were no significant differences in the Chl a content in the spikes of either S. purpurea or A. inebrians among the three grazing intensities. The Chl a, Chl b and TC contents in the spikes of L. secalinus under MG were not significantly different from that under HG but lower than that under LG. In addition, compared with those under LG, the mean Chl a, Chl b and TC contents in the spikes were significantly lower under MG and HG. On the other hand, the mean Chl a and TC contents in the spikes were the greatest in S. purpurea, were significantly lower in A. inebrians and were much lower in L. secalinus. However, the mean Chl b content in A. inebrians was not significantly different from that in S. purpurea but greater than that in L. secalinus.

2.3.2. Total Carotenoid Content, the chl a/chl b Ratio and TC/Total Carotenoid Ratio

The ANOVA results showed that the effects of species and grazing intensity on the total carotenoid (Car) content, chl a/chl b ratio (Chl a/b), and TC/Car ratio (TC/Car) were highly significant in both the leaves and spikes (p ≤ 0.05 or p ≤ 0.001), with the exception that they were not significant for the Car content and the Chl a/b in the spikes (Table 1 and Table 2). The Car content in the leaves of S. purpurea and A. inebrians significantly decreased as grazing intensity increased. There was a similar trend in the leaf Car content for L. secalinus but none of the differences were significant. Conversely, the Chl a/b in the leaves of L. secalinus significantly decreased with increasing grazing intensity, but no significant differences were detected in the leaf Chl a/b in either S. purpurea or A. inebrians under LG, MG and HG. In addition, the TC/Car in the leaves was markedly lower under LG and MG than under HG in both S. purpurea and L. secalinus, whereas grazing intensity had no effect on the TC/Car in A. inebrians. The mean Car content in the leaves significantly decreased as grazing intensity increased. There were similar trends in the mean Chl a/b in the leaves but none of the difference was significant between LG and MG. Conversely, the mean TC/Car in the leaves under MG was not significantly different from that under LG but lower than that under HG. Additionally, the mean Car content in the leaves was the greatest in A. inebrians, while that was the lowest in L. secalinus. In contrast, the mean TC/Car in the leaves was the lowest in A. inebrians, whereas that was the greatest in L. secalinus. Furthermore, the mean Chl a/b in the leaves of A. inebrians was not significantly different from that of S. purpurea but was lower than that of L. secalinus.
The Car content in the spikes of S. purpurea significantly increased with increasing grazing intensity (Table 2). Although the Car content in the spikes of L. secalinus followed the same trend, none of the differences were significant. Conversely, the Car content in the spikes of A. inebrians significantly decreased as grazing intensity increased. The Chl a/b in the spikes was the greatest under MG, was lower under HG and was much lower under LG in both S. purpurea and L. secalinus. However, the Chl a/b in the spikes of A. inebrians significantly increased with increasing grazing intensity. The TC/Car in the spikes under MG was not significantly different from that under HG but was significantly lower than that under LG in both S. purpurea and L. secalinus. However, the TC/Car in the spikes of A. inebrians significantly increased with increasing grazing intensity. Compared with those under LG, the mean Chl a/b in the spikes were greater under MG and HG. Conversely, the mean TC/Car in the spikes under MG and HG was lower than that under LG. In addition, there was no significant difference in the mean Car content in the spikes under LG, MG and HG. The mean Car content in the spikes of S. purpurea was significantly greater than that of A. inebrians and L. secalinus. Furthermore, the mean TC/Car in the spikes of A. inebrians was greater than that of S. purpurea and L. secalinus. However, no significant differences in the mean Chl a/b in the spikes were detected among any of the three species.

3. Discussion

3.1. Effect of Grazing Intensity on Photosynthesis Parameters

Photosynthesis is the most fundamental and intricate physiological process in all green plants [3]. Diurnal dynamic patterns in photosynthesis parameters can indicate the ability of plants to maintain internal balance while responding to changes in environmental conditions [30,31]. In this study, the dual-peak diurnal pattern of leaf and spike Pn on sunny days might be due to photoinhibition under high-PAR conditions [32]. The decrease in Pn after the first peak might have resulted from an increase in PAR that simultaneously escalated the Ta, Tl and Ts [33]. In addition, as a self-regulatory ecological adaptation of plants, the midday depression of Pn may be the result of photoinhibition; midday depression has often been attributed to relatively high irradiance, high temperature, and low RH [31,33]. The unimodal diurnal patterns of the Tr, PAR, and Ta suggest that plants may self-adjust and deploy a protective mechanism to avoid the damage caused by strong PAR and high temperature [34]. Furthermore, the trends of the Tl and Ts patterns were the same as those of the Tr patterns, demonstrating that each species reacted via stomatal opening (consequently increasing the Tr) to reduce the amount of damage to their leaves and spikes caused by high Tl and Ts, which increased sharply because of high PAR.
With respect to the daily mean values of the leaf Pn, S. purpurea and L. secalinus presented consistent significant increases with grazing intensity (Figure 3a). The increase in the Pn at the leaf-level may be attributed to recovery from grazing-induced damage or from the increased production of energy for regrowth, namely, compensatory photosynthesis [35,36,37,38]. Compensatory photosynthesis is defined as an essential mechanism not only for plant leaf regrowth but also for plant tolerance to herbivores [8,35,36,39]. Hence, this increase resulted from a decrease in leaf area due to livestock feeding, which suggests that both species could promote the accumulation of assimilates, could improve grazing tolerance, and photosynthesized at a sufficient level to maintain the Pn under certain grazing intensities. Our results were consistent with those of other studies [8,10,38]. Interestingly, changes in physiological capacity of plant with increased grazing intensity can vary substantially among different rangeland ecosystems, and may be related to site- and species-specific features [40].
A. inebrians, commonly referred to as drunken horse grass, is a common toxic perennial grass species related to the narcosis of livestock that graze on grasslands in Northwest China [41,42]. Livestock that were fed or grazed on A. inebrians exhibited symptoms of intoxication [41,43]. The leaves of A. inebrians were typically older because grazing animals preferred S. purpurea and L. secalinus over A. inebrians when herbage was highly available. However, in the case of MG and HG, the leaf area of the old photosynthesizing leaves and the Pn decreased because of foraging or trampling by livestock. This offered a good explanation for why the daily mean values of the leaf Pn of A. inebrians decreased with increasing grazing intensity. Grazing-induced variation in plant composition will be critical for predicting the secondary production robustness estimates in semi-arid grassland area [44].
Transpiration plays a key role in the energy and water balance of land surface [45]. With increasing grazing intensity, the increases in the daily mean values of the leaf Tr of S. purpurea and L. secalinus was associated with the increase in the daily mean values of the Tl. As a passive outcome of energy balance over plant body parts, Tl directly influences plant metabolic activities and energy management [46,47]. However, a Tl exceeding the optimum inhibits the enzymatic activity and chemical metabolism of cells, thus affecting gas exchange and photosynthesis in plants [48,49]. In this study, grazing can reduce grassland vegetation coverage and thus increasing the Ta and solar radiation in plant microhabitats, consequently leading to an increase in Tl [50,51]. Additionally, previous studies demonstrated that transpiration can substantially lower the Tl via evaporation of water from the leaf surface [52]. According to Urban et al. (2017) [53], evaporative cooling of transpiring leaves led to reductions in Tl of up to 9 °C in well-watered poplar but only 1 °C in drought-stressed poplar and loblolly pine. There was no significant difference in the daily mean values of leaf WUE of both S. purpurea and L. secalinus, showing that there were sufficient available water resources for plants in the environment. Therefore, the increase in the leaf Tr could effectively lower the corresponding Tl in an attempt to avoid heat damage attributed to high temperature. It has also been documented that both the Pn and Tr increased in the absence of water stress [54]. That is the reason why the leaf Pn and Tr of S. purpurea and L. secalinus increased with increasing grazing intensity.
Unlike that which occurred for S. purpurea and L. secalinus, the daily mean values of the leaf Pn and leaf Tr of A. inebrians significantly decreased as grazing intensity increased, and the leaf WUE followed the same trend for the same species, indicating that A. inebrians was subjected to water stress caused by grazing intensity. However, the Tl of A. inebrians increased with increasing grazing intensity. Our findings were in agreement with the results of prior studies showing that water stress reduced the Pn and Tr; in turn, the reduced Tr increased the Tl [54,55,56].
In addition to foraging, livestock trampling can directly impose strong mechanical stress on plants, resulting in physical damage to the leaves, shoots, stems, and roots [57,58,59]. Compared with the leaves, the spikes for each species were located at the top of the reproductive branches of the stems. In the absence of trampling, owing to their distinct spatial location, spikes are favored for the interception and capture of light and CO2. However, deer injure stems and roots by trampling them, causing abrasion and bending under light trampling and distortion, chlorosis, stunting, and even breakage and rupture under heavy trampling, consequently preventing the plants from transporting water and nutrients from the roots to the spikes [6,57,60]. Hence, the greater the grazing intensity was, the more severe the damage to the stems. Additionally, studies have showed that the trampled plants produced new leaves in a short time following trampling [57,58]. Hence, a portion of the water and nutrients transported from the roots should also be supplied to new lower-canopy leaves for compensatory growth, which in turn attracts livestock to forage once again and thus resulting in repeated trampling on vegetation. Aside from including chloroplasts necessary for photosynthesis in any plant, the photosynthetic tissues of spike also include stomata through which CO2 is be taken up by plants [3,61]. However, stomata are present only in the green parts of spikes and are distributed mainly in the glumes, awns, and lemmata [15,19,62]. Trampling-induced damage to the integrity of chloroplast structure and function reduces the spike photosynthetic area as well as spike photosynthesis [6]. Therefore, the daily mean values of the spike Pn of S. purpurea and L. secalinus significantly decreased with increasing grazing intensity. Owing to its toxicity, A. inebrians was typically not foraged by deer, thus avoiding or reducing the amount of injury caused by trampling, and accordingly, there was no significant difference in spike Pn.
Similar to that which occurred for the Tl, the Ts for each species markedly increased with increasing grazing intensity as a result of the reduction in grassland vegetation coverage caused by grazing. As mentioned above with respect to leaf Tr, the increase in the daily mean values of the spike Tr in S. purpurea could lower the Ts to reduce the impact of heat injury on the Pn. However, there was no significant difference in the daily mean values of the spike Tr in L. secalinus. The reason may be associated with differences in tiller type of the two graminoids. S. purpurea is a dense clump grass with tiller nodes located on the soil surface, resulting in the formation of dense clumps. However, as a typical perennial rhizomatous grass species, L. secalinus has a guerrilla growth form and is one of the plants from long rhizomes with the strongest propagation ability [63,64]. L. secalinus typically has only one main rhizome that is very deep, located below 15–32 cm underground [65,66]. Therefore, water absorbed by the main rhizome of L. secalinus from deep underground supplements the increased water consumption due to the increase in the spike Tr, helping to lower the Ts and thus maintaining normal physiological activity.
Deer mainly foraged and trampled the palatable S. purpurea and L. secalinus following grazing, eliminating the competition between A. inebrians and the other two species, which somewhat reduced damage to the vegetation coverage in A. inebrians due to trampling. Only under HG did vegetation coverage of A. inebrians decrease significantly. This could be confirmed by the daily mean value of the Ts of A. inebrians under HG being markedly greater than that under LG and MG, while no significant difference was detected between LG and MG. This may explain why there was no significant difference in the spike Tr in A. inebrians.
Our results showed that the daily mean values of the spike WUE of both S. purpurea and L. secalinus significantly decreased with increasing grazing intensity. In addition, reductions in the WUE were related to changes in the Pn and Tr because it was affected by the coupling of photosynthesis and transpiration, which was regulated by the stomata [67,68]. On the other hand, reductions in the WUE indicated a decrease in the amount of biomass produced per unit volume of water consumed, as well as a reduction in the efficiency of water resource use by plants [69,70]. There was no significant difference in either the spike Pn or spike Tr of A. inebrians, leading to no significant differences in spike WUE.
With respect to species differences, ANOVA revealed that leaf and spike Pn of S. purpurea was the greatest among the three species, suggesting that S. purpurea performed the best in terms of synthesizing organic compounds (Figure 3a and Figure 4a). Similarly, leaf and spike Tr of S. purpurea was greater than that of the other two species, which means that S. purpurea consumed the greatest amount of water. However, a high Tr can reduce the increase in Tl and Ts at relatively high atmospheric temperatures in the environment, thus maintaining the optimal Tl and Ts to accelerate the production of photosynthates. No significant difference in leaf WUE was detected between S. purpurea and the other two species, indicating that the biomass produced per unit of water consumed for S. purpurea was not lower than that for A. inebrians and L. secalinus. High water consumption did not reduce the efficiency of the use of water resources in the environment by the leaves. However, the spike WUE of S. purpurea was significantly greater than that of the other two species, showing that S. purpurea assimilated the greatest amount CO2 while consuming the same amount of water, thus using water more efficiently. There was no significant difference in the Tl between S. purpurea and the other two species, but the Ts in S. purpurea was significantly lower than that in the other two species. It was concluded that under the same grazing intensity, S. purpurea could maintain a lower photosynthetic organ temperature and have the same or even stronger ability to regulate the temperature of its photosynthetic organs, which is important for maintaining the normal physiological function of photosynthetic organs.

3.2. Effect of Grazing Intensity on Photosynthetic Pigments

As the main photosynthetic pigment in chloroplasts as well as an essential biochemical component, chlorophyll is intimately involved in light harvesting, energy transfer and light energy conversion in photosynthesis [3,71]. Changes in chlorophyll content have critical consequences for estimating nutrient content in grasslands and understanding livestock feeding patterns and distribution [72,73]. There are two major varieties of chlorophyll, Chl a and Chl b, and the contents of them are vital indicators of plant photosynthetic capacity and health status [71,74]. There is considerable evidence indicating that plants exposed to adverse conditions present reduced contents of important photosynthetic pigments, particularly chlorophyll [54,75]. The stress-induced alterations in leaf chlorophyll content can be attributed to either impairment of pigment biosynthesis pathways or acceleration of pigment degradation [76,77,78]. The Chl a, Chl b and TC contents in the leaves of S. purpurea were significantly higher under HG than those under LG and MG, suggesting that the leaves presented improved photosynthetic efficiency by increasing the amount of photosystem components [79,80]. In addition, the increase in the chlorophyll content under HG could increase the photosynthetic potential to prepare the physiology for normal growth, which may be a physiological adaptation of this species to relatively severe grazing stress. Both the Chl a and Chl b contents in the leaves of L. secalinus did not differ significantly with increasing grazing intensity, indicating that they were not sensitive to grazing disturbance. However, the TC content in the leaves of L. secalinus under HG was significantly greater than that under MG, which suggests that grazing stimulated TC synthesis. Additionally, a marked reduction in the Chl a and TC contents in the leaves of A. inebrians could be a result of either inhibition of chlorophyll biosynthesis or acceleration of chlorophyll degradation [3,81]. This is in agreement with the results of a previous study [6].
The acclimation of the photosynthetic apparatus in higher plants is vital for optimizing the photosynthetic system under continuously changing environmental conditions, manifested by altering the structure, function, composition of photosystem II and its antenna size and by regulating the photosystem II: photosystem I ratio [82,83,84,85]. Thus, the Chl a/b related to antenna size could be an indicator of the degree of sun/shade acclimation and the structure of the photosynthetic apparatus, and its response to various stressors emphasizes the vital role of antenna size regulation in plant acclimation [79,84]. There was noticeable insignificance in the leaf Chl a/b of both S. purpurea and A. inebrians. This means that regulation of antenna size was not necessary, likely because of their acclimation to grazing stress. However, the decrease in the leaf Chl a/b of L. secalinus suggests that the antennas size of the photosystems was relatively large to make optimal use of the low internal light intensity [84,86].
Apart from participating in light harvesting, Car, as a quencher of chlorophyll triplets, singlet oxygen and reactive oxygen species, can protect the photosynthetic system against damage caused by stress, thus playing an essential photoprotective role [79,87]. The reduction in the Car contents in the leaves of both S. purpurea and A. inebrians was a response of grazing-induced stress that may lead to impairments of either photosynthetic activity or the protection mechanism for the photosynthetic system. However, the Car contents in the leaves of L. secalinus remained unchanged means that it was not impaired by grazing stress [81]. TC/Car, which is a good indicator of plant stress detection and tolerance, is sensitive to photooxidative damage [88,89]. A pronounced increase in the leaf TC/Car in both S. purpurea and L. secalinus was evident with an increase in grazing intensity, while no significance was detected in A. inebrians, indicating that S. purpurea and L. secalinus experience a lower intensity of oxidative stress than A. inebrians does with increasing environmental stress [90].
Low temperature and high UV-B radiation in high-mountain habitats induce photoinhibition [91]. The increase in PAR is the result of the decrease in the vegetation coverage caused by grazing. Moreover, compared with leaves, spikes contribute more to light interception because of their distinct spatial position. Thus, excessive absorbed light energy usually results in more photoinhibition of chloroplasts in the spikes than in the leaves [91,92]. Previous studies have shown that both low temperature and high UV-B radiation led to a decrease in the levels of Chl a and Chl b through chloroplast damage or disrupt chlorophyll biosynthesis [93,94]. Furthermore, Chl b is more sensitive to low temperature and high UV-B radiation than Chl a is [95,96]. This may explain why no significant variation was detected in the Chl a content in the spikes of either S. purpurea or A. inebrians in our study, while the Chl b contents in the spikes significantly decreased with increasing grazing intensity, thereby resulting in a decrease in the TC contents in the spikes of both species. Chl a and Chl b contents indicate a plant’s photosynthetic capability and health [74]. Photoinhibition can be divided into two processes: photodamage and the repair process [97]. The Chl a, Chl b, and TC contents in the spikes of L. secalinus were lower under MG than LG, suggesting that this decrease may be due to the impairment in spike chloroplasts induced by low temperature and increased UV-B exposure following grazing. However, these indicators under MG were lower than those under HG. This means that L. secalinus has the ability to restore its chlorophyll content rapidly, which not only could help maintain a certain amount of photosynthetic pigment but also could weaken the effects of grazing on spike photosynthesis.
Chl b is the main component of LHCII, acting as an antenna complex by transferring light energy to the reaction center of PSII [98]. In this study, an increased Chl a/b in the spikes of the three species is indicative of the preferential degradation of LHCII, which is an essential photoprotective mechanism for the photosystems; this degradation results in an increased proportion of excitation energy transferred to the PSII reaction center and thus decreasing absorption of light energy for ultimately protecting the photosystems and enabling plants to survive under adverse conditions [99,100,101]. In addition, this indicates a decrease in the size of the antenna complex associated with PSII, which reduces PSII excitation within the antenna system and thus preventing the dissipation of wasteful energy via photoprotective mechanisms that are used to relieve PSII excitation [101,102].
As noted above, Cars play an essential role not only in the photosynthesis process but also in the protection of thylakoid membranes against damage to the photosynthetic system induced by excess solar energy absorbed by photosynthetic pigments. The increase in the Car content in the spikes of S. purpurea indicates excitation energy transfer from chlorophyll molecules to Car molecules (i.e., chlorophyll zeaxanthin heterodimers), thus ensuring safe dissipation of excess energy [103,104]. As mentioned above with respect to leaf Cars, the decreased Car content in the spikes of A. inebrians suggests impairment in both photosynthetic activity and protective mechanisms, while that of L. secalinus was not sensitive to grazing stress. Given that the TC/Car can be considered a good indicator for evaluating environmental stress in plants and for evaluating the photosynthetic apparatus, the decreased TC/Car in the spikes of both S. purpurea and L. secalinus indicates an increase in photoprotection as well as protection of the photosynthesis apparatus via improved thermal dissipation of excitation energy, thus increasing antioxidant protection under stress conditions [89,105,106]. However, the increased TC/Car in the spikes of A. inebrians means that oxidative stress increased as grazing intensity increased. Therefore, the increased Chl a/b as well as the decreased TC/Car suggests a better acclimation of S. purpurea and L. secalinus to increasing grazing intensity compared with that of A. inebrians [107]. In addition, shifts in dominant plant communities under moderate grazing intensity may benefit livestock production [108].

4. Materials and Methods

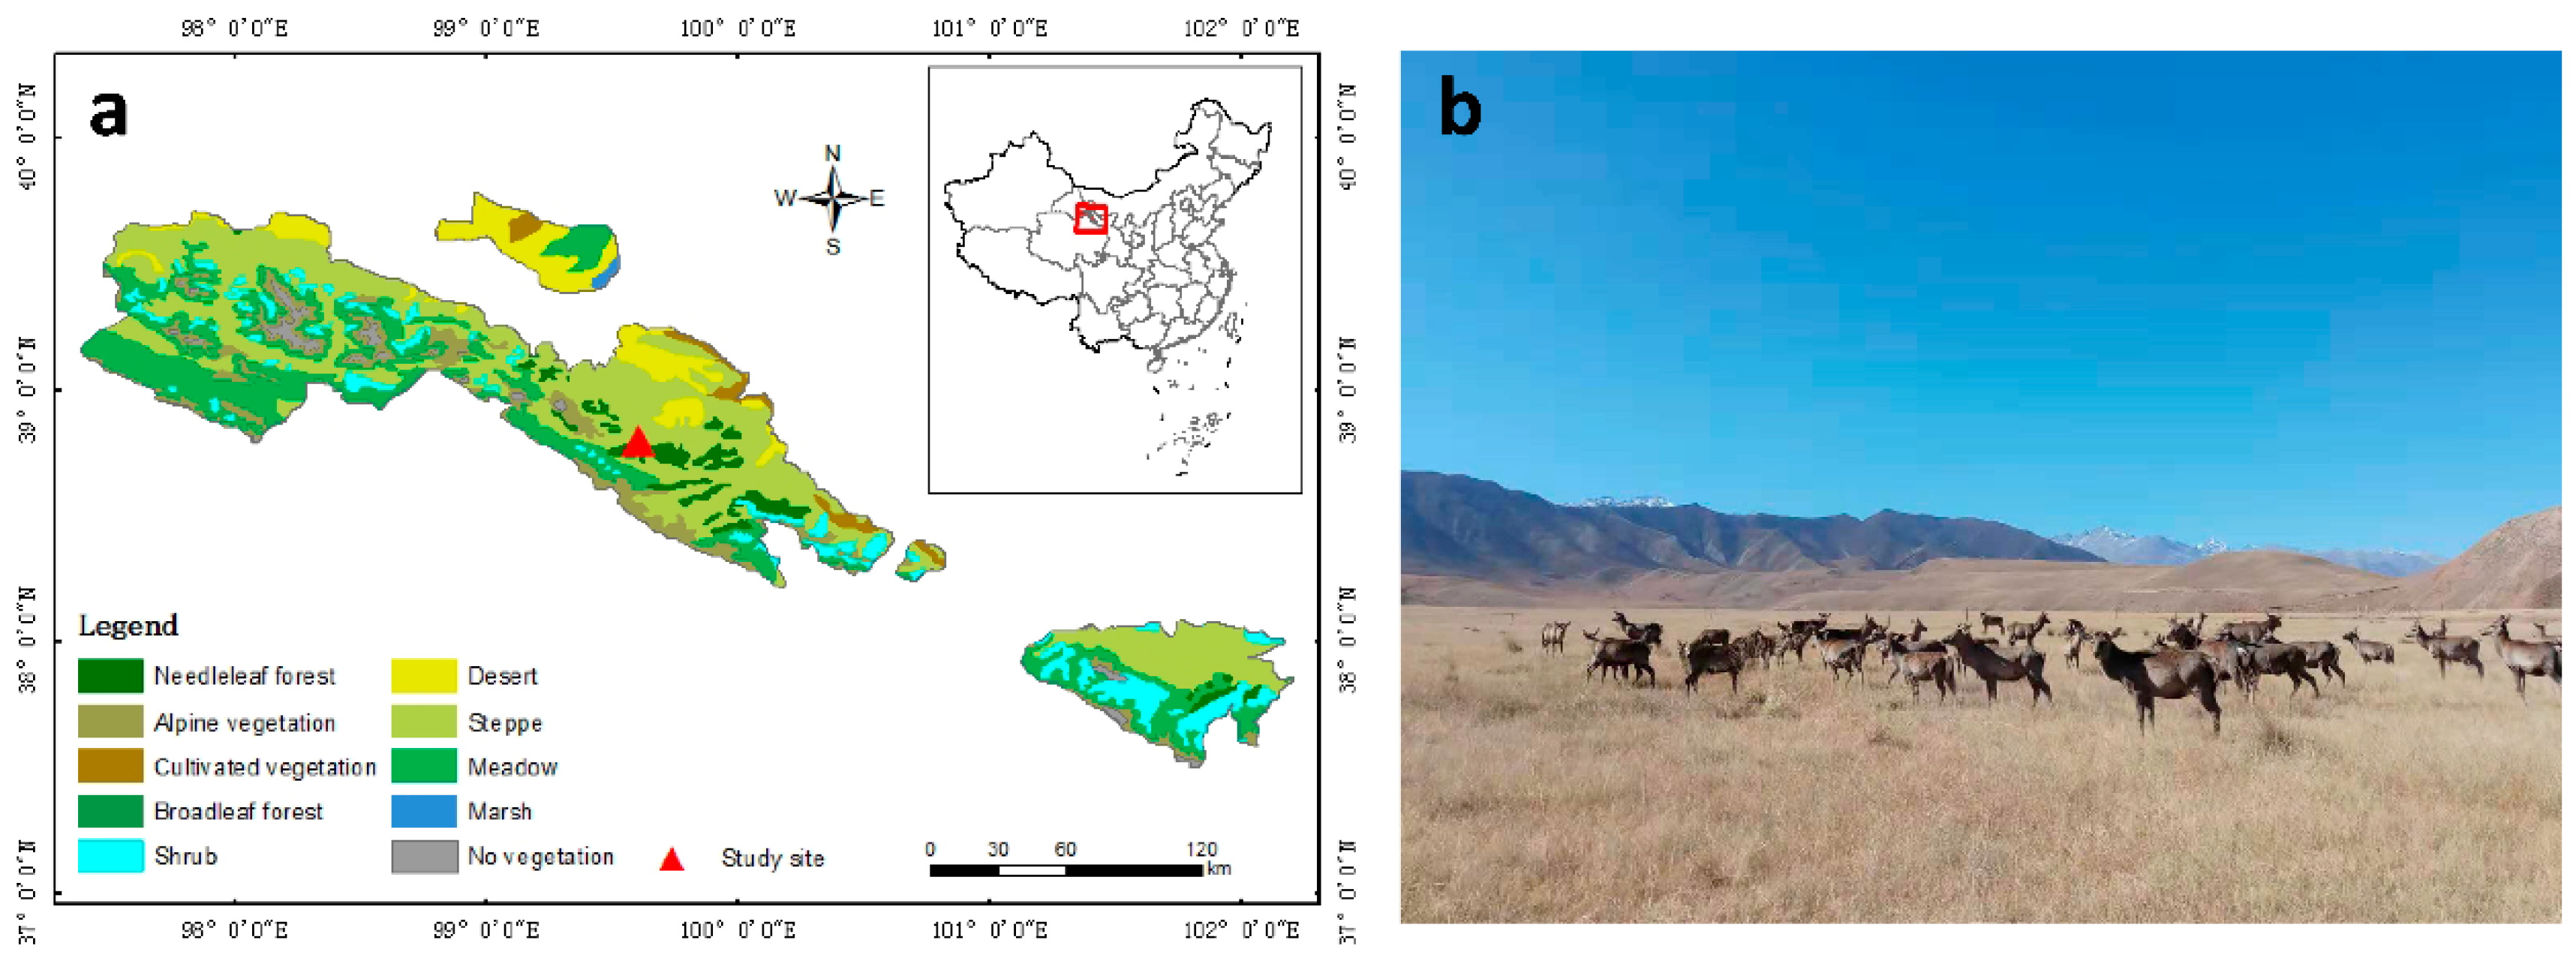
4.1. Study area and Experimental Design

The study was carried out at the Sunan Deer Farm (SDF) (Figure 11a; 38°48′ N, 99°36′ E), which was established in 1958 and is located in Sunan County in Gansu Province, Northwest China. It is the first wild Gansu wapiti (Cervus elaphus kansuensis, hereinafter referred to as deer, Figure 11b) domesticating station, contains the largest artificial breeding group of deer and is one of the largest deer farms under the main management model of grazing in China [109]. The SDF is situated in the middle part in northern slopes of the Qilian Mountains, ranging from 2600 to 3000 m above sea level, and the rangeland was classified by Wu et al. as an “alpine typical steppe” [110]. The study area is characterized as having a plateau-mountain semiarid climate. The mean annual temperature is 3.6 °C, with a mean monthly temperature ranging from −10.4°C (in January) to 15.9 °C (in July), and there are approximately 127 frost-free days y−1 [28,111]. The mean annual precipitation is 260 mm, of which more than 86.4% falls during May–September. The annual pan evaporation rate in the study area is 1785 mm y−1.
The study area was located in a winter grazing pasture, which is open and flat, with an overall slope of < 3° occupying an area of approximately 160 hm2. The main feeding routes of deer were confirmed by a combination of observing the deer grazing behavior and inquiring the deer herders. Moreover, grazing intensity was selected according to the conditions of the vegetation and soil. Ten herds of deer aged 5–6 y with similar body sizes were observed. Livestock herds generally grazed during the daytime (from 6:30–7:00 to 19:30–20:00) and grazed for 12.5–13.5 h daily during the summer; in addition, the herds had a basically fixed activity time and feeding route and were kept in pens overnight. Land close to pens tends to be grazed more often than that far away from the pens. Therefore, the exit and entrance areas of the pasture were subject to the heaviest grazing intensity, and the grazing intensity decreased with increasing distance away from those areas. Thus, the sample plots with the grazing intensity treatments that included 1.45 AUM ha−1 (light grazing, (LG)), 3.45 AUM ha−1 (medium grazing, (MG)), and 6.90 AUM ha−1 (heavy grazing, (HG)), respectively, were established at 1250, 650 and 50 m away from the entrance of the pasture. There were three replicates per treatment, and each plot (100 × 100 m) covered an area of 1 hm2. A. inebrians (Hance) Keng was absolutely dominant within the upper layer grasses in the HG plot, the dominant species within the lower layer was Convolvulus ammanii, and the main associated species was Cares spp. The upper-layer grasses in the MG plot were dominated by L. secalinus, A. inebrians (Hance) Keng, S. purpurea, and Agropyron cristatum (L.) Gaertn. Furthermore, A. inebrians (Hance) Keng and S. purpurea were also dominant within the upper layer in the LG plot. The dominant species within the lower layer was Artemisia frigida in both the MG and LG plots. The soil type was mountain chestnut soil. The SDF is the experimental base of Lanzhou University. The animal management were in accordance with the rules and regulations of experimental field management protocols (file No: 2010-1 and 2010-2), which were approved by Lanzhou University.

4.2. Photosynthesis Parameters and Photosynthetic Pigments

At the center of the plot, we randomly threw the quadrat and then sampled where the quadrat fell. We randomly established three quadrats (1 × 1 m) within each plot. We randomly selected at least 3 individuals of similar plant height and age for each species in each quadrat and measured the environmental and photosynthesis parameters of the leaves and spikes via a portable photosynthesis system (CI-301PS; CID Inc., Vancouver, WA, USA). Measurements were made between 7:00 and 19:00 at 2 h intervals on cloud-free, sunny days during the last two weeks or so of July 1999. Healthy and mature third leaf and spikes at the top of the stems were retained in their natural position during the measurements. The photosynthesis parameters included the net photosynthetic rate (Pn), transpiration rate (Tr), water use efficiency (WUE), and organ temperature (leaf and spike temperature, Tl and Ts); the WUE was derived as the ratio of the Pn to the Tr (Pn/Tr) according to the methods of Stępień and Kłobus [112]. Environmental parameters including the photosynthetically active radiation (PAR), air temperature (Ta), and air relative humidity (RH) were also measured. In addition, the photosynthetically active radiation sensor is a filtered GaAsP photodiode. The leaf chamber air temperature sensor is a Type K thermocouple. The air relative humidity sensor is a capacitive sensor along with a LM35DH temperature sensor.
The chlorophyll and carotenoid (Car) contents were determined after the leaves were ground in acetone (three samples, 1.5 g of leaf and spike fresh mass each per sample). The homogenate was centrifuged via a Nüve Füj 650 model centrifuge. The supernatant was separated, and the absorbances were measured via a Shimadzu UV-260 spectrophotometer to determine the chlorophyll a (Chl a), chlorophyll b (Chl b), total chlorophyll (TC), and Car contents, respectively. The Chl a, Chl b, and TC contents were calculated according to the methods of Inskeep and Bloom [113], and the Car content was calculated according to the methods of Lichtenthaler [114]. Chl a/Chl b ratio (Chl a/b) and TC/total Car ratio (TC/Car) were subsequently calculated.

4.3. Data and Statistical Analysis

The data were presented as mean ± standard error (SE). A two-way ANOVA was used to assess the effects of species, grazing intensity and their interaction on photosynthesis parameters and photosynthetic pigments of leaves and spikes. Regression analysis was used to establish relationships among the photosynthesis parameters. All statistical analyses were performed using SPSS 20.0 (SPSS, Inc., Chicago, IL, USA). p-values < 0.05 were considered to be statistically significant.

5. Conclusions

The findings from this study suggest that moderate grazing enhanced leaf photosynthetic capacity in S. purpurea and L. secalinus but reduced capacity in A. inebrians. However, spike photosynthetic capacity of three grass species decreased in response to grazing intensities. Grazing promoted leaf photosynthesis parameters of S. purpurea and L. secalinus as a result of compensatory photosynthesis. However, grazing reduced leaf photosynthesis parameters of A. inebrians due to its toxicity, which is a species strategy different from the other two species. Furthermore, spike photosynthesis parameters of three grass species decreased under grazing intensities owing to the distinct spatial location of spike. Among the three species, leaf and spike Pn and Tr of S. purpurea were the greatest, while organ temperature was the lowest, suggesting that S. purpurea performed the best in terms of synthesizing organic compounds and could maintain relatively low optimal organ temperatures because of increased water consumption, which is conducive to accelerating photosynthesis. This result indicated that S. purpurea displayed the greatest ability for leaf and spike photosynthetic capacity to withstand and acclimate to grazing disturbance. This study was unique in its exploration of grazing impact on spike photosynthesis parameters of grass species. More research on, for example, chlorophyll fluorescence, chloroplast ultrastructure, and antioxidant enzymes will therefore be necessary to clarify the differences in strategies between leaf and spike of different species in response to grazing disturbance.

Author Contributions

Conceptualization, F.H.; methodology, F.H.; data curation, J.L.; writing—original draft preparation, J.L.; writing—review and editing, J.L. and F.H.; visualization, J.L.; supervision, F.H. and J.R.; funding acquisition, F.H. All authors have read and agreed to the published version of the manuscript.

Funding

This research was supported by grants from Strategic Priority Research Program of Chinese Academy of Sciences (Grant No. XDA20100102), Second Tibetan Plateau Scientific Expedition and Research (STEP) program (Grant No. 2019QZKK0302), Major Special Science and Technology Project of Gansu Province (Grant No. 18ZD2FA009), and Innovative Research team of Chinese Ministry of Education (Grant No. IRT-17R50).

Institutional Review Board Statement

Not applicable.

Informed Consent Statement

Not applicable.

Data Availability Statement

Relevant data applicable to this research are within the paper.

Conflicts of Interest

The authors declare no conflict of interest.

References

  1. Luo, C.; Xu, G.; Chao, Z.; Wang, S.; Lin, X.; Hu, Y.; Zhang, Z.; Duan, J.; Chang, X.; Su, A.; et al. Effect of warming and grazing on litter mass loss and temperature sensitivity of litter and dung mass loss on the Tibetan plateau. Glob. Chang. Biol. 2010, 16, 1606–1617. [Google Scholar] [CrossRef]
  2. Sala, O.E.; Yahdjian, L.; Havstad, K.; Aguiar, M.R. Rangeland ecosystem services: Nature’s supply and humans’ demand. In Rangeland Systems; Springer: Cham, Switzerland, 2017; pp. 467–489. [Google Scholar]
  3. Ashraf, M.; Harris, P.J.C. Photosynthesis under stressful environments: An overview. Photosynthetica 2013, 51, 163–190. [Google Scholar] [CrossRef]
  4. Guanter, L.; Zhang, Y.; Jung, M.; Joiner, J.; Voigt, M.; Berry, J.A.; Frankenberg, C.; Huete, A.R.; Zarco-Tejada, P.; Lee, J.E.; et al. Global and time-resolved monitoring of crop photosynthesis with chlorophyll fluorescence. Proc. Natl. Acad. Sci. USA 2014, 111, E1327–E1333. [Google Scholar] [CrossRef] [Green Version]
  5. Zheng, S.; Lan, Z.; Li, W.; Shao, R.; Shan, Y.; Wan, H.; Taube, F.; Bai, Y. Differential responses of plant functional trait to grazing between two contrasting dominant C3 and C4 species in a typical steppe of Inner Mongolia, China. Plant Soil 2011, 340, 141–155. [Google Scholar] [CrossRef]
  6. Xiao, H.; Peng, Z.; Xu, C.; Zhang, D.; Chai, J.; Pan, T.; Yu, X. Yak and Tibetan sheep trampling inhibit reproductive and photosynthetic traits of medicago ruthenica var. inschanica. Environ. Monit. Assess 2018, 190, 507. [Google Scholar] [CrossRef]
  7. Yang, C.; Zhang, Y.; Hou, F.; Millner, J.; Wang, Z.; Chang, S. Grazing activity increases decomposition of yak dung and litter in an alpine meadow on the Qinghai-Tibet plateau. Plant Soil 2019, 444, 239–250. [Google Scholar] [CrossRef] [Green Version]
  8. Li, X.; Huang, Q.; Mi, X.; Bai, Y.; Zhang, M.; Li, X. Grazing every month minimizes size but boosts photosynthesis in stipa grandis in the steppe of inner Mongolia, China. J. Arid Land 2018, 10, 601–611. [Google Scholar] [CrossRef] [Green Version]
  9. Liu, H.; Zang, R.; Chen, H. Effects of grazing on photosynthetic features and soil respiration of rangelands in the Tianshan Mountains of Northwest China. Sci. Rep. 2016, 6, 30087. [Google Scholar] [CrossRef] [Green Version]
  10. Shen, H.; Dong, S.; Li, S.; Xiao, J.; Han, Y.; Yang, M.; Zhang, J.; Gao, X.; Xu, Y.; Li, Y.; et al. Grazing enhances plant photosynthetic capacity by altering soil nitrogen in alpine grasslands on the Qinghai-Tibetan plateau. Agric. Ecosyst. Environ. 2019, 280, 161–168. [Google Scholar] [CrossRef]
  11. Lu, Z.; Pan, Y.; Hu, W.; Cong, R.; Ren, T.; Guo, S.; Lu, J. The photosynthetic and structural differences between leaves and siliques of Brassica napus exposed to potassium deficiency. BMC Plant Biol. 2017, 17, 240. [Google Scholar] [CrossRef] [Green Version]
  12. Zhu, X.; Zhang, L.; Kuang, C.; Guo, Y.; Huang, C.; Deng, L.; Sun, X.; Zhan, G.; Hu, Z.; Wang, H.; et al. Important photosynthetic contribution of silique wall to seed yield-related traits in Arabidopsis thaliana. Photosynth. Res. 2018, 137, 493–501. [Google Scholar] [CrossRef]
  13. Hu, L.; Zhang, Y.; Xia, H.; Fan, S.; Song, J.; Lv, X.; Kong, L. Photosynthetic characteristics of non-foliar organs in main C3 cereals. Physiol. Plant. 2019, 166, 226–239. [Google Scholar] [CrossRef]
  14. Tambussi, E.A.; Bort, J.; Guiamet, J.J.; Nogués, S.; Araus, J.L. The photosynthetic role of ears in C3 cereals: Metabolism, water use efficiency and contribution to grain yield. Crit. Rev. Plant Sci. 2007, 26, 1–16. [Google Scholar] [CrossRef]
  15. Simkin, A.J.; Faralli, M.; Ramamoorthy, S.; Lawson, T. Photosynthesis in non-foliar tissues: Implications for yield. Plant J. 2019, 101, 1001–1015. [Google Scholar] [CrossRef] [PubMed]
  16. Sanchez-Bragado, R.; Molero, G.; Reynolds, M.P.; Araus, J.L. Photosynthetic contribution of the ear to grain filling in wheat: A comparison of different methodologies for evaluation. J. Exp. Bot. 2016, 67, 2787–2798. [Google Scholar] [CrossRef]
  17. Hu, Y.; Zhang, Y.; Luo, H.; Li, W.; Oguchi, R.; Fan, D.; Chow, W.; Zhang, W. Important photosynthetic contribution from the non-foliar green organs in cotton at the late growth stage. Planta 2012, 235, 325–336. [Google Scholar] [CrossRef] [PubMed] [Green Version]
  18. Brazel, A.J.; Ó’Maoiléidigh, D.S. Photosynthetic activity of reproductive organs. J. Exp. Bot. 2019, 70, 1737–1754. [Google Scholar] [CrossRef] [PubMed]
  19. Ziegler-Jöns, A. Gas exchange of ears of cereals in response to carbon dioxide and light: I. Relative contributions of parts of the ears of wheat, oat, and barley to the gas exchange of the whole organ. Planta 1989, 178, 84–91. [Google Scholar] [CrossRef]
  20. Šebela, D.; Quiñones, C.; Olejníčková, J.; Jagadish, K.S.V. Temporal chlorophyll fluorescence signals to track changes in optical properties of maturing rice panicles exposed to high night temperature. Field Crops Res. 2015, 177, 75–85. [Google Scholar] [CrossRef]
  21. Jia, S.; Lv, J.; Jiang, S.; Liang, T.; Liu, C.; Jing, Z. Response of wheat ear photosynthesis and photosynthate carbon distribution to water deficit. Photosynthetica 2015, 53, 95–109. [Google Scholar] [CrossRef] [Green Version]
  22. Hein, J.A.; Sherrard, M.E.; Manfredi, K.P.; Abebe, T. The fifth leaf and spike organs of barley (Hordeum vulgare L.) display different physiological and metabolic responses to drought stress. BMC Plant Biol. 2016, 16, 248. [Google Scholar] [CrossRef] [Green Version]
  23. Deng, S.; Yang, T.; Zeng, B.; Zhu, X.; Xu, H. Vegetation cover variation in the Qilian Mountains and its response to climate change in 2000–2011. J. Mt. Sci. 2013, 10, 1050–1062. [Google Scholar] [CrossRef]
  24. Cheng, G.; Li, X.; Zhao, W.; Xu, Z.; Feng, Q.; Xiao, S.; Xiao, H. Integrated study of the water–ecosystem–economy in the Heihe River Basin. Natl. Sci. Rev. 2014, 1, 413–428. [Google Scholar] [CrossRef] [Green Version]
  25. Baranova, A.; Schickhoff, U.; Wang, S.; Jin, M. Mountain pastures of Qilian Shan: Plant communities, grazing impact and degradation status (Gansu province, NW China). Hacquetia 2016, 15, 21–35. [Google Scholar] [CrossRef] [Green Version]
  26. Sun, F.; Lü, Y.; Wang, J.; Hu, J.; Fu, B. Soil moisture dynamics of typical ecosystems in response to precipitation: A monitoring-based analysis of hydrological service in the Qilian Mountains. Catena 2015, 129, 63–75. [Google Scholar] [CrossRef]
  27. Yao, Z.; Zhao, C.; Yang, K.; Liu, W.; Li, Y.; You, J.; Xiao, J. Alpine grassland degradation in the Qilian Mountains, China—A case study in Damaying Grassland. Catena 2016, 137, 494–500. [Google Scholar] [CrossRef]
  28. Yuan, H.; Hou, F. Grazing intensity and soil depth effects on soil properties in alpine meadow pastures of Qilian Mountain in northwest China. Acta Agric. Scand. B Soil Plant Sci. 2015, 65, 222–232. [Google Scholar] [CrossRef] [Green Version]
  29. Hou, F.; Ren, J. Trampling of Gansu Wapiti (Cervus elaphus kansuensis Pocock) and its effects on soil properties in winter grazing grassland. Acta Ecol. Sin. 2003, 23, 486–494. [Google Scholar]
  30. Geiger, D.R.; Servaites, J.C. Diurnal regulation of photosynthetic carbon metabolism in C3 plants. Annu. Rev. Plant Biol. 1994, 45, 235–256. [Google Scholar] [CrossRef]
  31. Gao, Z.; Xu, B.; Wang, J.; Huo, L.; Li, S. Diurnal and seasonal variations in photosynthetic characteristics of switchgrass in semiarid region on the Loess Plateau of China. Photosynthetica 2015, 53, 489–498. [Google Scholar] [CrossRef]
  32. Zhang, X.; Lang, D.; Zhang, E.; Bai, C.; Wang, H. Diurnal changes in photosynthesis and antioxidants of Angelica sinensis as influenced by cropping systems. Photosynthetica 2013, 51, 252–258. [Google Scholar] [CrossRef]
  33. Ibrahim, M.H.; Jaafar, H.Z.E. Photosynthetic capacity, photochemical efficiency and chlorophyll content of three varieties of Labisia pumila Benth. exposed to open field and greenhouse growing conditions. Acta Physiol. Plant 2011, 33, 2179–2185. [Google Scholar] [CrossRef] [Green Version]
  34. Yin, C.; Berninger, F.; Li, C. Photosynthetic responses of Populus przewalski subjected to drought stress. Photosynthetica 2006, 44, 62–68. [Google Scholar] [CrossRef]
  35. Detling, J.K.; Dyer, M.I.; Winn, D.T. Net photosynthesis, root respiration, and regrowth of Bouteloua gracilis following simulated grazing. Oecologia 1979, 41, 127–134. [Google Scholar] [CrossRef]
  36. Castro, H.; Nabais, C.; Alados, C.L.; Freitas, H. Effects of cessation of grazing on leaf-level photosynthesis of Periploca laevigata. Appl. Veg. Sci. 2003, 6, 255–260. [Google Scholar] [CrossRef]
  37. Redondo-Gómez, S.; Mancilla-Leytón, J.M.; Mateos-Naranjo, E.; Cambrollé, J.; Martín-Vicente, A. Differential photosynthetic performance of three Mediterranean shrubs under grazing by domestic goats. Photosynthetica 2010, 48, 348–354. [Google Scholar] [CrossRef]
  38. Harrison, M.T.; Kelman, W.M.; Moore, A.D.; Evans, J.R. Grazing winter wheat relieves plant water stress and transiently enhances photosynthesis. Funct. Plant Biol. 2010, 37, 726–736. [Google Scholar] [CrossRef]
  39. Nowak, R.; Caldwell, M. A test of compensatory photosynthesis in the field: Implications for herbivory tolerance. Oecologia 1984, 61, 311–318. [Google Scholar] [CrossRef]
  40. Irisarri, J.G.N.; Derner, J.D.; Porensky, L.M.; Augustine, D.J.; Reeves, J.; Mueller, K.E. Grazing intensity differentially regulates ANPP response to precipitation in North American semiarid grasslands. Ecol. Appl. 2016, 26, 1370–1380. [Google Scholar] [CrossRef] [Green Version]
  41. Miles, C.O.; Lane, G.A.; di Menna, M.E.; Garthwaite, I.; Piper, E.L.; Ball, O.J.P.; Latch, G.C.M.; Allen, J.M.; Hunt, M.B.; Bush, L.P.; et al. High levels of ergonovine and lysergic acid amide in toxic Achnatherum inebrians accompany infection by an Acremonium-like endophytic fungus. J. Agric. Food Chem. 1996, 44, 1285–1290. [Google Scholar] [CrossRef]
  42. Shi, Z.C. Important Poisonous Plants of China Grassland; China Agriculture Press: Beijing, China, 1997. [Google Scholar]
  43. Liang, Y.; Wang, H.; Li, C.; Nan, Z.; Li, F. Effects of feeding drunken horse grass infected with Epichloë gansuensis endophyte on animal performance, clinical symptoms and physiological parameters in sheep. BMC Vet. Res. 2017, 13, 223. [Google Scholar] [CrossRef] [Green Version]
  44. Gaffney, R.; Porensky, L.M.; Gao, F.; Irisarri, J.G.; Durante, M.; Derner, J.D.; Augustine, D.J. Using APAR to Predict Aboveground Plant Productivity in Semi-Arid Rangelands: Spatial and Temporal Relationships Differ. Remote Sens. 2018, 10, 1474. [Google Scholar] [CrossRef] [Green Version]
  45. Pieruschka, R.; Huber, G.; Berry, J.A. Control of transpiration by radiation. Proc. Natl. Acad. Sci. USA 2010, 107, 13372–13377. [Google Scholar] [CrossRef] [PubMed] [Green Version]
  46. Yang, X.; Short, T.; Fox, R.; Bauerle, W. Transpiration, leaf temperature and stomatal resistance of a greenhouse cucumber crop. Agric. For. Meteorol. 1990, 51, 197–209. [Google Scholar] [CrossRef]
  47. O’Sullivan, O.S.; Heskel, M.A.; Reich, P.B.; Tjoelker, M.G.; Weerasinghe, K.W.L.K.; Penillard, A.; Zhu, L.L.; Egerton, J.J.G.; Bloomfield, K.J.; Creek, D.; et al. Thermal limits of leaf metabolism across biomes. Glob. Chang. Biol. 2017, 23, 209–223. [Google Scholar] [CrossRef] [Green Version]
  48. Ilnitsky, O.A.; Pashtetsky, A.V.; Plugatar, Y.V.; Korsakova, S.P. Dependency of a Photosynthesis Rate in Nerium oleander L. on Environmental Factors, Leaf Temperature, Transpiration, and Their Change During Vegetation in Subtropics. Russ. Agric. Sci. 2018, 44, 224–228. [Google Scholar] [CrossRef]
  49. Sakata, T.; Nakano, T.; Kachi, N. Effects of internal conductance and Rubisco on the optimum temperature for leaf photosynthesis in Fallopia japonica growing at different altitudes. Ecol. Res. 2015, 30, 163–171. [Google Scholar] [CrossRef]
  50. Shen, X.; Liu, B.; Zhou, D. Effects of grassland degradation on air and soil temperature in Songnen plain of northeast China. Curr. Sci. India 2015, 108, 2098–2101. [Google Scholar]
  51. Ferrante, P.; Gennusa, M.; Peri, G.; Rizzo, G.; Scaccianoce, G. Vegetation growth parameters and leaf temperature: Experimental results from a six plots green roofs’ system. Energy 2016, 115, 1723–1732. [Google Scholar] [CrossRef]
  52. Monteiro, M.V.; Blanuša, T.; Verhoef, A.; Hadley, P.; Cameron, R.W.F. Relative importance of transpiration rate and leaf morphological traits for the regulation of leaf temperature. Aust. J. Bot. 2016, 64, 32–44. [Google Scholar] [CrossRef]
  53. Urban, J.; Ingwers, M.W.; McGuire, M.A.; Teskey, R.O. Increase in leaf temperature opens stomata and decouples net photosynthesis from stomatal conductance in Pinus taeda and Populus deltoides x nigra. J. Exp. Bot. 2017, 68, 1757–1767. [Google Scholar] [CrossRef]
  54. Gajanayake, B.; Reddy, K.R.; Shankle, M.W.; Arancibia, R.A. Growth, developmental, and physiological responses of two sweetpotato (Ipomoea batatas L. [Lam]) cultivars to early season soil moisture deficit. Sci. Hortic. 2014, 168, 218–228. [Google Scholar] [CrossRef]
  55. Yan, C.; Chen, H.; Fan, T.; Huang, Y.; Yu, S.; Chen, S.; Hong, X. Rice flag leaf physiology, organ and canopy temperature in response to water stress. Plant Prod. Sci. 2012, 15, 92–99. [Google Scholar] [CrossRef]
  56. Nourtier, M.; Chanzy, A.; Cailleret, M.; Yingge, X.; Huc, R.; Davi, H. Transpiration of silver Fir (Abies alba mill.) during and after drought in relation to soil properties in a Mediterranean mountain area. Ann. For. Sci. 2014, 71, 683–695. [Google Scholar] [CrossRef]
  57. Sun, D.; Liddle, M.J. Plant morphological characteristics and resistance to simulated trampling. Environ. Manag. 1993, 17, 511–521. [Google Scholar] [CrossRef]
  58. Trenholm, L.E.; Duncan, R.R.; Carrow, R.N. Wear tolerance, shoot performance, and spectral reflectance of seashore paspalum and bermudagrass. Crop Sci. 1999, 39, 1147–1152. [Google Scholar] [CrossRef]
  59. Xu, L.; Yu, F.; Drunen, V.E.; Schieving, F.; Dong, M.; Anten, N.P.R. Trampling, defoliation and physiological integration affect growth, morphological and mechanical properties of a root-suckering clonal tree. Ann. Bot. 2012, 109, 1001–1008. [Google Scholar] [CrossRef] [PubMed] [Green Version]
  60. Xu, L.; Freitas, S.M.A.; Yu, F.; Dong, M.; Anten, N.P.R.; Werger, M.J.A. Effects of trampling on morphological and mechanical traits of dryland shrub species do not depend on water availability. PLoS ONE 2013, 8. [Google Scholar] [CrossRef] [PubMed] [Green Version]
  61. Faralli, M.; Matthews, J.; Lawson, T. Exploiting natural variation and genetic manipulation of stomatal conductance for crop improvement. Curr. Opin. Plant Biol. 2019, 49, 1–7. [Google Scholar] [CrossRef]
  62. Araus, J.L.; Brown, H.R.; Febrero, A.; Bort, J.; Serret, M.D. Ear photosynthesis, carbon isotope discrimination and the contribution of respiratory CO2 to differences in grain mass in durum wheat. Plant Cell Environ. 1993, 16, 383–392. [Google Scholar] [CrossRef]
  63. Ye, X.; Yu, F.; Dong, M. A trade-off between guerrilla and phalanx growth forms in Leymus secalinus under different nutrient supplies. Ann. Bot. 2006, 98, 187–191. [Google Scholar] [CrossRef] [PubMed] [Green Version]
  64. Sui, Y.; He, W.; Pan, X.; Dong, M. Partial mechanical stimulation facilitates the growth of the rhizomatous plant Leymus secalinus: Modulation by clonal integration. Ann. Bot. 2011, 107, 693–697. [Google Scholar] [CrossRef] [PubMed] [Green Version]
  65. Dong, M. Effects of severing rhizome on clonal growth in rhizomatous grass species Psammochloa villosa and Leymus secalinus. Acta Bot. Sin. 1999, 41, 194–198. [Google Scholar]
  66. Lv, Z.N. Study on Reproductive Characteristics of Several Representative Rhizomatous Grasses. Master Thesis, Inner Mongolia Agricultural University, Inner Mongolia, China, 2010. [Google Scholar]
  67. Liu, F.; Andersen, M.N.; Jacobsen, S.E.; Jensen, C.R. Stomatal control and water use efficiency of soybean (Glycine max L. Merr.) during progressive soil drying. Environ. Exp. Bot. 2005, 54, 33–40. [Google Scholar] [CrossRef]
  68. Medrano, H.; Tomás, M.; Martorell, S.; Flexasa, J.; Hernándeza, E.; Rossellóa, J.; Poub, A.; Escalonaa, J.; Bota, J. From leaf to whole-plant water use efficiency (WUE) in complex canopies: Limitations of leaf WUE as a selection target. Crop J. 2015, 3, 220–228. [Google Scholar] [CrossRef] [Green Version]
  69. Fuentes, J.P.; Flury, M.; Huggins, D.R.; Bezdicek, D.F. Soil water and nitrogen dynamics in dryland cropping systems of Washington State, USA. Soil Tillage Res. 2003, 71, 33–47. [Google Scholar] [CrossRef]
  70. Cheng, L.; Zhang, L.; Wang, Y.P.; Canadell, J.G.; Chiew, F.; Beringer, J.; Li, L.; Miralles, D.G.; Piao, S.; Zhang, Y. Recent increases in terrestrial carbon uptake at little cost to the water cycle. Nat. Commun. 2017, 8, 1–10. [Google Scholar] [CrossRef] [Green Version]
  71. Muñoz-Ortuño, M.; Serra-Mora, P.; Herráez-Hernández, R.; Verdú-Andrés, J.; Campíns-Falcó, P. A new tool for direct non-invasive evaluation of chlorophyll a content from diffuse reflectance measurements. Sci. Total Environ. 2017, 609, 370–376. [Google Scholar] [CrossRef]
  72. Mutanga, O.; Skidmore, A.K. Red edge shift and biochemical content in grass canopies. ISPRS J. Photogramm. Remote Sens. 2007, 62, 34–42. [Google Scholar] [CrossRef]
  73. Mutanga, O.; Skidmore, A.K. Discriminating sodium concentration in a mixed grass species environment of the Kruger National Park using field spectrometry. Int. J. Remote Sens. 2004, 25, 4191–4201. [Google Scholar] [CrossRef]
  74. Zhang, J.; Huang, W.; Zhou, Q. Reflectance variation within the in-chlorophyll centre waveband for robust retrieval of leaf chlorophyll content. PLoS ONE 2014, 9. [Google Scholar] [CrossRef]
  75. Du, E.; Dong, D.; Zeng, X.; Sun, Z.; Jiang, X.; Vries, W.D. Direct effect of acid rain on leaf chlorophyll content of terrestrial plants in China. Sci. Total Environ. 2017, 605, 764–769. [Google Scholar] [CrossRef]
  76. Akram, N.A.; Ashraf, M. Improvement in growth, chlorophyll pigments and photosynthetic performance in salt-stressed plants of sunflower (Helianthus annuus L.) by foliar application of 5-aminolevulinic acid. Agrochimica 2011, 55, 94–104. [Google Scholar]
  77. Kannan, N.D.; Kulandaivelu, G. Drought induced changes in physiological, biochemical and phytochemical properties of Withania somnifera Dun. J. Med. Plant Res. 2011, 5, 3929–3935. [Google Scholar] [CrossRef]
  78. Ling, B.; Goodin, D.G.; Raynor, E.J.; Joern, A. Hyperspectral Analysis of Leaf Pigments and Nutritional Elements in Tallgrass Prairie Vegetation. Front. Plant Sci. 2019, 10. [Google Scholar] [CrossRef] [Green Version]
  79. Esteban, R.; Barrutia, O.; Artetxe, U.; Fernández-Marín, B.; Hernández, A.; García-Plazaola, J.I. Internal and external factors affecting photosynthetic pigment composition in plants: A meta-analytical approach. New Phytol. 2015, 206, 268–280. [Google Scholar] [CrossRef]
  80. Neilsen, J.A.D.; Rangsrikitphoti, P.; Durnford, D.G. Evolution and regulation of Bigelowiella natans light-harvesting antenna system. J. Plant Physiol. 2017, 217, 68–76. [Google Scholar] [CrossRef] [PubMed]
  81. Qian, L.; Qi, S.; Cao, F.; Zhang, J.; Zhao, F.; Li, C.; Wang, C. Toxic effects of boscalid on the growth, photosynthesis, antioxidant system and metabolism of Chlorella vulgaris. Environ. Pollut. 2018, 242, 171–181. [Google Scholar] [CrossRef] [PubMed]
  82. Ballottari, M.; Dall’Osto, L.; Morosinotto, T.; Bassi, R. Contrasting behavior of higher plant photosystem I and II antenna systems during acclimation. J. Biol. Chem. 2007, 282, 8947–8958. [Google Scholar] [CrossRef] [PubMed] [Green Version]
  83. Anderson, J.M.; Chow, W.S.; Rivas, J.D.L. Dynamic flexibility in the structure and function of photosystem II in higher plant thylakoid membranes: The grana enigma. Photosynth. Res. 2008, 98, 575–587. [Google Scholar] [CrossRef] [PubMed] [Green Version]
  84. Dinç, E.; Ceppi, M.G.; Tóth, S.Z.; Bottka, S.; Schansker, G. The chl a fluorescence intensity is remarkably insensitive to changes in the chlorophyll content of the leaf as long as the chl a/b ratio remains unaffected. BBA Bioenerg. 2012, 1817, 770–779. [Google Scholar] [CrossRef] [PubMed] [Green Version]
  85. Ballottari, M.; Alcocer, M.J.P.; D’Andrea, C.; Viola, D.; Bassi, R. Regulation of photosystem I light harvesting by zeaxanthin. Proc. Natl. Acad. Sci. USA 2014, 111, E2431–E2438. [Google Scholar] [CrossRef] [Green Version]
  86. Terashima, I.; Inoue, Y. Vertical gradient in photosynthetic properties of spinach chloroplast dependent on intra-leaf light environment. Plant Cell Physiol. 1985, 26, 781–785. [Google Scholar] [CrossRef]
  87. Davison, P.A.; Hunter, C.N.; Horton, P. Overexpression of β-carotene hydroxylase enhances stress tolerance in Arabidopsis. Nature 2002, 418, 203–206. [Google Scholar] [CrossRef] [PubMed]
  88. Hendry, G.A.F.; Price, A.H. Stress indicators: Chlorophylls and carotenoids. In Methods in Comparative Plant Ecology; Hendry, G.A.F., Grime, J.P., Eds.; Chapman & Hall: London, UK, 1993; pp. 148–152. [Google Scholar]
  89. Sonobe, R.; Miura, Y.; Sano, T.; Horie, H. Estimating leaf carotenoid contents of shade-grown tea using hyperspectral indices and PROSPECT–D inversion. Int. J. Remote Sens. 2018, 39, 1306–1320. [Google Scholar] [CrossRef]
  90. Oliveira, M.T.; Matzek, V.; Medeiros, C.D.; Rivas, R.; Falcao, H.M.; Santos, M.G. Stress tolerance and ecophysiological ability of an invader and a native species in a seasonally dry tropical forest. PLoS ONE 2014, 9. [Google Scholar] [CrossRef]
  91. Molina-Montenegro, M.A.; Penuelas, J.; Munné-Bosch, S.; Sardans, J. Higher plasticity in ecophysiological traits enhances the performance and invasion success of Taraxacum officinale (dandelion) in alpine environments. Biol. Invasions 2012, 14, 21–33. [Google Scholar] [CrossRef]
  92. Savchenko, T.; Yanykin, D.; Khorobrykh, A.; Terentyev, V.; Klimov, V.; Dehesh, K. The hydroperoxide lyase branch of the oxylipin pathway protects against photoinhibition of photosynthesis. Planta 2017, 245, 1179–1192. [Google Scholar] [CrossRef]
  93. Ranjbarfordoei, A.; Samson, R.; Damme, V.P. Photosynthesis performance in sweet almond [Prunus dulcis (Mill) D. Webb] exposed to supplemental UV-B radiation. Photosynthetica 2011, 49, 107. [Google Scholar] [CrossRef] [Green Version]
  94. Liu, X.; Xu, H.; Zhang, J.; Liang, G.; Liu, Y.; Guo, A. Effect of low temperature on chlorophyll biosynthesis in albinism line of wheat (Triticum aestivum) FA85. Physiol. Plant. 2012, 145, 384–394. [Google Scholar] [CrossRef] [PubMed]
  95. Strid, Å.; Porra, R.J. Alterations in pigment content in leaves of Pisum sativum after exposure to supplementary UV-B. Plant Cell Physiol. 1992, 33, 1015–1023. [Google Scholar] [CrossRef]
  96. Habibi, F.; Normahamadi, G.H.; Heidary, S.A.H.; Eivazi, A.; Majidi, H. Effect of cold stress on cell membrane stability, chlorophyll a and b contain and proline accumulation in wheat (Triticum aiestivum L.) variety. Afr. J. Agric. Res. 2011, 6, 5854–5859. [Google Scholar] [CrossRef]
  97. Essemine, J.; Xiao, Y.; Qu, M.; Mi, H.; Zhu, X. Cyclic electron flow may provide some protection against PSII photoinhibition in rice (Oryza sativa L.) leaves under heat stress. J. Plant Physiol. 2017, 211, 138–146. [Google Scholar] [CrossRef]
  98. Eric, L.; William, O.; Stephen, M.; Richard, M. Isolation and characterization of a light-harvesting chlorophyll a/b protein complex associated with photosystem I. Plant Physiol. 1984, 74, 650–655. [Google Scholar]
  99. Niinemets, U. Photosynthesis and resource distribution through plant canopies. Plant Cell Environ. 2007, 30, 1052–1071. [Google Scholar] [CrossRef] [PubMed]
  100. Niinemets, Ü. A review of light interception in plant stands from leaf to canopy in different plant functional types and in species with varying shade tolerance. Ecol. Res. 2010, 25, 693–714. [Google Scholar] [CrossRef]
  101. Mhatre, A.; Patil, S.; Agarwal, A.; Pandit, R.; Lali, A. Influence of nitrogen source on photochemistry and antenna size of the photosystems in marine green macroalgae, Ulva lactuca. Photosynth. Res. 2019, 139, 539–551. [Google Scholar] [CrossRef] [PubMed]
  102. Derks, A.; Schaven, K.; Bruce, D. Diverse mechanisms for photoprotection in photosynthesis. Dynamic regulation of photosystem II excitation in response to rapid environmental change. BBA Bioenerg. 2015, 1847, 468–485. [Google Scholar] [CrossRef] [PubMed] [Green Version]
  103. Holt, N.E.; Zigmantas, D.; Valkunas, L.; Li, X.; Niyogi, K.K.; Fleming, G.R. Carotenoid cation formation and the regulation of photosynthetic light harvesting. Science 2005, 307, 433–436. [Google Scholar] [CrossRef] [Green Version]
  104. Park, S.; Fischer, A.L.; Steen, C.J.; Iwai, M.; Morris, J.M.; Walla, P.J.; Niyogi, K.K.; Fleming, G.R. Chlorophyll-carotenoid excitation energy transfer in high-light-exposed thylakoid membranes investigated by snapshot transient absorption spectroscopy. J. Am. Chem. Soc. 2018, 140, 11965–11973. [Google Scholar] [CrossRef] [PubMed] [Green Version]
  105. Demmig-Adams, B. Survey of thermal energy dissipation and pigment composition in sun and shade leaves. Plant Cell Physiol. 1998, 39, 474–482. [Google Scholar] [CrossRef]
  106. Zhang, X.; Wollenweber, B.; Jiang, D.; Liu, F.; Zhao, J. Water deficits and heat shock effects on photosynthesis of a transgenic Arabidopsis thaliana constitutively expressing ABP9, a bZIP transcription factor. J. Exp. Bot. 2008, 59, 839–848. [Google Scholar] [CrossRef] [Green Version]
  107. González, J.A.; Gallardo, M.G.; Boero, C.; Cruz, M.L.; Prado, F.E. Altitudinal and seasonal variation of protective and photosynthetic pigments in leaves of the world’s highest elevation trees Polylepis tarapacana (Rosaceae). Acta Oecol. 2007, 32, 36–41. [Google Scholar] [CrossRef]
  108. Raynor, E.J.; Derner, J.D.; Baldwin, T.; Ritten, J.P.; Augustine, D.J. Multidecadal directional shift in shortgrass stocking rates. Rangel. Ecol. Manag. 2020, 74, 72–80. [Google Scholar] [CrossRef]
  109. Hou, F.; Nan, Z.; Xie, Y.; Li, X.; Lin, H.; Ren, J. Integrated crop-livestock production systems in China. Rangel. J. 2008, 30, 221–231. [Google Scholar] [CrossRef]
  110. Wu, Z.; Hou, X.; Zhu, Y.; He, S.; Zhou, Y. Vegetation of China; Science Press: Beijing, China, 1980. [Google Scholar]
  111. Zhang, Y.; Chen, X.; Cheng, Y.; Chang, S.; Hou, F. Effects of stocking rates on functional group diversity and forage quality in rangeland of Qilian Mountain, China. J. Environ. Biol. 2015, 36, 713–719. [Google Scholar]
  112. Stępień, P.; Kłobus, G. Water relations and photosynthesis in Cucumis sativus L. leaves under salt stress. Biol. Plant. 2006, 50, 610. [Google Scholar] [CrossRef]
  113. Inskeep, W.P.; Bloom, P.R. Extinction coefficients of chlorophyll a and b in N, N-dimethylformamide and 80% acetone. Plant Physiol. 1985, 77, 483–485. [Google Scholar] [CrossRef] [PubMed] [Green Version]
  114. Lichtenthaler, H.K. Chlorophylls and Carotenoids: Pigments of Photosynthetic Biomembranes. Methods Enzymol. 1987, 148, 350–382. [Google Scholar] [CrossRef]
Figure 1. Diurnal time course of the photosynthetically active radiation (PAR) (a), air temperature (Ta) (b), and air relative humidity (RH) (c). The data are presented as mean ± standard error (SE) of three independent experiments.
Plants 10 00294 g001
Figure 2. Diurnal dynamics of the net photosynthetic rate (Pn) of the leaves and spikes of S. purpurea (a,d), A. inebrians (b,e) and L. secalinus (c,f) in response to grazing intensity (LG, light grazing; MG, medium grazing; HG, heavy grazing). The data are presented as mean ± standard error (SE) of three independent experiments.
Plants 10 00294 g002
Figure 3. Mean values of photosynthesis parameters including the net photosynthetic rate (Pn) (a), transpiration rate (Tr) (b), water use efficiency (WUE) (c), and leaf temperature (Tl) (d) of the leaves of S. purpurea, A. inebrians and L. secalinus in response to grazing intensity (LG, light grazing; MG, medium grazing; HG, heavy grazing). Note: S. purpurea, Stipa purpurea; A. inebrians, Achnatherum inebrians; L. secalinus, Leymus secalinus. The data are presented as mean ± standard error (SE) of three independent experiments. ** p ≤ 0.01; *** p ≤ 0.001; NS, no significance. Different lowercase letters mean significant difference (p ≤ 0.05) between same species under different grazing intensities. Different uppercase letters mean significant difference (p ≤ 0.05) between different species or different grazing intensities.
Plants 10 00294 g003
Figure 4. Mean values of photosynthesis parameters including the net photosynthetic rate (Pn) (a), transpiration rate (Tr) (b), water use efficiency (WUE) (c), and spike temperature (Ts) (d) of the spikes of S. purpurea, A. inebrians and L. secalinus in response to grazing intensity (LG, light grazing; MG, medium grazing; HG, heavy grazing). Note: S. purpurea, Stipa purpurea; A. inebrians, Achnatherum inebrians; L. secalinus, Leymus secalinus. The data are presented as mean ± standard error (SE) of three independent experiments. ** p ≤ 0.01; *** p ≤ 0.001; NS, no significance. Different lowercase letters mean significant difference (p ≤ 0.05) between same species under different grazing intensities. Different uppercase letters mean significant difference (p ≤ 0.05) between different species or different grazing intensities.
Plants 10 00294 g004
Figure 5. Diurnal dynamics of the transpiration rate (Tr) of the leaves and spikes of S. purpurea (a,d), A. inebrians (b,e) and L. secalinus (c,f) in response to grazing intensity (LG, light grazing; MG, medium grazing; HG, heavy grazing). The data are presented as mean ± standard error (SE) of three independent experiments.
Plants 10 00294 g005
Figure 6. Diurnal dynamics of the water use efficiency (WUE) of the leaves and spikes of S. purpurea (a,d), A. inebrians (b,e) and L. secalinus (c,f) in response to grazing intensity (LG, light grazing; MG, medium grazing; HG, heavy grazing). The data are presented as mean ± standard error (SE) of three independent experiments.
Plants 10 00294 g006
Figure 7. Diurnal dynamics of the leaf temperature (Tl) and spike temperature (Ts) of S. purpurea (a,d), A. inebrians (b,e) and L. secalinus (c,f) in response to grazing intensity (LG, light grazing; MG, medium grazing; HG, heavy grazing). The data are presented as mean ± standard error (SE) of three independent experiments.
Plants 10 00294 g007
Figure 8. Correlations between leaf net photosynthetic rate (Pn) and leaf temperature (Tl) (top), and between spike Pn and spike temperature (Ts) (bottom) of S. purpurea (a,d), A. inebrians (b,e) and L. secalinus (c,f) under grazing intensity (LG, light grazing; MG, medium grazing; HG, heavy grazing).
Plants 10 00294 g008
Figure 9. Correlations between leaf transpiration rate (Tr) and leaf temperature (Tl) (top), and between spike Tr and spike temperature (Ts) (bottom) of S. purpurea (a,d), A. inebrians (b,e) and L. secalinus (c,f) under grazing intensity (LG, light grazing; MG, medium grazing; HG, heavy grazing).
Plants 10 00294 g009
Figure 10. Correlations between leaf water use efficiency (WUE) and leaf temperature (Tl) (top), and between spike WUE and spike temperature (Ts) (bottom) of S. purpurea (a,d), A. inebrians (b,e) and L. secalinus (c,f) under grazing intensity (LG, light grazing; MG, medium grazing; HG, heavy grazing).
Plants 10 00294 g010
Figure 11. Map of study site. (a) Location of study site in Sunan County, the middle part in northern slope of the Qilian Mountains; (b) The grazing land and Gansu wapiti (Cervus elaphus kansuensis).
Plants 10 00294 g011
Table 1. Effects of different species and grazing intensities on leaf chlorophyll content.
SpeciesGIChl aChl bTCCarChl a/bTC/Car
(AUM ha−1)(mg g−1 FW)(mg g−1 FW)(mg g−1 FW)(mg g−1 FW)
S. purpureaLG1.69 ± 0.09 c0.67 ± 0.02 b2.36 ± 0.08 c0.42 ± 0.04 b2.54 ± 0.19 abc5.60 ± 0.28 c
MG1.72 ± 0.07 c0.70 ± 0.06 b2.41 ± 0.11 c0.34 ± 0.03 bc2.50 ± 0.20 abc7.24 ± 0.51 c
HG2.05 ± 0.07 b0.96 ± 0.10 a3.01 ± 0.15 b0.29 ± 0.03 c2.17 ± 0.20 bc10.40 ± 0.44 b
A. inebriansLG2.68 ± 0.14 a0.96 ± 0.02 a3.64 ± 0.15 a0.58 ± 0.03 a2.80 ± 0.12 abc6.31 ± 0.25 c
MG2.43 ± 0.02 a0.95 ± 0.01 a3.38 ± 0.03 a0.56 ± 0.01 a2.56 ± 0.02 abc6.04 ± 0.07 c
HG1.51 ± 0.08 c0.77 ± 0.02 ab2.29 ± 0.09 c0.42 ± 0.01 b1.96 ± 0.09 c5.43 ± 0.09 c
L. secalinusLG0.65 ± 0.02 d0.21 ± 0.02 c0.85 ± 0.02 de0.08 ± 0.00 d3.22 ± 0.32 a11.25 ± 0.32 b
MG0.45 ± 0.02 d0.14 ± 0.01 c0.59 ± 0.01 e0.06 ± 0.00 d3.15 ± 0.33 ab9.74 ± 0.19 b
HG0.68 ± 0.00 d0.32 ± 0.03 c1.00 ± 0.04 d0.05 ± 0.00 d2.19 ± 0.22 b c19.01 ± 1.18 a
MeanS. purpurea1.82 ± 0.07 B0.78 ± 0.06 B2.59 ± 0.12 B0.35 ± 0.03 B2.40 ± 0.11 B7.75 ± 0.73 B
A. inebrians2.21 ± 0.18 A0.89 ± 0.03 A3.10 ± 0.21 A0.52 ± 0.03 A2.44 ± 0.13 B5.93 ± 0.15 C
L. secalinus0.59 ± 0.04 C0.22 ± 0.03 C0.82 ± 0.06 C0.06 ± 0.00 C2.85 ± 0.22 A13.33 ± 1.48 A
LG1.67 ± 0.30 A0.61 ± 0.11 A2.28 ± 0.41 A0.36 ± 0.08 A2.85 ± 0.15 A7.72 ± 0.90 B
MG1.53 ± 0.29 B0.60 ± 0.12 A2.13 ± 0.41 A0.32 ± 0.07 B2.74 ± 0.15 A7.67 ± 0.57 B
HG1.41 ± 0.20 B0.68 ± 0.10 A2.10 ± 0.30 A0.26 ± 0.05 C2.10 ± 0.10 B11.61 ± 2.02 A
Significance
level
Species****************
GI**************
Species × GI**********NS***
Note: The data are presented as mean ± standard error (SE) of three independent experiments. * p ≤ 0.05; ** p ≤ 0.01; *** p ≤ 0.001; NS, no significance. Abbreviations: S. purpurea, Stipa purpurea; A. inebrians, Achnatherum inebrians; L. secalinus, Leymus secalinus. GI, Grazing intensity; LG, light grazing; MG, medium grazing; HG, heavy grazing; Chl a, chlorophyll a; Chl b, chlorophyll b; TC, total chlorophyll; Car, total carotenoid; Chl a/b, chl a/chl b ratio; TC/Car, TC/Car ratio. Different lowercase letters mean significant difference (p ≤ 0.05) between same species under different grazing intensities. Different uppercase letters mean significant difference (p ≤ 0.05) between different species or different grazing intensities.
Table 2. Effects of different species and grazing intensities on spike chlorophyll content.
SpeciesGIChl aChl bTCCarChl a/bTC/Car
(AUM ha−1)(mg g−1 FW)(mg g−1 FW)(mg g−1 FW)(mg g−1 FW)
S. purpureaLG0.55 ± 0.02 a0.32 ± 0.03 a0.87 ± 0.05 a0.073 ± 0.007 b c1.74 ± 0.13 ef12.05 ± 0.92 ab
MG0.45 ± 0.01 ab0.12 ± 0.00 cde0.57 ± 0.01 bc0.093 ± 0.009 b3.65 ± 0.10 ab6.22 ± 0.54 c d
HG0.48 ± 0.02 a0.17 ± 0.01 bc0.65 ± 0.02 b0.143 ± 0.008 a2.82 ± 0.14 cd4.54 ± 0.15 d
A. inebriansLG0.35 ± 0.02 bc0.32 ± 0.02 a0.67 ± 0.04 b0.090 ± 0.005 b1.08 ± 0.08 f7.47 ± 0.21 c
MG0.45 ± 0.01 ab0.21 ± 0.01 b0.65 ± 0.02 b0.061 ± 0.003 cd2.17 ± 0.12 de10.73 ± 0.43 b
HG0.37 ± 0.04 b0.09 ± 0.01 de0.46 ± 0.04 cd0.033 ± 0.002 e3.92 ± 0.08 a13.91 ± 1.09 a
L. secalinusLG0.35 ± 0.04 bc0.15 ± 0.01 bcd0.50 ± 0.05 cd0.048 ± 0.005 de2.28 ± 0.24 de10.42 ± 0.75 b
MG0.20 ± 0.02 d0.07 ± 0.00 e0.27 ± 0.02 e0.057 ± 0.001 cd3.10 ± 0.33 bc4.77 ± 0.41 cd
HG0.26 ± 0.02 cd0.10 ± 0.00 de0.36 ± 0.02 de0.061 ± 0.003 cd2.64 ± 0.17 cd5.84 ± 0.06 cd
MeanS. purpurea0.49 ± 0.02 A0.20 ± 0.03 A0.70 ± 0.05 A0.103 ± 0.011 A2.74 ± 0.28 A7.60 ± 1.18 B
A. inebrians0.39 ± 0.02 B0.21 ± 0.03 A0.59 ± 0.04 B0.061 ± 0.008 B2.39 ± 0.42 A10.70 ± 0.99 A
L. secalinus0.27 ± 0.03 C0.11 ± 0.01 B0.37 ± 0.04 C0.055 ± 0.003 B2.67 ± 0.17 A7.01 ± 0.90 B
LG0.41 ± 0.04 A0.27 ± 0.03 A0.68 ± 0.06 A0.070 ± 0.007 A1.70 ± 0.19 B9.98 ± 0.75 A
MG0.37 ± 0.04 B0.13 ± 0.02 B0.50 ± 0.06 B0.070 ± 0.006 A2.97 ± 0.24 A7.24 ± 0.93 B
HG0.37 ± 0.03 B0.12 ± 0.01 B0.49 ± 0.05 B0.079 ± 0.017 A3.13 ± 0.21 A8.10 ± 1.50 B
Significance
level
Species************NS***
GI*******NS******
Species × GI******************
Note: The data are presented as mean ± standard error (SE) of three independent experiments. * p ≤ 0.05; ** p ≤ 0.01; *** p ≤ 0.001; NS, no significance. Abbreviations: S. purpurea, Stipa purpurea; A. inebrians, Achnatherum inebrians; L. secalinus, Leymus secalinus. GI, Grazing intensity; LG, light grazing; MG, medium grazing; HG, heavy grazing; Chl a, chlorophyll a; Chl b, chlorophyll b; TC, total chlorophyll; Car, total carotenoid; Chl a/b, chl a/chl b ratio; TC/Car, TC/Car ratio. Different lowercase letters mean significant difference (p ≤ 0.05) between same species under different grazing intensities. Different uppercase letters mean significant difference (p ≤ 0.05) between different species or different grazing intensities.
Publisher’s Note: MDPI stays neutral with regard to jurisdictional claims in published maps and institutional affiliations.

