Article

Genetic Structure and Molecular Identities of 46 Apple Landraces (Malus Mill.) in China

1
Key Laboratory of Horticultural Crops Germplasm Resources Utilization, Research Institute of Pomology, Chinese Academy of Agricultural Sciences, Ministry of Agriculture and Rural Affairs, Xingcheng 125100, China
2
The Key Laboratory of Special Fruits and Vegetables Cultivation Physiology and Germplasm Resources Utilization, Xinjiang Production and Construction Corps, College of Agriculture, Shihezi University, Shihezi 832000, China
*
Author to whom correspondence should be addressed.
Agronomy 2023, 13(5), 1262; https://doi.org/10.3390/agronomy13051262
Submission received: 11 March 2023 / Revised: 19 April 2023 / Accepted: 25 April 2023 / Published: 28 April 2023
(This article belongs to the Section Horticultural and Floricultural Crops)

Abstract

:
In this study, we used genotyping to determine the genetic structure and molecular identities of apple landraces from six species of Malus Mill. in China, based on the fingerprints revealed by microsatellite markers with tailed primer M13. A total of 46 apple landraces of Malus Mill. selected from the National Apple and Pear Germplasm Repository in Xingcheng, China were genotyped with 14 SSR markers. The primers differentiated all the accessions. At least three SSR primers, CH04h02, CH01f07a and CH04g07, with a higher heterozygosity and Shannon’s information index than other combinations can distinguish all the accessions. All the alleles for these three primers were arranged in descending order, and they were assigned values beginning with 01. Character strings were constituted by combining all the codes of the three primers for every accession. By such means, separate and special molecular identities were obtained for every apple landrace, which could be expressed in the form of a bar code. Using such bar codes, trees can be labeled and scanned, which aids in the identification and tracking of genebank collections. The eight-step method for establishing the molecular identities of apple landraces reported here may serve as a reference when determining the molecular identities establishment of other apple germplasms of Malus Mill. This method might also be used for the establishment of a molecular database to aid the preservation of Malus Mill., which is in imminent danger in China. It may also be used to improve the gene bank management of Malus Mill.

1. Introduction

China is one of the largest original locations of Malus Mill. in the world. China has 27 native taxa of Malus, of which 21 are wild species and 6 are cultivated; the 6 cultivated taxa include Malus asiatic, Malus domestica subsp. chinensis, Malus micromalus, Malus prunifolia, Malus robusta and Malus spectabilis [1]. A Chinese landrace of apple, Malus domestica subsp. chinensis Li Y.N., is believed to have originated from the wild apple Malus sieversii (Lebed.) M. Roem. in the Xinjiang province and then been transported into the Chinese heartland along the Silk Road during the Han Dynasty [2]. Numerous landraces were domesticated along this route, and many of them have now flourished for millennia. These landrace cultivars are similar to internationally cultivated varieties but also have some similarities to wild apple. They are often well adapted to diverse climates and can be grown in many regions. These diverse cultivars could offer desirable allelic diversity to breeding programs. However, Chinese landraces have often been replaced with western apple cultivars since these were first introduced into China in 1871. In many cases, the old landrace cultivars have not been effectively protected, promoted or utilized and are now at risk of being lost forever. Assessments of the novelty and diversity of landrace cultivars that have already been protected within gene banks will contribute to understanding and promoting their value. Genotype information will also aid in preservation, breeding and the protection of intellectual property.
In the past, the methods for the identification of Malus Mill. were mostly by morphological observation, isozyme [3,4], molecular markers [5,6,7] and so on. The simple sequence repeat with tailed primer M13 (TP-M13-SSR) combines molecular markers of simple sequence repeats (SSRs) with fluorescence sequencing. This technique was subject to a process of continuous improvements before it was applied to research into the germplasm resources of apples [8,9] and some other fruit trees [10]. The molecular identity card is a concept proposed by Chinese scholars in recent years. It is based on the DNA fingerprint, which digitally processes the fingerprint graph by means of different encoding methods [11,12]. It digitizes the DNA fingerprints, which makes it easier to understand the differences among resources in different regions and enables a more intuitive approach in the retrieval of germplasm resources. The TP-M13-SSR fingerprint method has been recognized as a simpler and more effective method for germplasm identification than traditional DNA fingerprints, which are often hand-scored. Molecular identity cards have now been constructed for sweet cherry [13], rice [14,15], sugarcane [16,17], tea [18], peach [11], kenaf [19] and radish [20]. In addition, Gao et al. constructed molecular identity cards for wild apple and cultivars in this way [21,22], However, Chinese apple landraces have not yet been identified by such means.
The National Apple and Pear Germplasm Repository at the Research Institute of Pomology (IP), Chinese Academy of Agricultural Sciences (CAAS) in Xingcheng, China currently preserves more than 2000 Malus accessions and performs annual plant explorations to collect wild apple species and landraces within China. In this study, we have focused on the apple landraces in the Chinese collection to construct identity cards based on their TP-M13-SSR fingerprints. These might be used in the identification of unknowns and to better understand the diversity within the CAAS apple collection to enhance the value of the collection for preservation, research and utilization purposes and also promote the protection of intellectual property.

2. Materials and Methods

2.1. Plant Material

Leaves were collected from field-grown apple accessions at the IP. A total of 46 Chinese apple landraces were taxonomically classified as follows: M. asiatica (1 accession); M. micromalus (1 accession); M. sieversii (8 accessions); M. domestica subsp. chinensis (2 accessions); M. prunifolia (10 accessions); and M. robusta (24 accessions) (Table 1).

2.2. DNA Extraction and SSR Amplification

Genomic DNA was extracted from leaf tissue using Qiagen DNeasy 96 plant kits (QIAGEN GmbH, Hilden Germany). Fourteen SSR primers were selected for amplification based on previously published studies [23] (Table 2). The M13 primer, 5′ CACGACGTTGTAAAACGA 3′, with fluorescent dye label (6FAM, or VIC or NED), was covalently bound to the 5′ end for detection on the ABI 3730 DNA Analyzer (Applied Biosystems; Carlsbad, CA, USA). The two unlabeled primers consisted of a specific SSR-targeting forward primer with a 5′ M13 tail, and a specific SSR-targeting reverse primer was synthesized by Sangon Biotech (Shanghai, China). Amplification was carried out in two PCR cycles [9]. The first PCR amplification was performed in a 10 μL solution of 20 ng genomic DNA, 1 × PCR buffer, 0.25 mM dNTP, 0.6 unit Taq DNA polymerase, 2 mM MgCl2, 0.24 μM reverse primer and 0.24 μM forward primer with M13 tail. The first PCR amplification was performed under the following conditions: 94 °C (5 min); 35 cycles at 94 °C (30 s)/annealing temperature (An.T) (30 s)/72 °C (45 s); and a final extension at 72 °C for 10 min, using the optimal annealing temperature for each locus (Table 2). The second amplification reaction was performed in a 12.1 μL solution of 10 μL PCR products of the first PCR cycle, 0.3 μM fluorescent labeled M13 primer, 0.1 × supplied PCR buffer and 0.4 units of Taq DNA polymerase. The conditions of the second PCR amplification were as follows: 94 °C (5 min); 16 cycles at 94 °C (30 s)/53 °C (45 s)/72 °C (45 s); and a final extension at 72 °C for 10 min. The PCR products were cleaned with ethanol and then denatured at 94 °C for 5 min. Finally, the fluorescent-labeled PCR products at each locus were separated using an ABI 3730 DNA Analyzer.

2.3. Data Analysis

The putative allele number (Na), the effective allele number (Ne), the expected heterozygosity (He), the observed heterozygosity (Ho) and the Shannon’s information index (I) were calculated for 14 SSR loci by POPGENE version 1.31 software (University of Alberta, AB, Canada) [24]. The number of accessions that could be distinguished per marker was expressed as a percentage.
The following software products were used to analyze the genetic structure of all populations: STRUCTURE 2.3.4 (Pritchard Lab, Stanford University, Stanford, CA, USA) based on the Bayesian model; CLUMPP 1.1.2 (Rosenberg Lab, Stanford University, Stanford, CA, USA) and DISTRUCT 1.1 (Rosenberg Lab, Stanford University, Stanford, CA, USA).
The primers with high Shannon’s information index values and high identification rates were then selected and combined into pairs. Pairs of SSR primers were used to identify all the accessions. We increased the number of primers until all the accessions could be separated. By such means, we obtained a core group of SSR primers.
All the alleles for each pair of primers were arranged in descending order and then assigned values according to this order, beginning with 01. The values of all the alleles at the three SSR loci for all accessions were then combined to form a string for each individual accession. These strings were then converted into bar codes to serve as unique molecular identity cards for all accessions.

3. Results

3.1. Characterization of SSR Loci

A total of 264 alleles were identified with the 14 SSR markers for 46 landrace accessions (Supplementary Materials Table S1). The 14 selected primers were highly polymorphic, with between 10 and 27 alleles amplified per locus (Table 3) and an overall average of 18.9 alleles per locus. The expected heterozygosity ranged from 0.8092 for marker CH01f03b to 0.9185 for marker CH04h02, with an average of 0.8719 across the loci. The observed heterozygosity ranged from 0.0851 for marker CH01f03b to 0.9362 for marker CH05h12, with an average of 0.7356 across the loci. The Shannon’s information index data revealed that the loci were informative. The Shannon’s information index ranged from 1.9134 for marker CH01f03b to 2.7592 for marker CH04h02, with an average of 2.4234 across the loci. (Table 3). The number of apple accessions that could be identified at every locus ranged from 12 to 35, with an average of 28 across the loci. About 26% of the accessions could be differentiated based on marker CH01f03b alone. The identification ratio ranged from 26.09% for marker CH01f03b to 76.09% for marker CH04e03, with an average of 61.01%. No single SSR marker selected in this study was able to distinguish all the accessions.

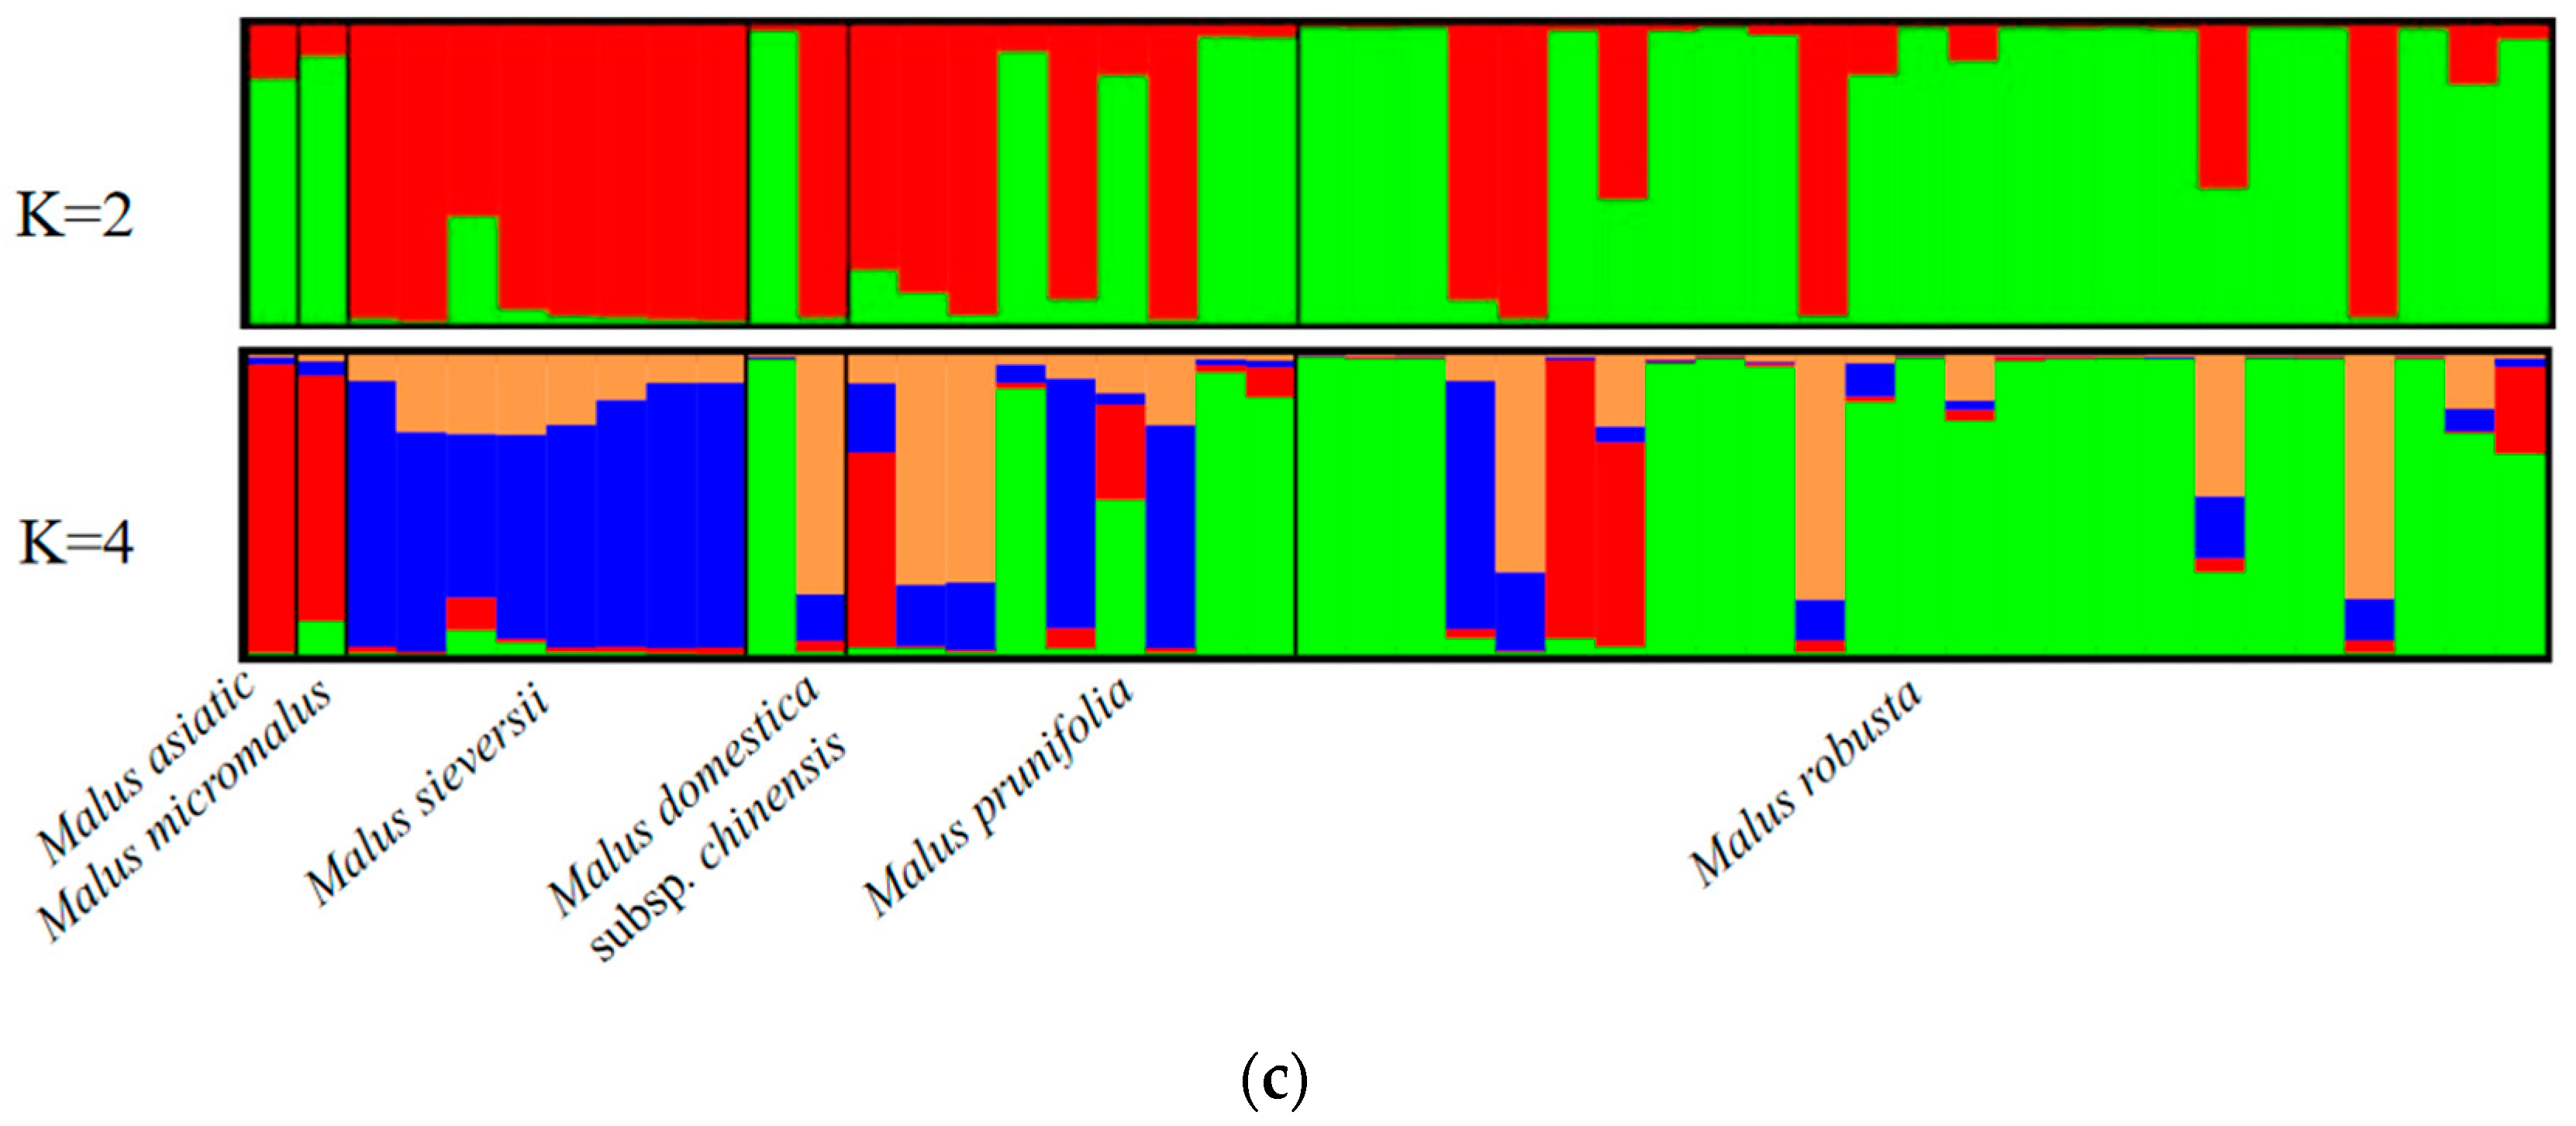
3.2. Genetic Structures of Six Populations

The 14 SSRs were also used to determine the genetic structures among the 46 accessions of Malus. The plot of the average log likelihood values for Ks ranging from 1 to 10 and the distribution of 1 K-values [25] according to K-values are shown in Figure 1. Two peaks were found, with the strongest level of population subdivision at K = 2 and another at K = 4. According to the distribution of each material’s Q value, when Q ≥ 0.8, the accession was considered pure [26].
At K = 2, the six species of Malus were divided into two groups: a green genetic cluster and a red genetic cluster. The green genetic cluster had 26 pure accessions: 1 accession of Malus asiatica; 1 accession of Malus micromalus; 1 accession of Malus domestica subsp. Chinensis; 4 accessions of Malus prunifolia; and 19 accessions of Malus robusta. The red genetic cluster had 17 pure accessions: 1 accession of Malus domestica subsp. Chinensis; 5 accessions of Malus prunifolia; 7 accessions of Malus sieversii; and 4 accessions of Malus robusta.
At K = 4, the six species of Malus were divided into four groups: a green genetic cluster, a red genetic cluster, a blue genetic cluster and an orange genetic cluster. The red genetic cluster had three pure accessions: one accession of Malus asiatica, one accession of Malus micromalus and one accession of Malus robusta. The green genetic cluster had 20 pure accessions: 1 accession of Malus domestica subsp. chinensis, 1 accession of Malus sieversii, 3 accessions of Malus prunifolia and 15 accessions of Malus robusta. The orange genetic cluster had two pure accessions: both of Malus robusta. The blue genetic cluster had six pure accessions: four accessions of Malus sieversii, one accession of Malus prunifolia and one accession of Malus robusta.

3.3. Selection of the Core Group of SSR Primers and Construction of TP-M13-SSR Fingerprints

The identification results for all accessions at every locus indicated that it was not possible to distinguish all landraces using only one primer. Because the final purpose of the study was to distinguish all accessions using the lowest number of SSR primers, we then proceeded as follows: Based on the Shannon’s information index and identification rate at every loci, different combinations of SSR markers were formed, and their identification rates were determined. First, for primers CH04e03, CH04h02, CH05b06, CH01f07a and CH04g07 with high Shannon’s information index and identified rate, the fingerprints of every two primers got together to identify all accessions. Group 4 of primers could not distinguish six accessions from Malus sieversii and Malus robusta. Group 8 of primers could not distinguish four accessions from Malus prunifolia and Malus robusta. The accessions that could not be distinguished by the other groups of primers all belonged to Malus robusta. The three groups of primers with the highest identification rate of 95.65% were able to distinguish 44 accessions (Table 4). We then added to the number of primers in each of these groups until we obtained one group of three primers: CH04h02, CH01f07a and CH04g07, which could distinguish all 46 apple landraces. These were then considered core primers. Subsequently, the fingerprints of all landraces would be constructed by using these three primers—for example, ‘Huahong’ (Figure 2).

3.4. Encoding Molecular Identities

Based on the fingerprints of all accessions, the three core loci CH04h02, CH01f07a and CH04g07 were selected. All of their alleles were arranged in descending order and assigned values beginning with 01 (Table 5). By combining all values of every accession for the alleles of the three primers, a particular string for every accession was obtained (Table 6). Finally, the strings were converted into bar codes to serve as unique molecular identity cards for accessions—for example, the molecular identity card of ‘Huahong’ (Figure 3).

4. Discussion

4.1. The System of Constructing Molecular Identities Based on Fingerprints

DNA fingerprints are the basis for the construction of molecular identity cards. Although molecular identity cards and fingerprints serve the same function, they are based on different concepts. Fingerprints are electrophoretic patterns which can reveal differences between individuals, but molecular identity cards digitize DNA fingerprints to enable a more intuitive approach to germplasm retrieval [12]. Molecular identity cards make it easier to distinguish between individuals. Once the molecular identity card is produced, it can be used as a standard for identifying germplasm resources. The production of a molecular identity card involves eight steps, as follows: (1) the selection of efficient primers; (2) PCR system optimization; (3) the detection of the PCR product; (4) the collection of fingerprint data; (5) screening combinations of the core primers combination for all apple accessions; (6) the construction of fingerprints; (7) the encoding of the molecular identity card; (8) the conversion into a bar code for use as a molecular identity card. Molecular identity cards produced by this method can be used to identify previously unknown Chinese landraces if they match the materials in the IP.

4.2. Genetic Diversity of Malus

In this study, we used 14 SSR primers to characterize the genetic diversity among six species of Malus native to China. The mean number of alleles per locus (Na) amplified in all loci was 18.9, which was higher than the values recorded for collections in other countries, e.g., a value of 7.66 with 41 accessions in Spain [27], a value of 10 with 56 accessions in Portugal [28] and a value of 7.5 with 27 accessions in Morocco [29]. This result meant that the 14 SSR primers in our study exhibited high polymorphism and could be used to analyze the genetic diversity of apple landraces in China. The genetic diversity level of Malus landraces from China (Ne = 8.1693, He = 0.8719) was higher than that of apple germplasms in Spain (Ne = 3.95, He = 0.71), Morocco (Ne = 4.62, He = 0.76) and Portugal (Ne = 4.765, He = 0.749). One possible reason for this finding is that all the accessions in this study originated in China, which is one of the centers of origin of Malus and the largest center of genetic diversity, with rich germplasm resources.
In our study, we found that a combination of three markers could distinguish 46 accessions. More accessions may require more loci, as in the study of Galli et al., in which four loci were needed to distinguish 66 accessions [30], and that of Gao et al., in which six loci were needed to distinguish 314 accessions [31].

4.3. Genetic Structure of Malus

Using STRUCTURE software analyses, we found that when K = 2, Malus sieversii was wholly grouped within the red genetic cluster, while Malus robusta was mainly grouped within the green genetic cluster. The two clusters had gene penetrance. When K = 4, the six species of Malus were divided into four groups. The four potential genetic sources were Malus asiatica, Malus micromalus (red cluster), Malus sieversii (blue cluster), Malus robusta (green cluster) and Malus robusta (orange cluster). It is worth noting that pure accessions within the green genetic cluster were detected in three species, i.e., Malus prunifolia, Malus domestica subsp. chinensis and Malus sieversii. However, pure accessions of the orange genetic cluster were only detected in Malus robusta. In the populations of Malus domestica subsp. chinensis and Malus prunifolia, we also found some accessions with an almost pure gene pool. This indicated that Malus robusta, Malus prunifolia and Malus domestica subsp. chinensis have high-frequency gene exchange. Malus sieversii had the greatest number of pure accessions of the blue genetic cluster. Malus domestica subsp. chinensis was believed to originate from Malus sieversii [1]; however, we found that Malus domestica subsp. chinensis harbored small proportions of genes from the blue cluster, which was similar to GAO’s result [32]. Gao et al. think that Malus robusta may take part in the origin and evolution of a part of Malus domestica subsp. chinensis [33]. This may explain why accession 11 harbored large proportions of genes from the green cluster in the current study. In addition, Xiao et al. [34] thought that Malus prunifolia originated from Malus sieversii, and this idea is supported by our finding that accession 17 and accession 19 harbored large proportions of genes from the blue cluster. Finally, in the group of Malus robusta, we found four different pure accessions, which showed that Malus robusta had high-frequency gene exchange with other species.

4.4. The Construction of Molecular Identities Using Tp-M13-SSR

The use of molecular markers with high stability and high accuracy is an important prerequisite for constructing molecular identity cards. SSR markers have been shown to be molecular markers with high stability and high accuracy [35,36]. The TP-M13-SSR technique based on the DNA sequencer can detect the exact size of the target DNA fragment and distinguish different fragments with differences of only 2 bp [37], thus achieving the efficient and accurate collection of molecular data for SSR markers [38]. In a previous study of other crops, the results of SSR capillary electrophoresis were verified by polyacrylamide gel electrophoresis and found to be exactly the same [12]. This demonstrated that SSR capillary electrophoresis can accurately detect the target DNA fragments and obtain reliable results. Compared to other molecular markers, TP-M13-SSR markers are more stable, accurate, efficient and, therefore, more suitable for the detection and analysis of large quantities of apple germplasm resources. This has also been demonstrated in some studies on pea [39] and rice [40].
The selection of suitable primers is another important prerequisite. The polymorphisms of SSR primers selected in this study were good, and three pairs of primers were able to distinguish all landraces. However, with increased numbers of accessions, it may be that some accessions with the same SSR loci cannot be identified, especially accessions with extremely few mutants such as: budding material, etc. For this reason, it is necessary to increase the SSR loci and to screen those with variation so that the greatest number of apple accessions can be distinguished with the lowest number of SSR primers. TP-M13-SSR markers can be used in a relatively inexpensive way to collect the detection date, and it is unnecessary to redetect the materials as the number of primers increases. For this reason, the use of TP-M13-SSR markers is conducive to the accumulation of a basic molecular database for apple studies.

4.5. The Encoding of Molecular Identities of Malus

For the construction of molecular identity cards, different encoding methods can be used. At present, three main types of encoding methods are used by researchers [11]. According to the characteristics of the research materials, and complying with convenient statistics and writing easily, the encoding methods should be selected. In this study, all the alleles for every pair of primers were arranged in descending order, and values were assigned to them, according to this order, beginning with 01. All the values of all the alleles at 14 SSR loci for every accession were arranged together to form strings. These strings were then converted into bar codes, thereby producing unique molecular identity cards for all accessions. Given the variety of bar codes presently available, the choice of bar code should be made according to the informative content and the size of the string in each instance.
Once bar codes are identified, trees can be labeled and scanned, aiding in the identification and tracking of gene bank collections. By the use of this method of constructing molecular identity cards for Malus, the gene bank management of the genus can be improved.

Supplementary Materials

The following supporting information can be downloaded at: https://www.mdpi.com/article/10.3390/agronomy13051262/s1, Table S1: The fingerprints of all landraces by the use of 14 primers.

Author Contributions

Conceptualization, Y.G. and L.W.; methodology, D.W.; software, L.W.; validation, K.W.; formal analysis, S.S.; investigation, X.L., Z.L. (Zhao Liu) and Q.L.; data curation, Z.L. (Zichen Li); supervision, Y.G.; writing—original draft preparation, L.W.; writing—review and editing, G.W. and W.T. All authors have read and agreed to the published version of the manuscript.

Funding

This research was funded by the Natural Science Foundation of Liaoning (2021-BS-024) and the Chinese Academy of Agricultural Sciences—Agricultural Science and Technology Innovation Program (CAAS-ASTIP—2021-RIP-02).

Institutional Review Board Statement

Not applicable.

Informed Consent Statement

Not applicable.

Data Availability Statement

Not applicable.

Conflicts of Interest

The authors declare no conflict of interest.

References

  1. Li, Y.N. Resarches of Malus Mill. Germplasm Resources; China Agriculture Press: Beijing, China, 2001; pp. 125–141. [Google Scholar]
  2. Dong, Y.C.; Liu, X. Crops and Their Wild Relatives in China; China Agriculture Press: Beijing, China, 2006; pp. 55–84. [Google Scholar]
  3. Li, Y.N.; Li, X.L. Research on peroxidase isozyme in Malus Mill. J. Southwest Agric. Univ. 1995, 5, 371–377. [Google Scholar]
  4. Shi, Y.S.; Luo, J.X. Comparison of peroxidese zymogrames of ‘Delicious’ apple cultivers. J. Tianjin Agric. Coll. 1995, 1, 11–14. [Google Scholar]
  5. Wang, A.D.; Li, T.Z.; Xu, X.F.; Han, Z.H. Analysis for apple cultivars. Acta Hortic. Sin. 2005, 5, 875–877. [Google Scholar]
  6. Zhu, J.; Wang, T.; Zhao, Y.J.; Zhang, W.; Li, G.C. Identification of apple varieties with AFLP molecular markers. Acta Hortic. Sin. 2007, 2, 102–106. [Google Scholar]
  7. Gao, Y.; Liu, F.Z.; Cao, Y.F.; Wang, K. SSR analysis of genetic relationship for apple germplasm resources. J. Fruit Sci. 2007, 2, 129–134. [Google Scholar]
  8. Gao, Y.; Wang, K.; Tian, L.M.; Cao, Y.; Liu, F.Z. Identification of apple cultivars by TP-M13-SSR technique. J. Fruit Sci. 2010, 5, 833–837. [Google Scholar]
  9. Gao, Y.; Wang, K.; Tian, L.M.; Cao, Y.F.; Liu, F.Z. TP-M13-SSR technique and its applications in analysis of genetic diversity for apple germplasm resources. J. Plant Genet. Resour. 2011, 2, 228–233. [Google Scholar]
  10. Cao, Y.F.; Tian, L.M.; Gao, Y.; Liu, F.Z. Genetic diversity of cultivated and wild Ussurian Pear (Pyrus ussuriensis Maxim.) in China evaluated with M13-tailed SSR markers. Genet. Resour. Crop Evol. 2012, 59, 9–17. [Google Scholar] [CrossRef]
  11. Chen, C.W.; Cao, K.; Wang, L.R.; Zhu, G.R.; Fang, W.C. Molecular ID establishment of main China peach varieties and peach related species. Sci. Agric. Sin. 2011, 10, 2081–2093. [Google Scholar]
  12. Xu, L.F.; Ge, L.; Yuan, S.X.; Ren, J.F.; Yuan, Y.Y.; Li, Y.Y.; Liu, C.; Ming, J. Using the fluorescent labeled SSR markers to establish molecular identity of Lily germplasms. Acta Hortic. Sin. 2014, 10, 2055–2064. [Google Scholar]
  13. Ai, C.X.; Zhang, L.S.; Wei, H.R.; Yuan, K.J.; Jin, S.N.; Liu, Q.Z. Construction of molecular fingerprinting database for sweet cherry using SSR markers. Chin. Agric. Sci. Bull. 2007, 5, 55–58. [Google Scholar]
  14. Ohtsubok, K.; Nakamuras, S. Cultivar identification of rice (Oryza sativa L.) by polymerase chain reaction method and its application to processed rice products. J. Agr. Food Chem. 2007, 55, 1501–1509. [Google Scholar] [CrossRef] [PubMed]
  15. Yan, J.W.; Tian, D.G.; Xu, Y.; Wang, F. Constructing SSR molecular database for identity system of hybrid rice parents. Fujian J. Agric. Sci. 2011, 2, 148–152. [Google Scholar]
  16. Pan, Y.B. Databasing molecular identities of sugarcane (Saccharum spp.) clones constructed with microsatellite (SSR) DNA markers. Am. J. Plant Sci. 2010, 1, 87–94. [Google Scholar] [CrossRef] [Green Version]
  17. Liu, X.L.; Ma, L.; Chen, X.K.; Ying, X.M.; Cai, Q.; Liu, J.Y.; Wu, C.W. Establishment of DNA fingerprint ID in sugarcane cultivars in Yunnan. Acta Agron. Sin. 2010, 2, 202–210. [Google Scholar]
  18. Yang, Y.; Liu, Z.; Zhao, Y.; Liang, G.Q. Construction of DNA fingerprints for tea cultivars originated from Hunan province. J. Tea Sci. 2010, 5, 367–373. [Google Scholar]
  19. Liu, Q.; Dai, Z.G.; Chen, J.Q.; Wen, L.; Gong, Y.C.; Su, J.G. Establishment of molecular identity for kenaf germplasm using SRAP marker. Sci. Agric. Sin. 2013, 10, 1974–1983. [Google Scholar]
  20. Qiu, Y.; Li, X.X.; Li, Q.X.; Chen, Y.C.; Shen, D.; Wang, H.P.; Song, J.P. Establishment of the molecular identification for radish germplasm using SSR Markers. J. Plant Genet. Resour. 2014, 3, 648–654. [Google Scholar]
  21. Gao, Y.; Liu, F.Z.; Wang, K.; Wang, D.J.; Gong, X.; Liu, L.J. Establishment of molecular identity card for Malus Mill. originated from China based on the fingerprints of TP-M13-SSR. J. Plant Genet. Resour. 2015, 6, 1290–1297. [Google Scholar]
  22. Gao, Y.; Liu, F.Z.; Wang, K.; Wang, D.J.; Gong, X.; Liu, L.J. Establishment of molecular ID for some apple germplasm resources. Sci. Agric. Sin. 2015, 19, 3887–3898. [Google Scholar]
  23. Liebhard, R.; Gianfrancechi, L.; Koller, B.; Ryder, C.D.; Tarchini, R.; Van, D.W.E.; Gessler, C. Development and characterization of 140 new microsatellites in apple (Malus × domestica Borkh.). Mol. Breed. 2002, 10, 217–241. [Google Scholar] [CrossRef]
  24. Yang, R.C.; Yeh, F.C. Multilocus structure in Pinus contorta Dougl. Theor. Appl. Genet. 1993, 87, 568–576. [Google Scholar] [CrossRef] [PubMed]
  25. Evanno, G.; Regnaut, S.; Goudet, J. Detecting the number of clusters of individuals using the software STRUCTURE: A simulation study. Mol. Ecol. 2005, 14, 2611–2620. [Google Scholar] [CrossRef] [Green Version]
  26. Sau, S.; Pastore, C.; D’hallewin, G.; Dondini, L.; Bacchetta, G. Characterisation of microsatellite loci in Sardinian pears (Pyrus communis L. and P. spinosa Forssk.). Sci. Hortic. 2020, 270, 109443. [Google Scholar] [CrossRef]
  27. Arnal, A.; Gogorcena, Y.; Tardío, J.; Roldán-Ruiz, I.; Lázaro, A. Simple Sequence Repeat Characterisation of Traditional Apple Cultivars (Malus domestica Borkh.) Grown in the Region of Madrid (Central Spain). Plant Mol. Biol. Rep. 2020, 38, 676–690. [Google Scholar] [CrossRef]
  28. Ferreira, V.; Ramos-Cabrer, A.M.; Carnide, V.; Pinto-Carnide, O.; Assunção, A.; Marreiros, A.; Rodrigues, R.; Pereira-Lorenzo, S.; Castro, I. Genetic pool structure of local apple cultivars from Portugal assessed by microsatellites. Tree Genet. Genomes 2016, 12, 36. [Google Scholar] [CrossRef]
  29. Khachtib, Y.; Zinelabidine, L.H.; Bouda, S.; Hamdali, H.; Hammada, S.; Haddioui, A. Genetic characterization of cultivated apple (Malus x domestica Borkh.) in Morocco using microsatellite (SSR) markers. Ecol. Genet. Genom. 2022, 23, 100122. [Google Scholar] [CrossRef]
  30. Galli, Z.; Halasz, G.; Kiss, E.; Heszky, L.; Dobranszki, J. Molecular identification of commercial apple cultivars with microsatellite markers. Hortscience 2005, 40, 1974–1977. [Google Scholar] [CrossRef] [Green Version]
  31. Gao, Y.; Wang, K.; Wang, D.J.; Gong, X.; Liu, L.J.; Liu, F.Z. Molecular ID Establishment of Apple Cultivars by TP-M13-SSR. Acta Hortic. Sin. 2016, 43, 25–37. [Google Scholar]
  32. Gao, Y.; Wang, D.J.; Wang, K.; Cong, P.H.; Li, L.W.; Piao, J.C. Genetic relationship and structure analysis of 15 species of Malus Mill. based on SNP markers. Sci. Agric. Sin. 2020, 53, 3333–3343. [Google Scholar]
  33. Gao, Y.; Wang, D.J.; Wang, K.; Cong, P.H.; Li, L.W.; Piao, J.C. Genetic diversity and population structure of 17 species of Malus Mill. native to China based on fluorescent SSR analysis. J. Fruit Sci. 2020, 37, 1611–1622. [Google Scholar]
  34. Xiao, Z.A.; Cheng, M.H.; Li, X.L. Reltedness and evolution among populations of Chinese apple species. J. Southwest Agric. Univ. 1986, 2, 108–112. [Google Scholar]
  35. Powell, W.; Morgante, M.; Andre, C.; Hanafey, M.; Vogel, J.; Tingey, S.; Rafalski, A. The comparison of RFLP, RAPD, AFLP and SSR (microsatellite) markers for germplasm analysis. Mol. Breed. 1996, 2, 225–238. [Google Scholar] [CrossRef]
  36. Ming, J.; Zhang, Q.X.; Ru, C.G.; Yan, X.L.; Mao, Q.S. The Evolution of identification of gardening plants with DNA molecular Markers. World For. Res. 2003, 5, 12–16. [Google Scholar]
  37. Li, L.; Yang, J.B.; Mackill, D.J.; Colowit, P.M. Comparison of different detection methods for rice SSR analysis. Chin. J. Rice Sci. 2000, 3, 185–188. [Google Scholar]
  38. Hao, C.Y.; Wang, L.F.; Jia, J.Z.; Dong, Y.C.; Zhang, X.Y. Comparison of fluorescence and silver-staining detection systems of microsatellite markers. Acta Agron. Sin. 2005, 2, 144–149. [Google Scholar]
  39. Gong, Y.M.; Hu, Q.Z.; Mao, W.H.; Li, Y.D.; Zhang, G.W.; Ding, J. Application and evaluation of fluorescent EST-SSR markers detection technique with capillary electrophoresis in pea. Acta Agric. Zhejiangensis 2009, 6, 540–543. [Google Scholar]
  40. Cheng, B.Y.; Xia, J.H.; Gong, J.Y.; Yang, S.H. Application of capillary electrophoresis detection with fluorescent SSR markers in rice DNA fingerprint identification. Chin. J. Rice Sci. 2011, 6, 672–676. [Google Scholar]
Figure 1. Genetic structures of six species of Malus. (a) LnP(D) for each K value; (b) ΔK estimates of the posterior probability distribution of the data for a given K; (c) Population structures of Malus accessions with K = 2 and K = 5.
Agronomy 13 01262 g001aAgronomy 13 01262 g001b
Figure 2. The TP-M13-SSR fingerprinting of ‘Huahong’ at three SSR loci: (a) CH04h02; (b) CH01f07a; and (c) CH04g07.
Agronomy 13 01262 g002
Figure 3. The molecular identity card of ‘Huahong’.
Agronomy 13 01262 g003
Table 1. Apple landrace cultivars sampled from the IP (CAAS Xingcheng, China) and used in genotyping analyses.
No.Accession NameSpeciesNo.Accession NameSpecies
1HuahongM. asiatica24Sankuaishihaitang1M. robusta
2XifuhaitangM. micromalus25XiaofanshanbalengM. robusta
3DongbaiguoM. sieversii26Sankuaishihaitang1shishengM. robusta
4HongguoziM. sieversii27XiaofanshanhaitangshishengM. robusta
5HuochengbaizuoziM. sieversii28MudanjianghaitangshishengM. prunifolia
6KeziaermaM. sieversii29WanbaihaitangshishengM. robusta
7NingmenghaitangM. sieversii30RegunziM. robusta
8AliusitanM. sieversii31LenghaitangM. robusta
9BaihaitangM. sieversii32Xiaofanshanhaitang4M. robusta
10DonghongguoM. sieversii33ZaobaihaitangM. robusta
11Mianpingguodomestica subsp.
chinensis
34RegunzishishengM. robusta
12XiaofanshanbinzishishengM. domestica subsp. chinensis35XiaofanshanbinzishishengM. robusta
13YuanyehaitangM. prunifolia36DaguchengbalenghaitangshishengM. robusta
14PingyaoguchenghaitangM. prunifolia37LuanzhuangshaguoshishengM. robusta
15DaqiuM. prunifolia38XiaofanshanbalenghaitangshishengM. robusta
16DaqiuziM. prunifolia39PingdinghaitangM. robusta
17JilinxiaohuanghaitangM. prunifolia40Sankuaishihaitang2M. robusta
18QiuziM. prunifolia41Xiaofanshanbaleng1M. robusta
19NiumamahaitangM. prunifolia42HonghaitangM. robusta
20DongbeihuanghaitangM. prunifolia43ZisexiaofanshanbalengM. robusta
21Laiwunanyanprunifolia44DuanzhigunziM. robusta
22HebeibalengM. robusta45WanbaihaitangM. robusta
23HebeipingdinghaitangshishengM. robusta46HuailaibalenghaitangM. robusta
Table 2. Primer sequences and optimum annealing temperatures used for genotyping.
Primer NameForward Primer SequenceReverse Primer SequenceAnnealing
Temperature (°C)
CH01f03bF:CACGACGTTGTAAAACGACGAGAAGCAAATGCAAAACCCR:CTCCCCGGCTCCTATTCTAC58
CH02b12F:CACGACGTTGTAAAACGACGGCAGGCTTTACGATTATGCR:CCCACTAAAAGTTCACAGGC59
CH03d07F:CACGACGTTGTAAAACGACCAAATCAATGCAAAACTGTCAR:GGCTTCTGGCCATGATTTTA51
CH04e03F:CACGACGTTGTAAAACGACTTGAAGATGTTTGGCTGTGCR:TGCATGTCTGTCTCCTCCAT60
CH04h02F:CACGACGTTGTAAAACGACGGAAGCTGCATGATGAGACCR:CTCAAGGATTTCATGCCCAC55.5
CH05c06F:CACGACGTTGTAAAACGACATTGGAACTCTCCGTATTGTGCR:ATCAACAGTAGTGGTAGCCGGT58
CH05d08F:CACGACGTTGTAAAACGACTCATGGATGGGAAAAAGAGGR:TGATTGCCACATGTCAGTGTT55.5
CH02a04F:CACGACGTTGTAAAACGACGAAACAGGCGCCATTATTTGR:AAAGGAGACGTTGCAAGTGG58
CH05b06F:CACGACGTTGTAAAACGACACAAGCAAACCTAATACCACCGR:GAGACTGGAAGAGTTGCAGAGG55
CH05d04F:CACGACGTTGTAAAACGACACTTGTGAGCCGTGAGAGGTR:TCCGAAGGTATGCTTCGATT60
CH01f07aF:CACGACGTTGTAAAACGACCCCTACACAGTTTCTCAACCCR:CGTTTTTGGAGCGTAGGAAC59
CH04g07F:CACGACGTTGTAAAACGACCCCTAACCTCAATCCCCAATR:ATGAGGCAGGTGAAGAAGGA57
CH05e04F:CACGACGTTGTAAAACGACAAGGAGAAGACCGTGTGAAATCR:CATGGATAAGGCATAGTCAGGA58
CH05h12F:CACGACGTTGTAAAACGACTTGCGGAGTAGGTTTGCTTTR:TCAATCCTCATCTGTGCCAA60
Underlined sequences indicate the 5′M13 tail.
Table 3. Microsatellite marker diversity measurements for 46 Malus accessions from China at 14 SSR loci.
MarkerNumber of
Observed
Alleles (Na)
Number of Effective
Alleles (Ne)
Expected
Heterozygosity
(He)
Observed
Heterozygosity
(Ho)
Shannon’s
Information
Index
(I)
Accessions
Distinguished
Identification Ratio
CH01f03b105.28340.80920.08511.91341226.09%
CH02b12158.03040.87870.72342.34742758.70%
CH03d07195.96060.83680.87232.28092860.87%
CH04e032210.90720.90990.78722.66013576.09%
CH04h022312.09140.91850.89362.75923371.74%
CH05c06177.27820.87460.78722.40602452.17%
CH05d08185.72030.82980.76602.21892656.32%
CH02a04166.68560.84970.82982.29702452.17%
CH05b062710.90720.90540.76602.74533167.39%
CH05d04196.58540.85810.70212.35013065.22%
CH01f07a2211.41750.91310.72342.68653065.22%
CH04g07228.13850.87960.76602.54783167.39%
CH05e04178.03040.87940.65962.39802963.04%
CH05h12177.33450.86420.93622.31743371.74%
Mean18.98.16930.87190.73562.423428.161.01%
Table 4. Apple accessions distinguished by pairs of primers.
NumberPrimer CombinationAccessions Not DistinguishedIdentification Rate
1CH04e03 and CH04h0223, 24, 25, 4291.30%
2CH04e03 and CH05b0623, 24, 25, 31, 37, 39, 42, 4382.61%
3CH04e03 and CH01f07a24, 25, 31, 4591.30%
4CH04e03 and CH04g074, 6, 23, 24, 25, 3786.96%
5CH04h02 and CH05b0623, 25, 30, 38, 3989.13%
6CH04h02 and CH01f07a38, 3995.65%
7CH04h02 and CH04g0723, 2595.65%
8CH05b06 and CH01f07a18, 24, 38, 3991.30%
9CH05b06 and CH04g0723, 24, 25, 33, 37, 4486.96%
10CH01f07a and CH04g0737, 4095.65%
Table 5. Alleles of three core primers encoded standard.
CodePrimerCodePrimer
CH04h02CH01f07aCH04g07CH04h02CH01f07aCH04g07
0114110415213201208186
0216310815614203210188
0317711216015205212190
0418311616416211214192
0518518416617213216194
0618718616818215218200
0718919017419217220202
0819119217620219224206
0919319417821221244210
1019519618022247−9−9
1119720218223−9
1219920618424
Table 6. The fingerprints of all landraces obtained using the three core primers.
No. of
Accession
Molecular IdentityNo. of
Accession
Molecular IdentityNo. of AccessionMolecular Identity
10610121508111706111213081833051914160608
20312131306071806152222071234061615150212
30514141802141910211416061535232310140606
40707171906102001021217061236061313150512
50608171712132105190514051837061613170606
60716091506102206081517010538061613170506
70607051503112323232222051239131613150512
80709121710142406082222010540101322220612
90509141802192506101221171741232317200505
101018121706152611160308051642062001040606
111619222205062708080911041243060802020609
120409171906092808090812122044051913130113
130512071408082906080917222245161909150505
140917222206063005131313020646030817170721
1504080912060631162205140512
1606191516050732040806160609
Disclaimer/Publisher’s Note: The statements, opinions and data contained in all publications are solely those of the individual author(s) and contributor(s) and not of MDPI and/or the editor(s). MDPI and/or the editor(s) disclaim responsibility for any injury to people or property resulting from any ideas, methods, instructions or products referred to in the content.

