Article

Development and Deployment of High-Throughput Retrotransposon-Based Markers Reveal Genetic Diversity and Population Structure of Asian Bamboo

by
Shitian Li
1,†,
Muthusamy Ramakrishnan
1,†,
Kunnummal Kurungara Vinod
2,
Ruslan Kalendar
3,4,
Kim Yrjälä
1,5 and
Mingbing Zhou
1,6,*
1
State Key Laboratory of Subtropical Silviculture, Zhejiang A&F University, Lin’an, Hangzhou 311300, China
2
Division of Genetics, ICAR-Indian Agricultural Research Institute, New Delhi 110012, India
3
Department of Agricultural Sciences, Viikki Plant Science Centre and Helsinki Sustainability Centre, University of Helsinki, P.O. Box 27 (Latokartanonkaari 5), FI-00014 Helsinki, Finland
4
RSE, National Center for Biotechnology, 13/5, Kurgalzhynskoye road, Nur-Sultan 010000, Kazakhstan
5
Department of Forest Sciences, University of Helsinki, 00014 Helsinki, Finland
6
Zhejiang Provincial Collaborative Innovation Center for Bamboo Resources and High-Efficiency Utilization, Zhejiang A&F University, Lin’an, Hangzhou 311300, China
*
Author to whom correspondence should be addressed.
These authors contributed equally to this article.
Forests 2020, 11(1), 31; https://doi.org/10.3390/f11010031
Submission received: 31 October 2019 / Revised: 14 December 2019 / Accepted: 17 December 2019 / Published: 24 December 2019
(This article belongs to the Special Issue Genetics and Improvement of Forest Trees)

Abstract

:
Bamboo, a non-timber grass species, known for exceptionally fast growth is a commercially viable crop. Long terminal repeat (LTR) retrotransposons, the main class I mobile genetic elements in plant genomes, are highly abundant (46%) in bamboo, contributing to genome diversity. They play significant roles in the regulation of gene expression, chromosome size and structure as well as in genome integrity. Due to their random insertion behavior, interspaces of retrotransposons can vary significantly among bamboo genotypes. Capitalizing this feature, inter-retrotransposon amplified polymorphism (IRAP) is a high-throughput marker system to study the genetic diversity of plant species. To date, there are no transposon based markers reported from the bamboo genome and particularly using IRAP markers on genetic diversity. Phyllostachys genus of Asian bamboo is the largest of the Bambusoideae subfamily, with great economic importance. We report structure-based analysis of bamboo genome for the LTR-retrotransposon superfamilies, Ty3-gypsy and Ty1-copia, which revealed a total of 98,850 retrotransposons with intact LTR sequences at both the ends. Grouped into 64,281 clusters/scaffold using CD-HIT-EST software, only 13 clusters of retroelements were found with more than 30 LTR sequences and with at least one copy having all intact protein domains such as gag and polyprotein. A total of 16 IRAP primers were synthesized, based on the high copy numbers of conserved LTR sequences. A study using these IRAP markers on genetic diversity and population structure of 58 Asian bamboo accessions belonging to the genus Phyllostachys revealed 3340 amplicons with an average of 98% polymorphism. The bamboo accessions were collected from nine different provinces of China, as well as from Italy and America. A three phased approach using hierarchical clustering, principal components and a model based population structure divided the bamboo accessions into four sub-populations, PhSP1, PhSP2, PhSP3 and PhSP4. All the three analyses produced significant sub-population wise consensus. Further, all the sub-populations revealed admixture of alleles. The analysis of molecular variance (AMOVA) among the sub-populations revealed high intra-population genetic variation (75%) than inter-population. The results suggest that Phyllostachys bamboos are not well evolutionarily diversified, although geographic speciation could have occurred at a limited level. This study highlights the usability of IRAP markers in determining the inter-species variability of Asian bamboos.

1. Introduction

Bamboo, a monocot and a major grass genera, is a group of evergreen flowering plants belonging to the subfamily Bambusoideae of the family Poaceae [1]. Although the proliferation of bamboo occurs predominantly through rhizomes, most bamboos do reproduce through seeds, flowering at least once in a lifetime. Usually, flowering intervals are long and vary between species, ranging from several to hundreds of years [2,3,4]. More than 1642 bamboo species from 75 genera are known (https://www.inbar.int), among which 100 species are commercially cultivated over 30 million hectares worldwide, particularly in Asia. Several members of the bamboo, including Asian bamboo, are recognised as fast-growing plants, growing up to a height of 35–50 m and up to 30 cm in diameter (https://www.inbar.int). Among cultivated bamboo species, the Asian bamboo can grow at a maximum rate of 100 cm a day and produces huge biomass [5].
Most Asian bamboo species are native to China, although some are known to grow in India, Vietnam and Myanmar. These bamboos account for approximately 0.8% of the forest area worldwide. Some species were introduced to Japan a hundred years ago and became naturalised. More recently, a few naturalized species from Australia, Europe and the Americas have been reported [6]. Most Asian bamboos belong to the genus Phyllostachys in the tribe Arundinarieae. They are chiefly temperate woody bamboos and are tetraploids (2n = 4x = 48) with a 2B karyotype pattern.
Bamboo wood is a non-timber natural raw material having notable industrial importance and economic value in South Asia [7]. Asia is the largest producer of bamboo products in the world, with annual international trade amounting to more than 2.5 billion US dollars (https://www.inbar.int). In spite of being an economically important perennial species, commercial bamboo remains mostly confined to natural populations. Further, the genetic diversity of bamboos has not adequately been explored. The major reasons were the difficulty in assessing the phenotypic variability of clones because of their extended growth period, perennial nature, gigantic size, propagation behavior, non-uniformity of age, long flowering cycle and the extensive area of their natural habitat. However, with the advent of molecular marker-based techniques developed in the 1980s, studies on crop genetic diversity have gained momentum. Subsequently, from 1991, a relatively limited number of molecular fingerprinting studies have been carried out to assess the genetic diversity of the Asian bamboo species using restriction fragment length polymorphism (RFLP), [8,9], randomly amplified polymorphic DNA (RAPD), [10,11], amplified fragment length polymorphism (AFLP), [12,13,14,15,16], simple sequence repeats (SSRs), [17,18], expressed sequence tags-SSR (EST-SSR), [19,20], inter-simple sequence repeats (ISSRs), [15,21] and single-nucleotide polymorphisms (SNP) [22].
In this study, we took advantage of the genome wide abundance of transposable elements to assess genetic variability in bamboo. Transposable elements (TEs) are ubiquitous genetic elements in eukaryotic genomes, capable of self-replicative transposition, affecting genome stability [23,24,25,26,27,28]. Two types of TEs have been identified based on their transposition mechanisms, namely class I retrotransposons and class II DNA transposons [28]. Retrotransposons are RNA-based TEs which duplicate themselves and move within the genome in a semi-conservative manner through a ‘copy-and-paste’ mechanism of an RNA intermediate [28,29,30]. DNA transposons, on the other hand, use a conservative style of transposition and move directly by a ‘cut-and-paste’ mechanism [31,32,33]. Retrotransposons are found in abundance, particularly in plant genomes, outnumbering DNA transposons, accounting for a significant part of the genome such as 68% in wheat [34] and 49%–78% in maize [35,36]. While exploring TEs from 44 bamboo species belonging to 38 genera, Zhou et al. [37] identified TEs as widespread, abundant and diverse in the bamboo genome. In moso bamboo, retrotransposons are reported to occupy 39%–46% [38,39,40] of the genome, accounting for about 65% of the total repetitive elements in the genome [38].
Among the two major types of retroelements, long terminal repeat (LTR)-retrotransposons and non-LTR-retrotransposons, LTR-retrotransposons constitute more than 90% of the retrotransposons found in plant genomes [41,42,43]. They have typical structural features, such as LTR sequences at both ends, transcription and reverse transcription processing signals and target site duplications [24,44]. Additionally, they possess a primer-binding site and a polypurine tract, aiding the synthesis of minus- and plus-strand DNA [45,46]. Based on their characteristics, LTR-retrotransposons are primarily divided into two superfamilies: Ty1-copia and Ty3-gypsy [42]. Recent estimates of the bamboo genome show that 63.2% of the genome is occupied by TEs [40] and 45.7% of the repeat regions belongs to Ty3-gypsy and Ty1-copia types, signifying their role in determining genome size [39]. The genome-wide analysis showed that LTR-retrotransposons are transcriptionally active in the bamboo genome and are responsible for generating 30% of small interfering RNAs (siRNAs) [47]. It has been reported that LTR-retroelements get activated by environmental stress [48,49,50]. Therefore, in the course of genome evolution, LTR-retrotransposon activity could accumulate several variations, making them an ideal source for genome-wide molecular markers [51,52,53,54].
The inter-retrotransposon amplified polymorphism (IRAP) technique produces amplified fragments that are characteristic of a dominant marker [55,56]. Amplification of the IRAP fragment between two LTR-retrotransposons is done using outward-facing primers which anneal to LTR sequences. This method needs neither restriction digestion nor ligation enzyme [57]. Due to technical ease, the IRAP method has been utilized in several studies of the genetic diversity of various plant species. Kalendar et al. [51] studied genetic diversity in barley using IRAP markers, proving their usefulness for diversity studies and the method helped to distinguish between Brazilian and Japanese rice genotypes [58]. Furthermore, it has been used in sunflower [59], Pinus [60], Lilium [61], Persian oak (Quercus brantii Lindl.) and in Bletilla striata [62], and in wild diploid wheat [63] for diversity studies, as well as for population structure and phylogenetic analyses. Guo et al. [62] reported that the results obtained using IRAP markers were similar to those obtained by start codon-targeted (SCoT) markers.
Although LTR-retrotransposons occupy a significant part of the bamboo genome, the genetic diversity information attributable to them remains mostly unknown. Furthermore, no TE-based bamboo markers have been reported to date. In the current study, we report, for the first time, the development of several IRAP markers based on the moso bamboo genome and the use of these markers to assess the IRAP-based genetic diversity and population structure of Phyllostachys bamboo.

2. Materials and Methods

2.1. Plant Material

A total of 58 Asian bamboo accessions were used in the study. The accessions included 47 distinct species belonging to the genus Phyllostachys, of which four species had 15 different varieties shared between them. There were nine varieties of Ph. edulis and two varieties each from Ph. nigra, Ph. bambusoides and Ph. sulphurea. These materials were collected from the forests of the main Asian bamboo growing regions of China spread over the provinces of Zhejiang, Anhui, Sichuang, Jiangxi, Guangdong, Hunan, Henan, Jiangsu and Taiwan. Three species, one sourced from Italy (Ph. nidularia) and two obtained from America (Ph. elegans and Ph. glauca), were also included. The details are listed in Table 1. The collected plant materials were planted and maintained in red soil of a botanical garden of Fujian province. The conservation site has a subtropical monsoon climate with four distinct seasons in the year, an average rainfall from 1270 and 2030 mm a year, and an annual average temperature of 17.5 °C.
Fresh young leaves of the bamboo clones were randomly collected and surface-cleaned by gently rinsing with 70% ethanol and preserved in a polythene bag containing colour-changing silica gel (Tsingke, China). The leaf bags were stored in a deep freezer at −80 °C for further analysis.

2.2. Isolation of Genomic DNA

A modified cetyltrimethylammonium bromide (CTAB) method [64] was used to extract genomic DNA from the leaf samples. For this, the leaf samples were cut into small pieces of sizes from 3.0 to 5.0 mm. An amount of 200 mg of the cut leaf pieces was ground in a mortar using liquid N, and quickly transferred into a sterile centrifuge tube containing 850 µL preheated (65 °C) 2% CTAB extraction buffer containing 20 mM EDTA, 100 mM Tris of pH 8.0, 1.4 M NaCl, 2% CTAB, 200 mg/mL PVP and 1% β-mercaptoethanol. The tubes’ contents were mixed by gentle inversion and incubated at 65 °C for 30 min. The tubes were gently inverted twice every 10 min. After incubation, the tubes were allowed to cool for 15 min at 25 °C. After cooling, an equal volume of ice-cold phenol:chloroform:isoamyl alcohol (25:24:1 v/v) mixture was added to the tube; the contents were gently mixed and centrifuged at 12,000 rpm for 10 min. The clear supernatant was collected in another tube and an equal volume of ice-cold chloroform:isoamyl alcohol (24:1 v/v) mixture was added. The contents were gently mixed and centrifuged again at 12,000 rpm for 10 min and the supernatant was collected. To the supernatant, an equal volume of ice-cold isopropanol was added, and the tubes were kept at −80 °C for one hour to precipitate the DNA. The mix was centrifuged at 12,000 rpm for 5 min and the supernatant was discarded. To the pellet, 600 µL of 75% ice-cold ethanol was added and the tube was left standing for 10 min. The pellet-ethanol mixture was centrifuged at 12,000 rpm for 5 min. This step was repeated twice and the pellet was air-dried at 40 °C and then dissolved in 40 µL 1× TE (10 mM Tris-Cl pH 8.0 and 1 mM EDTA pH 8.0) buffer. The concentration and purity of DNA were quantified by a Nanodrop-spectrophotometer (ND1000, ThermoScientific, Wilmington, DE, USA).

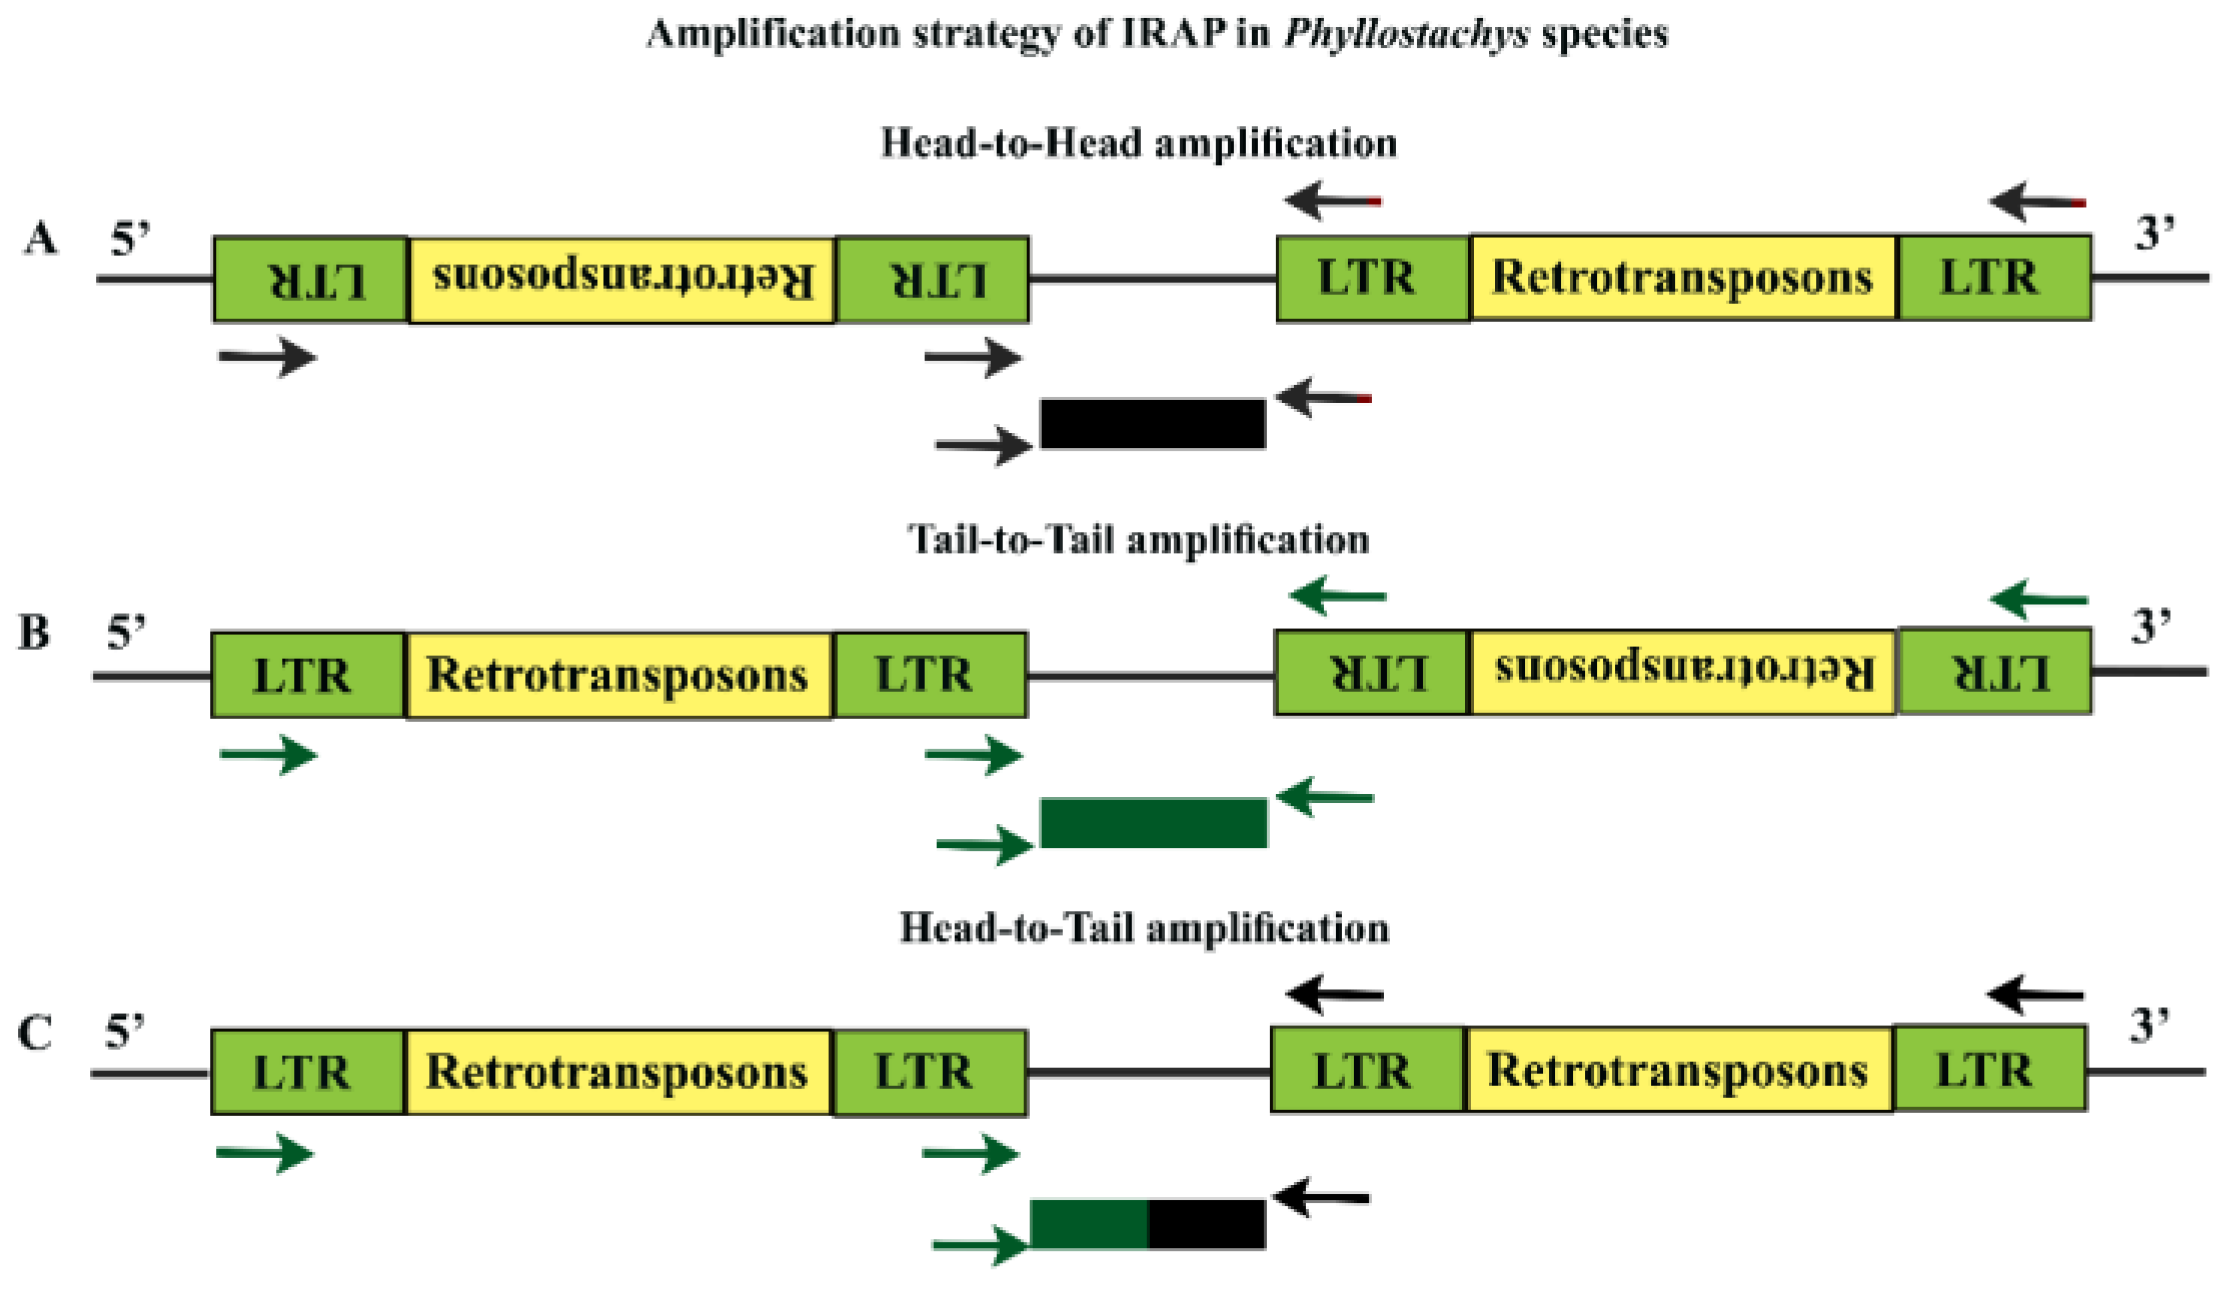
2.3. Isolation of LTR-Retrotransposons and IRAP-Primer Design

In an earlier study from our lab, a total of 2,004,644 LTR-retrotransposon-related sequences were identified in the moso bamboo genome, accounting for about 40% of the moso bamboo genome [39]. The LTR sequences were identified using LTRharvest and LTR digest software [65], and the terminal repeats were analysed for similarity both at 5′and 3′ LTR regions using CD-HIT software [66]. The LTR sequences were divided into different clusters using an incremental clustering algorithm with 95% similarity criteria. LTR sequence clusters with more than 30 copy numbers were chosen as candidate sequences for IRAP primer designing. The primers were designed using Primer Premier 5.0 software (http://www.premierbiosoft.com/) and synthesized by Bioengineering (Shanghai) Co. Ltd., (Shanghai, China). Following this, IRAP primers were used for IRAP fragment amplification using appropriate polymerase chain reaction (PCR) conditions. Primers that generated a low number of amplicons were subsequently excluded from the analysis. A set of IRAP primers which provided a high proportion of alleles were, thus, finally shortlisted.

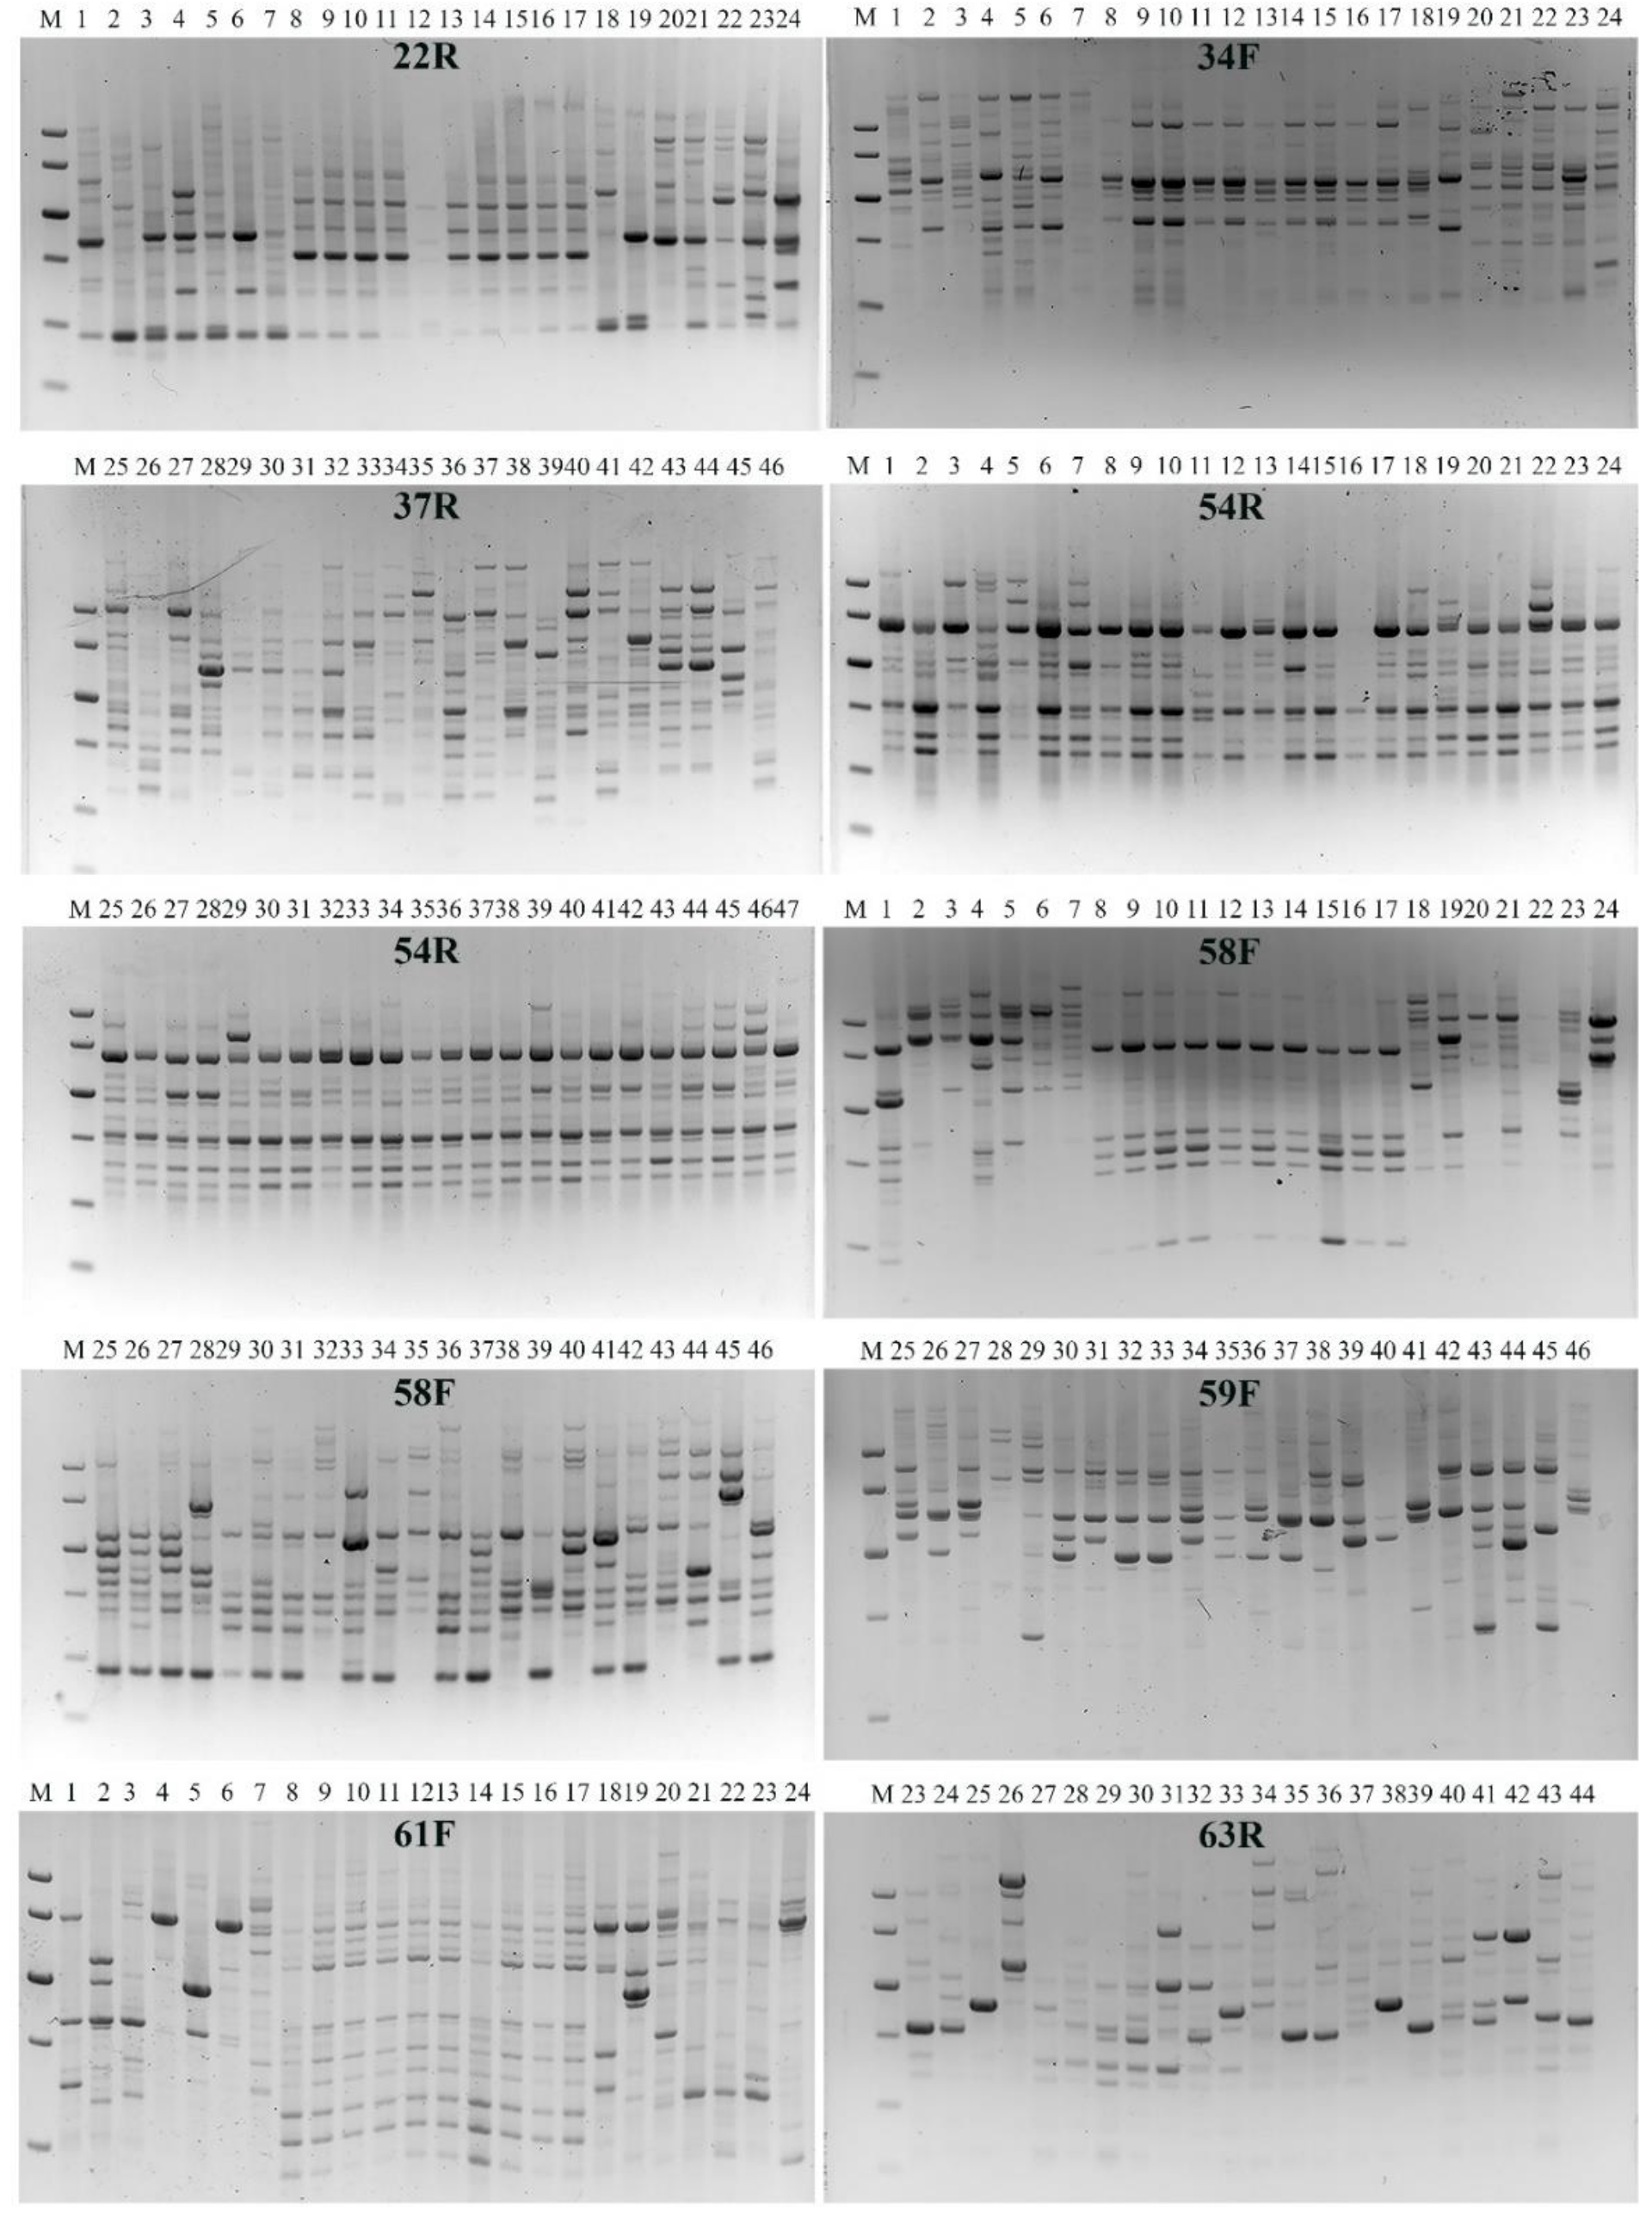
2.4. PCR Amplification of IRAP and Electrophoresis

PCR reactions were performed in 20 µL reaction mixture containing 100 ng genomic DNA, 400 nM primer, and 10 µL PCR master mix (Nanjing Nuoweizan Biotechnology Co., Ltd., Nanjing, China) and the final volume was adjusted to 20 µL by adding nuclease-free water. The annealing temperature of each IRAP primer was determined using gradient PCR. The amplification reaction was carried out in a DNA thermal cycler (DNA Engine® Thermal Cycler—Bio-Rad). The PCR reaction was run at an initial denaturation temperature of 94 °C for 5 min, followed by 35 cycles of 30 s denaturation at 94 °C, 30 s annealing and 1 min extension at 72 °C with a final extension at 72 °C for 7 min. The annealing temperature was readjusted for each IRAP primer. The amplified product was electrophoresed in 1.5% (w/v) agarose gel at 75–80 V for 2.15 h. The separated alleles were visualised by a gel documentation system (Bio-Rad). The alleles were visually scored as 1 = present; 0 = absent using GelQuest software (https://www.sequentix.de/gelquest/).

2.5. Cloning and Sequencing of IRAP Fragments

Since IRAP markers are dominant, it is important to confirm that it is indeed LTR-retrotransposons that are selectively amplified. Alleles showing clear brightness were randomly excised from the agarose gels and were purified using a DNA gel extraction and purification kit (Simgen, Hangzhou, China). The purified fragment was ligated into the pMD18-T vector between the Not I and EcoR V restriction sites (TaKaRa, Shiga, Japan). The ligated product was transformed into Escherichia coli (E. coli) DH5α competent cells. The recombinant E. coli clones were obtained on LB agar plates containing ampicillin (100 μg/μL), X-gal (40 mg) and isopropyl β-d-1-thiogalactopyranoside (IPTG) (160 µg) and kept at 37 °C overnight. White E. coli colonies were selected by the blue-white screening method, and the insertion was verified by PCR using the corresponding IRAP primer, and the amplified fragment was sequenced (Sino Biological Inc., Beijing, China). The sequences were aligned with the original LTR-retrotransposon sequences using MEGA 7 software [67] to confirm correct amplification of the corresponding LTR sequences. Multiple sequence alignment of the PCR product sequences was also carried out with ClustalW, using the Neighbor-joining method with evolutionary distance for construction of phylogenetic tree created [68] in MEGA software with 500 bootstraps.

2.6. Marker Statistics and Genetic Relations

The total number of alleles, range of allele products, percent of polymorphism and the PIC of each IRAP marker was calculated using the binary data of the corresponding PCR amplicon using the formula PIC = 1 − [f2 + (1 − f)2], where ‘f’ is the frequency of the marker in the data set. PIC for dominant markers is a maximum of 0.5 for ‘f’ = 0.5 [69]. Marker allele variation and distribution among the bamboo accessions were also worked out.

2.7. Genetic Distance and Diversity of Bamboo Accessions

The distance/similarity matrix of the bamboo accessions was constructed from allele distribution data. The distance was computed based on Jaccard’s similarity coefficient [70] and was subjected to hierarchical clustering using the unweighted pair-group method with arithmetic average (UPGMA). The UPGMA dendrogram was produced using Free Tree V. 0. 9.1. 50 software [71]. To access the dendogram reliability, over 10,000 bootstrapping (resampling) values were set. The phylogram was visualized by TreeViewX V.0.5.0 software [72].

2.8. IRAP-Statistical Fitness Analysis

To validate the dendrogram and the genetic diversity a statistical fitness analyses were performed using binary data. The cophenetic correlation coefficient (CCC) was estimated between the dendrogram and the observed dissimilarity matrix [70]. Further, 58 Asian bamboo species were classified into different groups using three-dimensional principal component analysis (PCA) based on PC1, PC2, and PC3. The analyses were performed using PAST v. 3.24 software [73], and the scatter plot of three-dimensional PCA was obtained by three-dimension PCA tool, using the OmicShare online tools (http://www.omicshare.com/tools). Both the Broken Stick model and the Jolliffe cut-off value were used to interpret the number of significant components for the total variation obtained from the PCA analysis [74,75,76]. Based on the minimum eigenvalue criteria (of more than 1), significant components were used to calculate the accuracy value with respect to the population structure and hierarchical clustering.

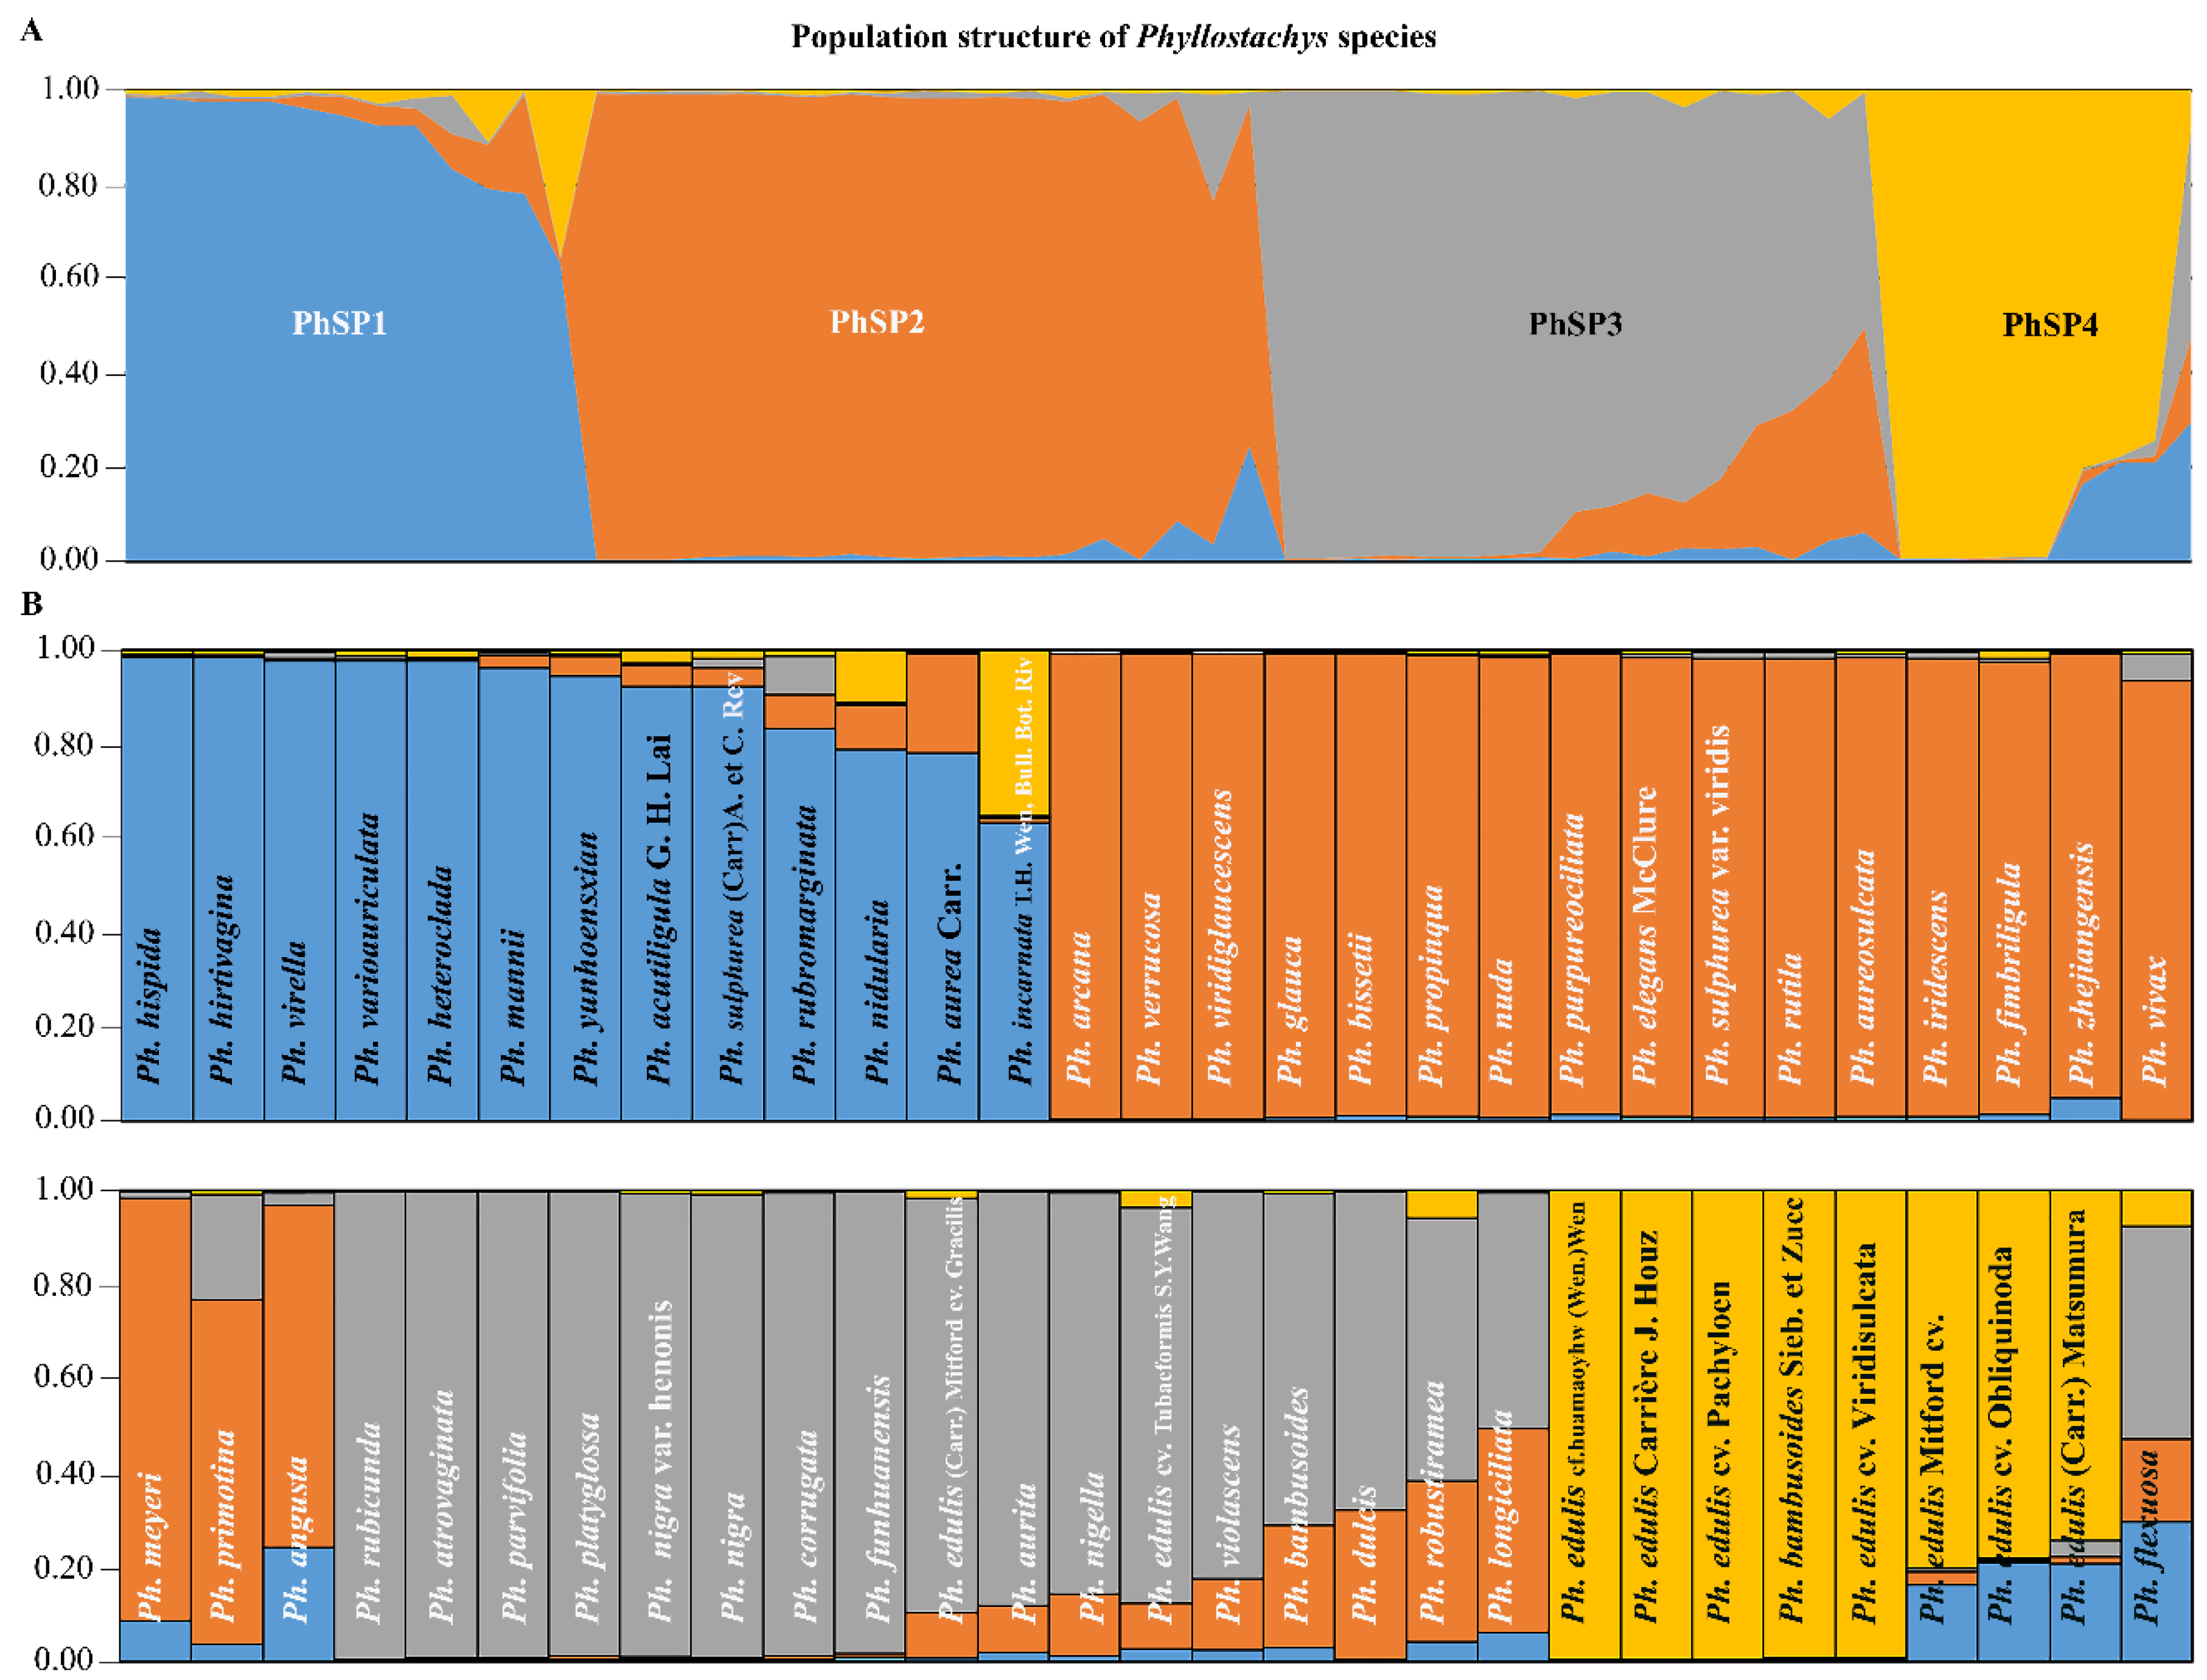
2.9. Analysis of Population Structure

An analysis of population structure and gene flow between the 58 Asian bamboo accessions was performed using a model-based clustering approach to divide the species into sub-populations with the help of STRUCTURE v.2.3.4 software [77]. The program uses Bayesian estimates to identify population structure, under assumptions of admixed ancestry and correlated allelic frequencies using unlinked markers [78]. No prior information was ascribed to the IRAP data while estimating sub-populations. The optimal number of sub-populations (K) was determined by running the programme with K values ranging from 1 to 10, with six independent runs for each K value. To determine the most appropriate K value, the length of the burn-in period parameter was configured to 100,000 and the number of Markov Chain Monte Carlo (MCMC) (Bayesian statistics) replications (simulations) after burn-in was set over 500,000 [79]. The optimum K value was found by an ad hoc statistic ΔK based on the percentage of variation in the log probability of the IRAP marker between successive K values using an online tool, Structure Harvester [80].

2.10. Analysis of Molecular Variance

After determining the sub-populations among the accessions tested, the analysis of the molecular variance (AMOVA) between the sub-populations was estimated using GenAlEx 6.5 software [81]. In the parameter set, a nonparametric permutation and standard permute procedure with 999 pairwise-permutations were used. These values were utilised to measure the total molecular variance between and within the populations.

3. Results

3.1. Development of IRAP Makers and Functionality Assay

A total of 98,850 LTR retrotransposons with both ends of intact LTR sequences were identified in the moso bamboo genome in the present study. The incremental clustering divided these LTR sequences into 64,281 clusters with 95% similarity criteria. Only the clusters that contained more than 30 copies of LTR sequences were considered as candidate clusters for IRAP primer development (Supplementary Table S1). Accordingly, 13 clusters with more than 30 LTR copies and at least one copy of all intact protein domains such as gag and polyprotein were shortlisted, which accounted only 0.02% of the identified clusters. These 13 clusters had a total of 696 copy numbers of LTR sequences, with an average of 53.5 copies per cluster. The highest copy number of 121 was identified in cluster number 3 followed by cluster 4, cluster 15 and cluster 22. Based on the number of clusters and LTR sequence size, a total of 90 markers were initially designed. Each marker was represented by a primer that acted both forward and reverse primers (Figure 1). Among these, 26 primers (29%) that showed proper amplification with clear allele patterns and high reproducibility were shortlisted. Finally, only 16 primers (18%) those showed clearly distinguishable polymorphism, and were, therefore, chosen for further analysis.
A functionality check of the amplicons generated by the selected 16 IRAP markers revealed consistently well-resolved and reproducible amplicon patterns among all the 58 Asian bamboo accessions (Figure 2). There was a total of 215 scorable amplicons (alleles) produced of which 214 were polymorphic (99.5%). Polymorphic alleles were produced with an average of 13.3 alleles per marker. Across the test population, a total of 3282 polymorphic amplicons were generated with an average of 56.6 amplicons per accession. The allele numbers produced per marker ranged between 8 (CL54-R) and 16 (CL34-R and CL63-R) with a size variation ranging from 200 bp to 2700 bp (Table 2).
The marker CL59-F produced the widest range of amplicon sizes, from 200 bp to 2700 bp, while the amplicons generated by the marker CL61-F had the shortest size range, 370–2000 bp. Furthermore, the marker CL34-R produced the highest number of total amplicons (273) in the population followed by CL61-F (260), CL37-R (234), CL3-F (231) and CL42-R (230). All the primers produced 100% polymorphic alleles, except the marker CL22-F, which produced one monomorphic allele and 13 polymorphic alleles showing a polymorphism of 92.8%. The average allele frequency of the IRAP primers ranged between 0.166 (CL22-F) and 0.450 (CL54-R). The polymorphic information content (PIC) values ranged from 0.256 (CL22-F) to 0.400 (CL15-R), having an average of 0.327.

3.2. IRAP Amplicon Variation within and between the Accessions

Of the total of 3340 amplicons obtained, 3282 (98.3%) were polymorphic, and 58 (1.7%) were monomorphic. Among the 47 Phyllostachys species used in this study (Table 1), Ph. edulis generated the highest number of IRAP amplicons, having an average of 60 alleles across its nine varieties. Ph. edulis generated 72 alleles, followed by Ph. edulis cv. viridisulcata with 71 alleles. Nine moso bamboo varieties generated a total of 538 amplicons, of which eight alleles were monomorphic in all the nine moso bamboo varieties. Ninety-four alleles showed no amplification among the Ph. edulis varieties.

3.3. Multiple Sequence Alignment of IRAP-PCR Products

The multiple sequence alignment of IRAP-PCR amplicons using designed IRAP primers proved that they were indeed LTR-retrotransposon sequences. The neighbor-joining phylogenetic tree showed that the IRAP product sequences were genetically different (Figure 3), suggesting that all sixteen IRAP primers amplified unique PCR bands. A total of 14 bootstrap values were obtained, with 9 values ranging from 56% to 100%, which further confirms that the alleles were unique. The above results suggest that LTR-retrotransposon have unique amplicons for genome integrity and sizes.

3.4. Diversity Analysis of Asian Bamboo Accessions

The genetic similarity values of the 58 Asian bamboo accessions are shown in Supplementary Table S2. Jaccard similarity coefficient values ranged from 0.09 to 0.98 with an average similarity value of 0.25 among the 58 accessions. A total of 1653 pair-wise similarity coefficients were obtained, among which only seven pairs showed high similarity that ranged between 0.80 and 0.99. Twenty-eight pair wise similarity coefficients were intermediate, with values ranging from 0.60 to 0.79. A large proportion (1618 or 98% of similarity coefficients) were less than 0.59 (Supplementary Table S2). The lowest similarity coefficient of 0.091 was seen between Ph. longiciliata and Ph. edulis (Carr.) Matsumura followed by that between Ph. arcana and Ph. edulis (Carr.) Matsumura (0.092). The highest similarity of 0.984 was observed between Ph. nigra var. henonis and Ph. edulis cv. Pachyloen, followed by the similarity between Ph. edulis (Carr.) J. Houz and Ph. edulis (Carr.) Mitford cv. Gracilis.
Based on the UPGMA clustering, the bamboo accessions were grouped into five clusters (Figure 4) viz. Phyllostachys clusters, PhC1 to PhC5. The cluster, PhC1 had 19 accessions grouped within, with an average similarity of 0.33. The second cluster, PhC2 which had a mean similarity of 0.34 contained 13 accessions. The cluster PhC3, which had only two accessions had a similarity of 0.26. The highest average similarity of 0.42 was observed in the sub-cluster PhC4, which included 17 accessions. All of the highly similar bamboo accessions were found in this cluster. The remaining sub-cluster, PhC5 encompassed seven accessions, and had average similarity value of 0.33. The clusters themselves showed affinity among themselves, with the first three clusters getting grouped together, as well as the remaining two getting grouped into a separate group. These two groups showed distinct separation with a bootstrap confidence of 100%. In the dendrogram constructed, bootstrap values ranged from 61% to 100% between clusters and the average bootstrap value observed in this study was 81%. For the clusters, PhC1 separated from PhC2 and PhC3 with bootstrap value of 74%, while PhC2 and PhC3 were separate for 91 times out of 100 bootstrap iterations. For the second group, the clusters PhC4 and PhC5 were distinct for 85% of the bootstrap resamplings.
The lowest similarity values observed between several of the accessions studied were due to the highest percentage (98%) of polymorphic bands generated by the IRAP primers. Of the nine varieties of moso bamboo, Ph. edulis, eight were found to be included in PhC4, while the remaining, Ph. edulis cv. tubaeformis, was found to be placed in sub-cluster PhC5. Most Ph. edulis variants were from the Zhejiang, Jiangsu and Jiangxi provinces of China (Table 1). Among 25 accessions collected from the Zhejiang province of China were found placed in different clusters. No specific clusters represented the species collected from the Zhejiang and Anhui province. The species collected from the Jiangsu province of China were grouped in clusters PhC1 and PhC4, and those from Henan provinces in PhC1 and PhC2. Moreover, two varieties of Ph. nigra were found to be distributed between PhC2 and PhC4. Similar was the case with two varieties belonging to the species, Ph. bambusoides. However, varieties of Ph. sulphurea were found to be included in PhC1 and PhC4. The bootstrap value for Ph. nigra var. henonis and Ph. edulis cv. Pachyloen as well as for Ph. edulis cv. Tubaeformis S.Y.Wang and Ph. sulphurea (Carr)A. et C. Riv was 100%. A bootstrap confidence of 98% was seen for Ph. edulis (Carrière) J. Houz and Ph. edulis (Carr.) Mitford cv. Gracilis. The bootstrap values clearly displayed that a good majority (79%) of cluster nodes were well fitted. None of the nodes were found with very low bootstrap value. Based on the resampling method, it was confirmed that the IRAP markers markedly distinguished the Asian bamboo accessions.

3.5. Statistical Fitness Analysis of Clustering Pattern

Two different statistical analyses such as cophenetic correlation coefficient (CCC) and principal component analysis (PCA) were carried out to confirm the grouping pattern of the Asian bamboo species. The CCC value of 0.8848 confirmed that hierarchical clustering was in significant agreement with the similarity matrix obtained from Jaccard similarity coefficients. Based on the IRAP markers the 58 Asian bamboo accessions indicated significant genetic diversity at those loci.
Three-dimensional PCA of the 58 Asian bamboo accessions, based on the variance-covariance matrix, displayed 13%, 7.9%, and 6.5% of the total variance for the first, second, and third component axes, respectively (Figure 5). A total of 57 axes (principal components) were extracted of which five components were retained based on the broken-stick model (Supplementary Figure S1). The selected components accounted for 38.1% of total variation. Three-dimensional plotting of bamboo accessions based on first three components showed four groups (Figure 5). Further resolution of the genotype grouping using hierarchical clustering of Euclidean distances based on the component scores for the five significant PCs, indicated the members under each group. The first group (Group 1) showed grouping of 13 accessions, Group 2 contained 19 accessions, Group 3 had 18 accessions and Group 4 with eight accessions (Figure 6). Comparing the clusters based on the Jaccard’s similarity coefficients, the Group 1 had members drawn from PhC4 and PhC5, while Group 4 was almost entirely was drawn from PhC4, and contained seven out of nine Ph. edulis accessions used in the study. The Group 2 was exactly similar to PhC1 in both number and membership of accessions. The remaining group, Group 3 contained all the accessions that were members of PhC2 and PhC3, together with three accessions drawn from PhC4 and PhC5. The grouping pattern of the accessions revealed that based on the IRAP polymorphism, Group 2 was more robust and isolated from the subsequent groups of Group 3, Group 1 and Group 4. Group 2 had an accuracy value of 100%, followed by Group 3 (83%), Group 1 (54%) and Group 4 (47%) from the dendrogram based clusters.

3.6. Population Structure of Asian Bamboo Accessions

The population structure analysis performed using IRAP markers to understand the genetic relationship among Asian bamboo accessions, revealed the existence of four apparent sub-populations in the test accessions. The Structure Harvester picked the maximum ΔK value when the inferred number of sub-populations (K) was at four (K = 4), having the maximum delta K value of 265.41 (Figure 7) with the lowest standard deviation (2.34) of the parameter, LnP(K). The resolved sub-populations were designated as PhSP1, PhSP2, PhSP3 and PhSP4 (Figure 8). The first sub-population, PhSP1 accommodated 13 accessions, whereas the remaining sub-populations PhSP2, PhSP3 and PhSP4 carried 19, 17 and 8 accessions, respectively. One of the accessions, Ph. flexuosa remained out of the sub-populations being an admixture of all the four sub-populations. Respective proportions of memberships were 23.0% for PhSP1, 35.7% for PhSP2, 27.1% for PhSP3 and 14.2% for PhSP4. The allele frequency divergence between the sub-populations was maximum between PhSP3 and PhSP4 (0.20), followed by between PhSP2 and PhSP4 (0.19). The lowest divergence was observed between PhSP1, PhSP2 and PhSP3. The estimated values of expected heterozygosity that can be construed as the average distance between members within each sub-population were 0.30, 0.27, 0.29 and 0.08 for PhSP1 to PhSP4 respectively. The proportion of the total genetic variance (FST) explained by the sub-populations ranged from 0.21 (PhSP1) to 0.80 (PhSP4), with the remaining PhSP2 and PhSP3 having FST values of 0.24 and 0.26 respectively. The inferred ancestry coefficients (Q values) for individual accessions carried by the PhSP1 ranged from 0.63 to 0.99, while that of PhSP2 was between 0.73 and 0.99 (Figure 8). Similarly, PhSP3 had a range of 0.50 to 0.99 for the Q values, and the range for PhSP4 was between 0.74 and 1.00. The average Q values for each sub-population were 0.90 for PhSP1, 0.94 for PhSP2, 0.86 for PhSP3 and 0.91c for PhSP4.
Individual members of the sub-populations included Phyllostachys species such as Ph. hispida, Ph. hirtivagina, Ph. virella, Ph. varioauriculata, Ph. heteroclada, and Ph. mannii having placed in PhSP1, that possessed maximum allele frequency of that sub-population. Similarly, fourteen accessions were found to possess high inferred ancestry coefficients for PhSP2, eight accessions for PhSP3 and five for PhSP4. Seven of the moso bamboo varieties (Ph. edulis) were placed in PhSP4, and four of them had the maximum inferred membership coefficient together with one accession, Ph. bambusoides (Figure 8B). All the four sub-populations contained accessions with admixtures of alleles from all, with PhSP3 carrying maximum of admixed accessions, followed by PhSP1 and PhSP4.
We have drawn a consensus of distribution of accessions across the sub-populations by comparing membership of respective groups obtained from hierarchical clustering using Jaccard coefficients and PCA (Supplementary Table S3). It was identified that PCA showed a very close accuracy with respect to the population structure than that obtained by hierarchical clustering. Of the total of 58 accessions, only 46 accessions were commonly shared between the distinct groups obtained among population structure, principal component, and hierarchical clustering analyses (Supplementary Figure S2). Whereas, both population structure and principal component analyses commonly shared a total of 54 accessions from four sub-clusters, with an accuracy value of 93%. The sub-population, PhSP1 had 11 consensual accessions, with an average similarity of 0.28. The remaining sub-populations, PhSP2, PhSP3, and PhSP4 shared 19, 16, and 8 accessions, respectively sharing average similarity values of 0.33, 0.29 and 0.65 (Table 3).

3.7. Analysis of Molecular Variance

The genetic diversity of the four sub-populations of the Asian bamboo species divulged from the genome wide IRAP polymorphisms indicated significant level of genetic variation within and among populations. The sums of squared deviation (SS) values within populations and among populations were 1518.27 and 492.12, respectively with the variance (MS) values of 28.12 and 164.04. The percentage of total molecular variance within populations was 75%, and, among populations, it was 25%. A molecular variance of 75% indicates that a strong genetic differentiation occurred within populations. These values confirm the size of the four sub-populations and the ratio of the admixture of alleles in the four sub-populations. The genetic diversity value (P) of the Asian bamboo species was highly significant (p < 0.001) at two hierarchical levels (among populations and within populations).

4. Discussions

To support genetic bamboo improvement, it is essential to understand the genome-wide variation and diversity among the breeding material. Since TEs form 63% of the bamboo genome [40], of which more than 46% are LTR-retrotransposons, retrotransposon-based DNA-fingerprinting could be an ideal technique to study the genome wide diversity of closely related species or breeding lines [82,83]. The use of retrotransposon-based molecular markers to study plant diversity is a cheap and rapid technique which can provide potentially useful molecular information augmenting other DNA- based markers [82]. The availability of the complete bamboo genome (BambooGDB, http://www.bamboogdb.org) [84] enabled a detailed exploration of the LTR-retrotransposons and their copy numbers based on their structure and subsequently for the development of IRAP primers. Since the development of IRAP primers is a one-time investment, potential primers can be continually be applied [85,86,87] for studying genetic diversity of bamboo species and their corresponding congeners.
In the current study, we confirmed that LTRs of bamboo species had different copy numbers, and their sequences contained full complement of LTR retrotransposons. The structure analysis revealed that they are transcriptionally active, and could be functional. The IRAP primers developed from the high copy number clusters although could amplify multiple-sites of the genome, their number seems to be low when considering the potential diversity of the Phyllostachys accessions used. The designed IRAP primers produced both polymorphic and monomorphic alleles that enabled the use of IRAP DNA fingerprinting to assess the diversity among Asian bamboo accessions. Based on this genome-wide analysis, we concluded that only 29% of IRAP markers showed polymorphism implying that inter-LTR regions in the studied genomes of bamboo species were significantly conserved. This implies that the bamboo genome is still under evolution and LTRs are not very active in contributing to the genome wide variations. This is, to the best of our knowledge, the first report of IRAP primer development and the first report of genetic diversity in bamboo using IRAP based fingerprinting.

4.1. Genetic Diversity of Asian Bamboo Species

The IRAP primers designed and used in the current study offered valuable genetic information about economically important Asian bamboo species and their evolutionary pattern. From the pattern of IRAP polymorphism, we conclude that in spite of their abundance in the bamboo genome, LTR retrotransposons significantly lack polymorphism among the 58 accessions investigated in this study. Although, these accessions belonged to different Phyllostachys species as recognized from their collection sites, the lack of IRAP polymorphism suggested significant level of conservation within the bamboo genome. Possible reason for this genome integrity could be the low frequency of sexual reproduction in bamboos that is monocarpic and occur at long breeding cycles [88]. Moreover, bamboos propagate predominantly clonally, leading to less variation on the genomes. However, over a longer period of time, geographic isolation can conserve localized speciation in the bamboo clones leading to identification of different bamboo species, with some level of morphologic variations. Possibly, active LTR-retrotransposons could be playing a major role in this type of speciation, as they are capable of bringing in spontaneous changes in the genome at random loci. We have observed a few polymorphic loci in the present study, but they showed high level of polymorphism between different sub-populations. This could be attributed to the changes infused by active retrotransposons across the genomes. In an earlier study, analysis of 78 accessions of the Asian bamboo species using 23 microsatellite markers had revealed an average of 2.78 alleles per primer [89]. In contrast, the IRAP markers could produce as many as 13 alleles per marker locus, indicating their effectiveness in revealing the genetic diversity of bamboo genomes in the current study. It may be emphasized that, 98% of average polymorphism exhibited by the IRAP amplicons is the highest reported for bamboo. IRAP occurs due to random insertion of retroelements on the genome, resulting in a length variation of the interspersed regions flanked by two elements. If such insertions affect functional genes, the resultant variations are further clonally propagated in the population, resulting in a transient speciation until sexual reproduction occurs. Such transient speciation can be either transmitted to further sexual generations or can be lost or can subsequently crate novel variations. Therefore, species level genetic diversity of the Asian bamboo accessions can be considered predominantly intermediary and is in the course of evolution that may last for several thousands of years to come. High level of genome wide polymorphism using IRAP markers was also reported in other crop species such as among octoploid triticale plants, where 85% polymorphism was observed [90]. Similarly, 94%, 79% and 74% polymorphism have been reported in Bletilla striata [62], Lallemantia iberica [91] and Schistosoma japonicum [92], respectively, using IRAP markers. Like earlier instances, we could employ IRAP markers reliably in assessing the genetic diversity in bamboo.
Based on the inter-retrotransposon distances, 58 Asian bamboo accessions could be separated into four sub-populations. Considering the fact that the study included 47 species of Phyllostachys, the four sub-populations could be considered very low if the bamboo populations are in Hardy-Weinberg equilibrium with typical random mating behavior. This further consolidated our inferences that the study accessions used in the study were transient species adapted to local niches and propagated clonally. There was a significant lack of molecular allelic pattern representing different species, except for variations at few loci across the genome that could have been accumulated more recently in the evolutionary time scale due to transposition activity. These observations were similar to previous report on 78 Asian bamboo accessions using SSR markers, which grouped them into three classes [89]. Similarly, two major clusters have been reported in 50 varieties of Bletilla striata using IRAP markers [62]. Further, Zhao et al. [89] have reported that the genetic variation between Ph. nuda and Ph. propinqua was 0.2143 using SSR markers. In the current study, we obtained similar variation (0.371) between Ph. nuda and Ph. propinqua. Both these species were characterized with having or not having bristles on the back of sheath. Ph. vivax and Ph. aureosulcata have purple-green or yellow-green with purple culm sheaths and clustered in PhSP2, similar to Zhao et al. [89] study. The current results are consistent with current bamboo’s taxonomic classification and agreed with the morphological classification [93]. Our study further proved that, model based and PCA based approaches were significantly better for resolving the population structure of bamboo, in the event of having a few polymorphic IRAP markers, that has produced significantly good number for highly polymorphic alleles. The CCC of 0.88 obtained from the dendrogram based on Jaccard coefficient is suggestive of this. In a previous report on 200 tree accessions in the 20 groups of Olea europaea using IRAP markers, CCC value was 0.96, indicating a good fit between the similarity matrix and the dendrogram [94].

4.2. Population Structure of Asian Bamboo

Structure analysis used in our study implements a model-based approach for inferring population structure using unlinked genotype marker data, identifying genetically distinct populations, admixtures of alleles in populations and assign individuals to specific sub-populations [77]. Using this approach, Jiang et al. [95] identified three sub-populations in 803 accessions of moso bamboo using 20 SSRs markers. Further, Nachimuthu et al. [96] have identified two sub-populations in 192 accessions of rice using 61 SSR markers. In the current study too, the initial analyses of genetic diversity using the hierarchical clustering as well as the PCA were suggestive of a low-level population differentiation within the study panel of Asian bamboo accessions. Therefore, we have fixed a sub-population range of 1 to 10 for the model, assuming admixed populations and correlated allele frequencies. Analysis revealed an optimum population structure consisting of four sub-populations.
The inferred ancestry coefficients of Asian bamboo accessions provided the genetic relationship and gene flow pattern between the sub-populations. Few members of all sub-populations had admixture of alleles, while some members were specifically grouped with maximum frequency of sub-population specific alleles. From the molecular diversity pattern of the Asian bamboo accessions, we concluded that the PhSP2 was the sub-population with particularly lower number of admixed clones. Conversely, the PhSP3 had significantly high level of admixture especially from PhSP2. Similarly, the admixture of alleles was found between PhSP1 and PhSP4. However, we could observe that genetic variations among populations was significantly lower than that within populations indicating several subtle allelic variations among the members of each sub-populations. This was similar to previous studies for bamboo species such as Melocanna baccifera and Bashania fangiana (Dwarf bamboo) using ISSR and AFLP markers, respectively [97,98].
Among the sub-populations, lowest within population variation was observed with PhSP4. This sub-population contained most of the Moso bamboo accessions of the species, Ph. edulis. This genetically very close group, however, contained one accession of Ph. bambusoides, which could be suspected as a mistaken nomenclature. The significant similarity within this group, could be well explained because all the members were different commercial varieties of Moso bamboo. This category of bamboo is the most commercially exploited bamboos and are chiefly propagated clonally. Moso bamboos also offer long flowering intervals, and long breeding cycle [99]. Further, Moso bamboo displayed very low admixture of alleles, which suggests that LTR-elements had a little role in defining its genetic structure.

5. Conclusions

The aim of the current study was to explore the genome wide abundance of LTR-retrotransposons in the Asian bamboo accessions and to development IRAP based markers for investigating genetic diversity and population structure. Although the variation among the interspaces between the LTR retrotransposons in bamboo species was low, few loci showed apparently high polymorphism aiding the analyses. Since transposon activity is related to environmental factors, geographic speciation could be one of the reasons for high IRAP based diversity at certain loci. This is the first report of population structure using IRAP markers in the Asian bamboo species. From the observed pattern of genetic diversity, it is reasonable to assume that the ancestors of Asian bamboo could be few in number with limited variability, which on evolution, adaptably speciated into different species, with subtle genetic change compared to other rapidly multiplying cross-pollinated species. Each of the IRAP primer had unique differentiation, and this marker system offered highly efficient and reproducible alleles for studying inter-retrotransposon-based genetic diversity.

Supplementary Materials

Supplementary Materials can be found at https://www.mdpi.com/1999-4907/11/1/31/s1. Supplementary Table S1. Description of moso bamboo clusters, with LTR copy numbers, length of LTR sequences and similarity ranges. The cluster sequences were used to generate IRAP amplicons to study the genetic diversity and population structure of different Phyllostachys species (Asian bamboo). The positions of the IRAP primer are highlighted by underlined bold letters. A, B, C and D represent cluster name, LTR copy number, length of LTR sequences and similarity (%) (Ranges), respectively. Supplementary Table S2. Jaccard similarity coefficient values of 58 (Asian bamboo) species generated by 16 IRAP markers. Supplementary Table S3. Description of total of the number of accessions commonly shared within each sub-population (PhSP1-PhSP4) of Phyllostachys species (Asian bamboo) by population structure, principal component (PCA), and hierarchical clustering analyses. The genetic diversity was assessed from the allele pattern produced by 16 inter-retrotransposon amplified polymorphism (IRAP) markers. Numbers on the table represent different Asian bamboo species as defined in the Table 1. Supplementary Figure S1. Broken-stick model showing the number of significant principal components (PCs) of 58 Phyllostachys species (Asian bamboo) based on inter-retrotransposon amplified polymorphism (IRAP) markers. Supplementary Figure S2. Venn diagram showing the number of accessions commonly shared within each sub-population (PhSP1-PhSP4) of Phyllostachys accessions (Asian bamboo). The consensus is obtained from population structure, principal component (PCA), and hierarchical clustering analyses. Sub-clusters, PhC2 and PhC3 were combined with PhC2 in the analysis since PhC3 had only two genotypes.

Author Contributions

Conceptualization, M.Z. and M.R.; Methodology, M.R., M.Z. and S.L.; Software, M.R., M.Z. and S.L.; Validation, M.R., M.Z. and S.L.; Formal analysis, M.R., K.K.V. and R.K.; Investigation, M.R. and M.Z.; Resources, M.Z., S.L. and M.R.; Data curation, M.R., M.Z. and S.L.; Writing—original draft preparation, M.R.; Writing—review and editing, M.R., K.K.V., R.K., K.Y. and M.Z.; Visualization, M.R., M.Z., K.K.V. and R.K.; Supervision, M.R. and M.Z.; Project administration, M.Z.; Funding acquisition, M.Z. All authors have read and agreed to the published version of the manuscript.

Funding

This work was funded by the grant from the National Natural Science Foundation of China (grant No 31870656 and 31470615), and the Zhejiang Provincial Natural Science Foundation of China (grant No. LZ19C160001 and 2016C02056-8).

Acknowledgments

The authors would like to extend their sincere appreciation to the Directors of bamboo garden and forests of Fujian, Zhejiang, Anhui, Sichuang, Jiangxi, Guangdong, Hunan, Henan, Jiangsu and Taiwan for supplying the plant materials. We thank all three reviewers for their valuable comments.

Conflicts of Interest

The authors declare that the research was conducted in the absence of any commercial or financial relationships that could be construed as a potential conflict of interest.

Abbreviations

AFLPAmplified fragment length polymorphism
AMOVAAnalysis of the molecular variance
CCCCophenetic correlation coefficient
CTABCetyltrimethylammonium bromide
dfDegree of freedom
EST-SSRExpressed sequence tags—SSR
IPTGIsopropyl β-D-1-thiogalactopyranoside
IRAPInter-retrotransposon amplified polymorphism
ISSRsInter-simple sequence repeats
LTRLong terminal repeat
MCMCMarkov Chain Monte Carlo
MSMean of squared deviations
PCAPrincipal component analysis
PhCPhyllostachys cluster
PhSPPhyllostachys sub-population
PICPolymorphic information content
RAPDRandomly amplified polymorphic DNA
RFLPRestriction fragment length polymorphism
SCoTStart codon targeted
siRNAsSmall interfering RNAs
SNPSingle nucleotide polymorphism
SSSums of squared deviations
SSRsSimple sequence repeats
TEsTransposable elements
UPGMAUnweighted pair-group method with arithmetic average

References

  1. Yeasmin, L.; Ali, M.N.; Gantait, S.; Chakraborty, S. Bamboo: An overview on its genetic diversity and characterization. 3 Biotech 2015, 5, 1–11. [Google Scholar] [CrossRef] [PubMed] [Green Version]
  2. Biswas, P.; Chakraborty, S.; Dutta, S.; Pal, A.; Das, M. Bamboo flowering from the perspective of comparative genomics and transcriptomics. Front. Plant Sci. 2016, 7, 1900. [Google Scholar] [CrossRef] [PubMed] [Green Version]
  3. Yuan, J.-L.; Yue, J.-J.; Gu, X.-P.; Lin, C.-S. Flowering of woody bamboo in tissue culture systems. Front. Plant Sci. 2017, 8, 1589. [Google Scholar] [CrossRef] [PubMed] [Green Version]
  4. Zhang, Y.; Tang, D.; Lin, X.; Ding, M.; Tong, Z. Genome-wide identification of MADS-box family genes in moso bamboo (Phyllostachys edulis) and a functional analysis of PeMADS5 in flowering. BMC Plant Biol. 2018, 18, 176. [Google Scholar] [CrossRef] [PubMed]
  5. Tao, G.; Fu, Y.; Zhou, M. Advances in studies on molecular mechanisms of rapid growth of bamboo species. J. Agric. Biotechnol. 2018, 26, 871–887. [Google Scholar]
  6. Zheng-ping, W.; Chris, S. Phyllostachys Siebold & Zuccarini, Abh. Math.-Phys. Cl. Königl. Bayer. Akad. Wiss. 3: 745. 1843, nom. cons., not Torrey (1836), nom. rej. Flora China 2006, 22, 163–180. [Google Scholar]
  7. Panee, J. Potential medicinal application and toxicity evaluation of extracts from bamboo plants. J. Med. Plant Res. 2015, 9, 681–692. [Google Scholar]
  8. Friar, E.; Kochert, G. Bamboo germplasm screening with nuclear restriction fragment length polymorphisms. Theor. Appl. Genet. 1991, 82, 697–703. [Google Scholar] [CrossRef]
  9. Friar, E.; Kochert, G. A study of genetic variation and evolution of Phyllostachys (Bambusoideae: Poaceae) using nuclear restriction fragment length polymorphisms. Theor. Appl. Genet. 1994, 89, 265–270. [Google Scholar] [CrossRef]
  10. Gielis, J.; Everaert, I.; De Loose, M. Genetic variability and relationships in Phyllostachys using random amplified polymorphic DNA. In The Bamboos; Chapman, G.P., Ed.; Linnean Society Symposium Series Academic: London, UK, 1997; Volume 19, pp. 107–124. [Google Scholar]
  11. Zhang, S.; Ma, Q.; Ding, Y. RAPD analysis for the genetic diversity of Phyllostachys edulis China forestry. Sci. Technol. 2007, 21. [Google Scholar]
  12. Hodkinson, T.R.; Renvoize, S.A.; Chonghaile, G.N.; Stapleton, C.M.; Chase, M.W. A comparison of ITS nuclear rDNA sequence data and AFLP markers for phylogenetic studies in Phyllostachys (Bambusoideae, Poaceae). J. Plant Res. 2000, 113, 259–269. [Google Scholar] [CrossRef]
  13. Suyama, Y.; Obayashi, K.; Hayashi, I. Clonal structure in a dwarf bamboo (Sasa senanensis) population inferred from amplified fragment length polymorphism (AFLP) fingerprints. Mol. Ecol. 2000, 9, 901–906. [Google Scholar] [CrossRef] [PubMed]
  14. Isagi, Y.; Shimada, K.; Kushima, H.; Tanaka, N.; Nagao, A.; Ishikawa, T.; Onodera, H.; Watanabe, S. Clonal structure and flowering traits of a bamboo [Phyllostachys pubescens (Mazel) Ohwi] stand grown from a simultaneous flowering as revealed by AFLP analysis. Mol. Ecol. 2004, 13, 2017–2021. [Google Scholar] [CrossRef] [PubMed]
  15. Lin, X.; Lou, Y.; Zhang, Y.; Yuan, X.; He, J.; Fang, W. Identification of genetic diversity among cultivars of Phyllostachys violascens using ISSR, SRAP and AFLP markers. Bot. Rev. 2011, 77, 223–232. [Google Scholar] [CrossRef]
  16. Isagi, Y.; Oda, T.; Fukushima, K.; Lian, C.; Yokogawa, M.; Kaneko, S. Predominance of a single clone of the most widely distributed bamboo species Phyllostachys edulis in East Asia. J. Plant Res. 2016, 129, 21–27. [Google Scholar] [CrossRef]
  17. Lai, C.; Hsiao, J. Genetic variation of Phyllostachys pubescens (Bambusoideae, Poaceae) in Taiwan based on DNA polymorphisms. Bot. Bull. Acad. Sin. 1997, 38, 145–152. [Google Scholar]
  18. Tang, D.-Q.; Lu, J.-J.; Fang, W.; Zhang, S.; Zhou, M.-B. Development, characterization and utilization of GenBank microsatellite markers in Phyllostachys pubescens and related species. Mol. Breed. 2010, 25, 299–311. [Google Scholar] [CrossRef]
  19. Peng, Z.; Lu, T.; Li, L.; Liu, X.; Gao, Z.; Hu, T.; Yang, X.; Feng, Q.; Guan, J.; Weng, Q. Genome-wide characterization of the biggest grass, bamboo, based on 10,608 putative full-length cDNA sequences. BMC Plant Biol. 2010, 10, 116. [Google Scholar] [CrossRef] [Green Version]
  20. Zhang, Z.; Guan, Y.; Yang, L.; Yu, L.; Luo, S. Analysis of SSRs information and development of SSR markers from Moso bamboo (Phyllostachys edulis) ESTs. Acta Hortic. Sin. 2011, 38, 989–996. [Google Scholar]
  21. Lin, X.C.; Ruan, X.S.; Lou, Y.F.; Guo, X.Q.; Fang, W. Genetic similarity among cultivars of Phyllostachys pubescens. Plant Syst. Evol. 2009, 277, 67–73. [Google Scholar] [CrossRef]
  22. Zhou, M.-B.; Wu, J.-J.; Ramakrishnan, M.; Meng, X.-W.; Vinod, K.K. Prospects for the study of genetic variation among Moso bamboo wild-type and variants through genome resequencing. Trees 2018, 33, 371–381. [Google Scholar] [CrossRef]
  23. Chen, C.; Wang, W.; Wang, X.; Shen, D.; Wang, S.; Wang, Y.; Gao, B.; Wimmers, K.; Mao, J.; Li, K.; et al. Retrotransposons evolution and impact on lncRNA and protein coding genes in pigs. Mob. DNA 2019, 10, 19. [Google Scholar] [CrossRef] [PubMed]
  24. Li, S.-F.; Guo, Y.-J.; Li, J.-R.; Zhang, D.-X.; Wang, B.-X.; Li, N.; Deng, C.-L.; Gao, W.-J. The landscape of transposable elements and satellite DNAs in the genome of a dioecious plant spinach (Spinacia oleracea L.). Mob. DNA 2019, 10, 3. [Google Scholar] [CrossRef] [PubMed]
  25. McCue, A.D.; Slotkin, R.K. Transposable element small RNAs as regulators of gene expression. Trends Genet. 2012, 28, 616–623. [Google Scholar] [CrossRef]
  26. Gao, D.; Abernathy, B.; Rohksar, D.; Schmutz, J.; Jackson, S.A. Annotation and sequence diversity of transposable elements in common bean (Phaseolus vulgaris). Front. Plant Sci. 2014, 5, 339. [Google Scholar] [CrossRef] [Green Version]
  27. Gao, D.; Jiang, N.; Wing, R.A.; Jiang, J.; Jackson, S.A. Transposons play an important role in the evolution and diversification of centromeres among closely related species. Front. Plant Sci. 2015, 6, 216. [Google Scholar] [CrossRef] [Green Version]
  28. Bourque, G.; Burns, K.H.; Gehring, M.; Gorbunova, V.; Seluanov, A.; Hammell, M.; Imbeault, M.; Izsvák, Z.; Levin, H.L.; Macfarlan, T.S.; et al. Ten things you should know about transposable elements. Genome Biol. 2018, 19, 199. [Google Scholar] [CrossRef]
  29. Drongitis, D.; Aniello, F.; Fucci, L.; Donizetti, A. Roles of transposable elements in the different layers of gene expression regulation. IJMS 2019, 20, 5755. [Google Scholar] [CrossRef] [Green Version]
  30. Orozco-Arias, S.; Isaza, G.; Guyot, R. Retrotransposons in plant genomes: Structure, identification, and classification through bioinformatics and machine learning. IJMS 2019, 20, 3837. [Google Scholar] [CrossRef] [Green Version]
  31. Feschotte, C.; Pritham, E.J. DNA transposons and the evolution of eukaryotic genomes. Annu. Rev. Genet. 2007, 41, 331–368. [Google Scholar] [CrossRef] [Green Version]
  32. Finnegan, D.J. Eukaryotic transposable elements and genome evolution. Trends Genet. 1989, 5, 103–107. [Google Scholar] [CrossRef]
  33. Goodier, J.L. Restricting retrotransposons: A review. Mob. DNA 2016, 7, 16. [Google Scholar] [CrossRef] [PubMed] [Green Version]
  34. Wicker, T.; Gundlach, H.; Spannagl, M.; Uauy, C.; Borrill, P.; Ramirez-Gonzalez, R.H.; De Oliveira, R.; Mayer, K.F.X.; Paux, E.; Choulet, F. Impact of transposable elements on genome structure and evolution in bread wheat. Genome Biol. 2018, 19, 103. [Google Scholar] [CrossRef] [PubMed]
  35. Bennetzen, J.L.; Sanmiguel, P. Evidence that a recent increase in maize genome size was caused by the massive amplification of intergene retrotransposons. Ann. Bot. 1998, 82, 37–44. [Google Scholar] [CrossRef]
  36. Schnable, P.S.; Ware, D.; Fulton, R.S.; Stein, J.C.; Wei, F.; Pasternak, S.; Liang, C.; Zhang, J.; Fulton, L.; Graves, T.A.; et al. The B73 maize genome: Complexity, diversity, and dynamics. Science 2009, 326, 1112–1115. [Google Scholar] [CrossRef] [PubMed] [Green Version]
  37. Zhou, M.-B.; Lu, J.-J.; Zhong, H.; Tang, K.-X.; Tang, D.-Q. Distribution and polymorphism of mariner-like elements in the Bambusoideae subfamily. Plant Syst. Evol. 2010, 289, 1–11. [Google Scholar] [CrossRef]
  38. Peng, Z.; Lu, Y.; Li, L.; Zhao, Q.; Feng, Q.; Gao, Z.; Lu, H.; Hu, T.; Yao, N.; Liu, K.; et al. The draft genome of the fast-growing non-timber forest species moso bamboo (Phyllostachys heterocycla). Nat. Genet. 2013, 45, 456–461. [Google Scholar] [CrossRef] [Green Version]
  39. Zhou, M.; Hu, B.; Zhu, Y. Genome-wide characterization and evolution analysis of long terminal repeat retroelements in moso bamboo (Phyllostachys edulis). Tree Genet. Genomes 2017, 13, 43. [Google Scholar] [CrossRef]
  40. Zhao, H.; Gao, Z.; Wang, L.; Wang, J.; Wang, S.; Fei, B.; Chen, C.; Shi, C.; Liu, X.; Zhang, H.; et al. Chromosome-level reference genome and alternative splicing atlas of moso bamboo (Phyllostachys edulis). GigaScience 2018, 7, giy115. [Google Scholar] [CrossRef]
  41. Bennetzen, J.L. Transposable element contributions to plant gene and genome evolution. Plant Mol. Biol. 2000, 42, 251–269. [Google Scholar] [CrossRef]
  42. Llorens, C.; Munoz-Pomer, A.; Bernad, L.; Botella, H.; Moya, A. Network dynamics of eukaryotic LTR retroelements beyond phylogenetic trees. Biol. Direct 2009, 4, 41. [Google Scholar] [CrossRef] [PubMed] [Green Version]
  43. Neumann, P.; Novák, P.; Hoštáková, N.; Macas, J. Systematic survey of plant LTR-retrotransposons elucidates phylogenetic relationships of their polyprotein domains and provides a reference for element classification. Mob. DNA 2019, 10, 1. [Google Scholar] [CrossRef] [PubMed]
  44. Bennetzen, J.L.; Wang, H. The contributions of transposable elements to the structure, function, and evolution of plant genomes. Annu. Rev. Plant Biol. 2014, 65, 505–530. [Google Scholar] [CrossRef] [PubMed]
  45. Cho, J.; Benoit, M.; Catoni, M.; Drost, H.-G.; Brestovitsky, A.; Oosterbeek, M.; Paszkowski, J. Sensitive detection of pre-integration intermediates of long terminal repeat retrotransposons in crop plants. Nat. Plants 2019, 5, 26–33. [Google Scholar] [CrossRef]
  46. Griffiths, J.; Catoni, M.; Iwasaki, M.; Paszkowski, J. Sequence-independent identification of active LTR retrotransposons in Arabidopsis. Mol. Plant 2018, 11, 508–511. [Google Scholar] [CrossRef] [Green Version]
  47. Zhou, M.; Zhu, Y.; Bai, Y.; Hänninen, H.; Meng, X. Transcriptionally active LTR retroelement-related sequences and their relationship with small RNA in moso bamboo (Phyllostachys edulis). Mol. Breed. 2017, 37, 132. [Google Scholar] [CrossRef]
  48. Kaeppler, S.M.; Kaeppler, H.F.; Rhee, Y. Epigenetic aspects of somaclonal variation in plants. Plant Mol. Biol. 2000, 43, 179–188. [Google Scholar] [CrossRef]
  49. Miyao, A.; Nakagome, M.; Ohnuma, T.; Yamagata, H.; Kanamori, H.; Katayose, Y.; Takahashi, A.; Matsumoto, T.; Hirochika, H. Molecular spectrum of somaclonal variation in regenerated rice revealed by whole-genome sequencing. Plant Cell Physiol. 2012, 53, 256–264. [Google Scholar] [CrossRef] [Green Version]
  50. Paszkowski, J. Controlled activation of retrotransposition for plant breeding. Curr. Opin. Biotechnol. 2015, 32, 200–206. [Google Scholar] [CrossRef]
  51. Kalendar, R.; Grob, T.; Regina, M.; Suoniemi, A.; Schulman, A. IRAP and REMAP: Two new retrotransposon-based DNA fingerprinting techniques. Theor. Appl. Genet. 1999, 98, 704–711. [Google Scholar] [CrossRef]
  52. Kalendar, R.; Schulman, A.H. IRAP and REMAP for retrotransposon-based genotyping and fingerprinting. Nat. Protoc. 2007, 1, 2478. [Google Scholar] [CrossRef] [PubMed]
  53. Schulman, A.H.; Flavell, A.J.; Paux, E.; Ellis, T.H. The application of LTR retrotransposons as molecular markers in plants. Methods Mol. Biol. 2012, 859, 115–153. [Google Scholar] [CrossRef] [PubMed]
  54. Kalendar, R.; Amenov, A.; Daniyarov, A. Use of retrotransposon-derived genetic markers to analyse genomic variability in plants. Funct. Plant Biol. 2019, 46, 15–29. [Google Scholar] [CrossRef] [PubMed]
  55. Rahmani, M.-S.; Pijut, P.M.; Shabanian, N.; Nasri, M. Genetic fidelity assessment of in vitro-regenerated plants of Albizia julibrissin using SCoT and IRAP fingerprinting. Vitr. Cell. Dev. Biol. Plant 2015, 51, 407–419. [Google Scholar] [CrossRef]
  56. Vuorinen, L.A.; Kalendar, R.; Fahima, T.; Korpelainen, H.; Nevo, E.; Schulman, H.A. Retrotransposon-based genetic diversity assessment in wild emmer wheat (Triticum turgidum ssp. dicoccoides). Agronomy 2018, 8, 107. [Google Scholar] [CrossRef] [Green Version]
  57. Sun, J.; Yin, H.; Li, L.; Song, Y.; Fan, L.; Zhang, S.; Wu, J. Evaluation of new IRAP markers of pear and their potential application in differentiating bud sports and other Rosaceae species. Tree Genet. Genomes 2015, 11, 25. [Google Scholar] [CrossRef]
  58. Branco, C.J.; Vieira, E.A.; Malone, G.; Kopp, M.M.; Malone, E.; Bernardes, A.; Mistura, C.C.; Carvalho, F.I.; Oliveira, C.A. IRAP and REMAP assessments of genetic similarity in rice. J. Appl. Genet. 2007, 48, 107–113. [Google Scholar] [CrossRef]
  59. Vukich, M.; Schulman, A.H.; Giordani, T.; Natali, L.; Kalendar, R.; Cavallini, A. Genetic variability in sunflower (Helianthus annuus L.) and in the Helianthus genus as assessed by retrotransposon-based molecular markers. Theor. Appl. Genet. 2009, 119, 1027–1038. [Google Scholar] [CrossRef]
  60. Fan, F.; Cui, B.; Zhang, T.; Ding, G.; Wen, X. LTR-retrotransposon activation, IRAP marker development and its potential in genetic diversity assessment of masson pine (Pinus massoniana). Tree Genet. Genomes 2014, 10, 213–222. [Google Scholar] [CrossRef]
  61. Lee, S.-I.; Kim, J.-H.; Park, K.-C.; Kim, N.-S. LTR-retrotransposons and inter-retrotransposon amplified polymorphism (IRAP) analysis in Lilium species. Genetica 2015, 143, 343–352. [Google Scholar] [CrossRef]
  62. Guo, Y.; Zhai, L.; Long, H.; Chen, N.; Gao, C.; Ding, Z.; Jin, B. Genetic diversity of Bletilla striata assessed by SCoT and IRAP markers. Hereditas 2018, 155, 35. [Google Scholar] [CrossRef] [PubMed]
  63. Hosid, E.; Brodsky, L.; Kalendar, R.; Raskina, O.; Belyayev, A. Diversity of LTR retrotransposon genome distribution in natural populations of the wild diploid wheat Aegilops speltoides. Genetics 2012, 190, 263–274. [Google Scholar] [CrossRef] [PubMed] [Green Version]
  64. Doyle, J.J.; Doyle, J.L. Isolation of plant DNA from fresh tissue. Focus 1990, 12, 39–40. [Google Scholar]
  65. Steinbiss, S.; Willhoeft, U.; Gremme, G.; Kurtz, S. Fine-grained annotation and classification of de novo predicted LTR retrotransposons. Nucleic Acids Res. 2009, 37, 7002–7013. [Google Scholar] [CrossRef] [PubMed]
  66. Li, W.; Godzik, A. Cd-hit: A fast program for clustering and comparing large sets of protein or nucleotide sequences. Bioinformatics 2006, 22, 1658–1659. [Google Scholar] [CrossRef] [PubMed] [Green Version]
  67. Kumar, S.; Stecher, G.; Tamura, K. MEGA7: Molecular evolutionary genetics analysis version 7.0 for bigger datasets. Mol. Biol. Evol. 2016, 33, 1870–1874. [Google Scholar] [CrossRef] [Green Version]
  68. Saitou, N.; Nei, M. The neighbor-joining method: A new method for reconstructing phylogenetic trees. Mol. Biol. Evol. 1987, 4, 406–425. [Google Scholar] [CrossRef]
  69. De Riek, J.; Calsyn, E.; Everaert, I.; Van Bockstaele, E.; De Loose, M. AFLP based alternatives for the assessment of Distinctness, Uniformity and Stability of sugar beet varieties. Theor. Appl. Genet. 2001, 103, 1254–1265. [Google Scholar] [CrossRef]
  70. Jaccard, P. Nouvelles researches sur la distribution florale. Bull. Soc. Vaud. Sci. Natl. 1908, 223–270. [Google Scholar]
  71. Pavlicek, A.; Hrda, S.; Flegr, J. Free-Tree–freeware program for construction of phylogenetic trees on the basis of distance data and bootstrap/jackknife analysis of the tree robustness. Application in the RAPD analysis of genus Frenkelia. Folia. Biol. 1999, 45, 97–99. [Google Scholar]
  72. Page, R.D. TreeView: An application to display phylogenetic trees on personal computers. Comput. Appl. Biosci. 1996, 12, 357–358. [Google Scholar] [PubMed] [Green Version]
  73. Hammer, Ø.; Harper, D.; Ryan, P. PAST: Paleontological statistics software package for education and data analysis. Palaeontol. Electron. 2001, 4, 9. [Google Scholar]
  74. Legendre, P.; Legendre, L. Numerical Ecology, 2nd English edition; Elsevier: Amsterdam, The Netherlands, 1998. [Google Scholar]
  75. Jolliffe, I.T. Principal Component Analysis, 2nd ed.; Springer: New York, NY, USA, 2002. [Google Scholar]
  76. McGarigal, K.; Cushman, S.A.; Stafford, S. Multivariate Statistics for Wildlife and Ecology Research; Springer: New York, NY, USA, 2000. [Google Scholar]
  77. Pritchard, J.K.; Stephens, M.; Donnelly, P. Inference of population structure using multilocus genotype data. Genetics 2000, 155, 945–959. [Google Scholar] [PubMed]
  78. Fraley, C.; Raftery, A.E. Model-based clustering, discriminant analysis, and density estimation. J. Am. Stat. Assoc. 2002, 97, 611–631. [Google Scholar] [CrossRef]
  79. Karandikar, R. On the markov chain monte carlo (MCMC) method. Sadhana 2006, 31, 81–84. [Google Scholar] [CrossRef] [Green Version]
  80. Evanno, G.; Regnaut, S.; Goudet, J. Detecting the number of clusters of individuals using the software STRUCTURE: A simulation study. Mol. Ecol. 2005, 14, 2611–2620. [Google Scholar] [CrossRef] [PubMed] [Green Version]
  81. Peakall, R.; Smouse, P.E. GenAlEx 6.5: Genetic analysis in Excel. Population genetic software for teaching and research—An update. Bioinformatics 2012, 6, 2537–2589. [Google Scholar] [CrossRef] [PubMed] [Green Version]
  82. Kalendar, R.; Flavell, A.J.; Ellis, T.H.N.; Sjakste, T.; Moisy, C.; Schulman, A.H. Analysis of plant diversity with retrotransposon-based molecular markers. Heredity 2010, 106, 520. [Google Scholar] [CrossRef] [Green Version]
  83. Kalendar, R.; Schulman, A.H. Transposon based tagging: IRAP, REMAP, and iPBS. Methods Mol. Biol. 2014, 1115, 233–255. [Google Scholar] [CrossRef] [Green Version]
  84. Zhao, H.; Peng, Z.; Fei, B.; Li, L.; Hu, T.; Gao, Z.; Jiang, Z. BambooGDB: A bamboo genome database with functional annotation and an analysis platform. Database 2014, 2014, bau006. [Google Scholar] [CrossRef] [Green Version]
  85. Paux, E.; Faure, S.; Choulet, F.; Roger, D.; Gauthier, V.; Martinant, J.P.; Sourdille, P.; Balfourier, F.; Le Paslier, M.C.; Chauveau, A.; et al. Insertion site-based polymorphism markers open new perspectives for genome saturation and marker-assisted selection in wheat. Plant Biotechnol. J. 2010, 8, 196–210. [Google Scholar] [CrossRef] [PubMed]
  86. Galindo-Gonzalez, L.; Mhiri, C.; Deyholos, M.K.; Grandbastien, M.A. LTR-retrotransposons in plants: Engines of evolution. Gene 2017, 626, 14–25. [Google Scholar] [CrossRef] [PubMed]
  87. Belyayev, A.; Kalendar, R.; Brodsky, L.; Nevo, E.; Schulman, A.H.; Raskina, O. Transposable elements in a marginal plant population: Temporal fluctuations provide new insights into genome evolution of wild diploid wheat. Mob. DNA 2010, 1, 6. [Google Scholar] [CrossRef] [Green Version]
  88. Simmonds, N.W. Monocarpy, calendars and flowering cycles in angiosperms. Kew Bulletin 1980, 35, 235–245. [Google Scholar] [CrossRef]
  89. Zhao, H.; Yang, L.; Peng, Z.; Sun, H.; Yue, X.; Lou, Y.; Dong, L.; Wang, L.; Gao, Z. Developing genome-wide microsatellite markers of bamboo and their applications on molecular marker assisted taxonomy for accessions in the genus Phyllostachys. Sci. Rep. 2015, 5, 8018. [Google Scholar] [CrossRef]
  90. Szućko, I.; Rogalska, S.M. Application of ISSR-PCR, IRAP-PCR, REMAP-PCR, and ITAP-PCR in the assessment of genomic changes in the early generation of triticale. Biol. Plant 2015, 59, 708–714. [Google Scholar] [CrossRef]
  91. Cheraghi, A.; Rahmani, F.; Hassanzadeh-Ghorttapeh, A. IRAP and REMAP based genetic diversity among varieties of Lallemantia iberica. Mol. Biol. Res. Commun. 2018, 7, 125–132. [Google Scholar] [CrossRef]
  92. Li, J.; Zhao, G.H.; Li, X.Y.; Chen, F.; Chen, J.B.; Zou, F.C.; Yang, J.F.; Lin, R.Q.; Weng, Y.B.; Zhu, X.Q. IRAP: An efficient retrotransposon-based electrophoretic technique for studying genetic variability among geographical isolates of Schistosoma japonicum. Electrophoresis 2011, 32, 1473–1479. [Google Scholar] [CrossRef]
  93. Li, J. Flora of China. Harv. Pap. Bot. 2007, 13, 301–303. [Google Scholar] [CrossRef]
  94. Khaleghi, E.; Sorkheh, K.; Chaleshtori, M.H.; Ercisli, S. Elucidate genetic diversity and population structure of Olea europaea L. germplasm in Iran using AFLP and IRAP molecular markers. 3 Biotech 2017, 7, 71. [Google Scholar] [CrossRef] [Green Version]
  95. Jiang, W.; Bai, T.; Dai, H.; Wei, Q.; Zhang, W.; Ding, Y. Microsatellite markers revealed moderate genetic diversity and population differentiation of moso bamboo (Phyllostachys edulis)—A primarily asexual reproduction species in China. Tree Genet. Genomes 2017, 13, 130. [Google Scholar] [CrossRef]
  96. Nachimuthu, V.V.; Muthurajan, R.; Duraialaguraja, S.; Sivakami, R.; Pandian, B.A.; Ponniah, G.; Gunasekaran, K.; Swaminathan, M.; Suji, K.K.; Sabariappan, R. Analysis of population structure and genetic diversity in rice germplasm using SSR markers: An initiative towards association mapping of agronomic traits in Oryza Sativa. Rice 2015, 8, 30. [Google Scholar] [CrossRef] [PubMed] [Green Version]
  97. Nilkanta, H.; Amom, T.; Tikendra, L.; Rahaman, H.; Nongdam, P. ISSR marker based population genetic study of Melocanna baccifera (Roxb.) Kurz: A commercially important bamboo of Manipur, North-East India. Scientifica 2017, 2017, 9. [Google Scholar] [CrossRef] [Green Version]
  98. Ma, Q.-Q.; Song, H.-X.; Zhou, S.-Q.; Yang, W.-Q.; Li, D.-S.; Chen, J.-S. Genetic structure in dwarf bamboo (Bashania fangiana) clonal populations with different genet ages. PLoS ONE 2013, 8, e78784. [Google Scholar] [CrossRef] [PubMed] [Green Version]
  99. Gao, J.; Zhang, Y.; Zhang, C.; Qi, F.; Li, X.; Mu, S.; Peng, Z. Characterization of the floral transcriptome of Moso bamboo (Phyllostachys edulis) at different flowering developmental stages by transcriptome sequencing and RNA-seq analysis. PLoS ONE 2014, 9, e98910. [Google Scholar] [CrossRef] [PubMed] [Green Version]
Figure 1. Amplification strategy for inter retrotransposon amplified polymorphism (IRAP) in Phyllostachys species (Asian bamboo). LTR stands for long terminal repeat. The single primer acts as both forward and reverse primer in PCR reaction. (A), Head-to-Head amplification; (B), Tail-to-Tail amplification; (C), Head-to-Tail amplification. The arrows and rectangles show the position of the IRAP primers and expected PCR products, respectively.
Forests 11 00031 g001
Figure 2. Inter-retrotransposon amplified polymorphism (IRAP) gel fingerprints. Negative agarose gels illustrate the results achieved in different Asian bamboo accessions for different IRAP markers. The bold black letters on top of the gel are the names of the IRAP marker. M above the gel on the left side represents 1 kb DNA Ladder mix (Takara). Numbers 1–47 represent different Asian bamboo species as defined in Table 1.
Forests 11 00031 g002
Figure 3. Neighbor-joining phylogenetic tree with bootstrap analysis showing the genetic relationship of 16 inter-retrotransposon amplified polymorphism (IRAP)-PCR amplicon sequences in Phyllostachys species (Asian bamboo) by corresponding IRAP markers.
Forests 11 00031 g003
Figure 4. Dendrogram using the genetic distance matrix based on Jaccard’s similarity coefficient obtained by hierarchical clustering analysis. The unweighted pair-group method with arithmetic average (UPGMA) with the bootstrap analysis showing the genetic relationship of 58 Phyllostachys species (Asian bamboo) based on inter-retrotransposon amplified polymorphism (IRAP) markers. The numbers present inside the clusters represent the bootstrap values. The numbers in bold represent different Asian bamboo species as defined in Table 1.
Forests 11 00031 g004
Figure 5. Scatter diagram of three-dimensional principal component analysis (PCA) showing the distribution of 58 Phyllostachys species (Asian bamboo) based on inter-retrotransposon amplified polymorphism (IRAP) markers. PC1 (X-axis), PC2 (Y-axis), and PC3 (Z-axis) are the first, second, and third principal components, respectively. Numbers 1–58 on the right side represent different Asian bamboo species as defined in Table 1.
Forests 11 00031 g005
Figure 6. Heatmap of principal component analysis (PCA) showing the distribution of 58 Phyllostachys species (Asian bamboo) based on inter-retrotransposon amplified polymorphism (IRAP) markers. Five significant principal components (PCs) were identified based on the broken-stick model. Hierarchical clustering was done using Euclidean distances. Numbers 1–58 on the right side represent different Asian bamboo species as defined in Table 1.
Forests 11 00031 g006
Figure 7. Structure Harvester analysis showing the ΔK value of 58 Phyllostachys species (Asian bamboo) based on inter-retrotransposon amplified polymorphism (IRAP) markers. (A), mean of estimated Ln probability; (B), rate of change of the likelihood distribution (mean); (C), absolute value of the 2nd order rate of change of the likelihood distribution (mean); (D), ΔK = mean(|L″(K)|)/sd(L(K)). ΔK = 4 indicates the maximum K value.
Forests 11 00031 g007
Figure 8. The population structure of 58 Phyllostachys species (Asian bamboo)-based inter-retrotransposon amplified polymorphism (IRAP) markers based on the Bayesian model. (A), Bar plot of sub-populations; (B), Accession based bar-plots indicating the members of different sub-populations showing the proportion of admixture of alleles. The different colors represent different sub-populations. The scale shows the inferred ancestry coefficients.
Forests 11 00031 g008
Table 1. List of 58 Phyllostachys accessions (Asian bamboo) collected from different geographical regions used for the analysis of genetic diversity using inter-retrotransposon amplified polymorphism (IRAP) markers.
S. No.Phyllostachys AccessionsSource Location
1.Ph. aurea Carr. Zhejiang, China
2.Ph. acutiligula G. H. LaiAnhui, China
3.Ph. varioauriculataAnhui, China
4.Ph. heterocladaSichuang, China
5.Ph. hispidaZhejiang, China
6.Ph. hirtivaginaAnhui, China
7.Ph. edulis (Carrière) J. HouzJiangsu, China
8.Ph. edulis cv. ObliquinodaZhejiang, China
9.Ph. edulis cv. PachyloenJiangxi, China
10.Ph. edulis cf. huamaoyhw (Wen.) WenHunan, China
11.Ph. edulis cv. ViridisulcataZhejiang, China
12.Ph. edulis (Carr.) MatsumuraZhejiang, China
13.Ph. edulis Mitford cv.Zhejiang, China
14.Ph. edulis (Carr.) Mitford cv. GracilisJiangsu, China
15.Ph. edulis cv. Tubaeformis S.Y. WangHunan, China
16.Ph. incarnata T.H. Wen, Bull. Bot. ResZhejiang, China
17.Ph. nidulariaItaly
18.Ph. sulphurea (Carr)A. et C. RivAnhui, China
19.Ph. sulphurea var. viridisHenan, China
20.Ph. manniiTaiwan, China
21.Ph. virellaZhejiang, China
22.Ph. yunhoensxianZhejiang, China
23.Ph. rubromarginataGuangdong, China
24.Ph. elegans McClureAmerica
25.Ph. fimbriligulaZhejiang, China
26.Ph. viridiglaucescensZhejiang, China
27.Ph. robustirameaZhejiang, China
28.Ph. flexuosaAnhui, China
29.Ph. glaucaAmerica
30.Ph. zhejiangensisZhejiang, China
31.Ph. angustaAnhui, China
32.Ph. meyeriHenan, China
33.Ph. vivaxAnhui, China
34.Ph. propinquaAnhui, China
35.Ph. iridescensZhejiang, China
36.Ph. purpureociliataAnhui, China
37.Ph. nudaJiangsu, China
38.Ph. primotinaZhejiang, China
39.Ph. arcanaJiangsu, China
40.Ph. verrucosaHunan, China
41.Ph. bissetiiSichuang, China
42.Ph. aureosulcataZhejiang, China
43.Ph. longiciliataAnhui, China
44.Ph. rutilaZhejiang, China
45.Ph. bambusoidesHenan, China
46.Ph. bambusoides Sieb. et ZuccAnhui, China
47.Ph. nigellaZhejiang, China
48.Ph. dulcisZhejiang, China
49.Ph. auritaHenan, China
50.Ph. funhuanensisZhejiang, China
51.Ph. platyglossaZhejiang, China
52.Ph. rubicundaZhejiang, China
53.Ph. atrovaginataZhejiang, China
54.Ph. parvifoliaZhejiang, China
55.Ph. corrugataAnhui, China
56.Ph. nigraHunan, China
57.Ph. nigra var. henonisJiangsu, China
58.Ph. violascensZhejiang, China
Table 2. List of inter-retrotransposon amplified polymorphism (IRAP) primers with description of amplicons used for the analysis of the genetic diversity and population structure of different Phyllostachys species (Asian bamboo).
IRAP MarkerPrimer Sequence (5′-3′)IRAP Primer Location in LTR Retrotransposons (bp)Allele Size Range (kb)No. of Polymorphic AllelesTotal Number of Amplicons in the PopulationAverage Allele FrequencyPIC ValueMelting Temperature (Tm) °C
CL3-FTATAAAGGTAGCTTTCGGGTATG428338_4364870.65–2.7132310.3060.35052
CL4-RCTGGTATATAGCTGTTGAGCGACG82500_842920.6–2.4131920.2550.35157
CL15-RCTCGTGTATTCTCCCTTTGC221059_2242050.43–2.5122270.3260.40053
CL22-FTGATCAGAGAAGAAAGGGGA49377_577040.42–2.7131250.1660.25652
CL22-RCACGCAGAGAGATTGACACG49377_577040.35–2.7151730.1980.31956
CL34-FGAACGATTACCTCACAGACA4137_72490.45–2.7151830.2100.26252
CL34-RGAGCAATAAAGAGAAGCCCG4137_72490.4–2.2162730.2940.33453
CL37-FAGATTGTTTGATTCGGGGGG153045_1623210.3–2.5121830.2630.32554
CL37-RAGCGGCGTGGAGGAGTTACC153045_1623210.5–2.7132340.3100.37661
CL42-RGCAACAACAAACCCTAAAAA18144_270700.3–2.7142300.2830.36950
CL54-RGCAAGAACATAAGAACAGAA56871_645750.3–2.082090.4500.33655
CL58-FAAGGAATCGTCAGTCAACAA28670_355710.3–2.5112020.3170.36952
CL59-FTGTCAGACAGTACAGGTGCT1169_45360.2–2.7142040.2510.32955
CL61-FATGACATAGGGCACACCAGA680968_6841150.37–2.0142600.3200.27555
CL62-FTAAATAGGGAACGAGGAGCC178936_1838410.5–2.7151900.2180.30656
CL63-RACATTGTTTGATTCGGGGGG248490_2606320.45–2.7161660.1790.27355
Mean---13.37208.750.2720.327-
Note: LTR, long terminal repeat; PIC, polymorphic information content.
Table 3. Description of consensual Asian bamboo accessions picked out from the groupings obtained from dendrogram and principal component analysis (PCA) with respect to deduced population structure based on inter-retrotransposon amplified polymorphism (IRAP). There were a total of 54 accessions falling under different sub-populations, PhSP1 to PhSP4.
Sub-Population NamePhyllostachys Species NameMembership No.Average Similarity
PhSP1Ph. acutiligula G. H. Lai; Ph. heteroclada; Ph. hirtivagina; Ph. varioauriculata; Ph. hispida; Ph. rubromarginata; Ph. aurea Carr.; Ph. sulphurea (Carr)A. et C. Riv; Ph. virella; Ph. mannii; Ph. yunhoensxian. 110.28
PhSP2Ph. bissetii; Ph. aureosulcata; Ph. propinqua; Ph. verrucosa; Ph. vivax; Ph. nuda; Ph. arcana; Ph. meyeri; Ph. primotina; Ph. glauca; Ph. iridescens; Ph. angusta; Ph. sulphurea var. viridis; Ph. rutila; Ph. purpureociliata; Ph. zhejiangensis; Ph. fimbriligula; Ph. elegans McClure; Ph. viridiglaucescens.190.33
PhSP3Ph. atrovaginata; Ph. parvifolia; Ph. rubicunda; Ph. funhuanensis; Ph. longiciliata; Ph. aurita; Ph. platyglossa; Ph. corrugata; Ph. dulcis; Ph. violascens; Ph. bambusoides; Ph. nigella; Ph. edulis (Carr.) Mitford cv. Gracilis; Ph. edulis cv. Tubaeformis S.Y. Wang; Ph. nigra; Ph. nigra var. henonis.160.29
PhSP4Ph. edulis cf. huamaoyhw (Wen.) Wen; Ph. edulis cv. Pachyloen; Ph. bambusoides Sieb. et Zucc; Ph. edulis (Carrière) J. Houz; Ph. edulis cv. Viridisulcata; Ph. edulis Mitford cv.; Ph. edulis cv. Obliquinoda; Ph. edulis (Carr.) Matsumura.80.65

