Article

Characteristics of the Stone Crayfish Population along a Disturbance Gradient—A Case Study of the Kustošak Stream, Croatia

1
Biology Students Association—BIUS, Rooseveltov trg 6, 10000 Zagreb, Croatia
2
Department of Biology, Faculty of Science, University of Zagreb, Horvatovac 102a, 10000 Zagreb, Croatia
3
Faculty of Food Technology and Biotechnology, University of Zagreb, Pierottijeva 6, 10000 Zagreb, Croatia
*
Author to whom correspondence should be addressed.
Diversity 2023, 15(5), 591; https://doi.org/10.3390/d15050591
Submission received: 16 February 2023 / Revised: 8 April 2023 / Accepted: 22 April 2023 / Published: 25 April 2023
(This article belongs to the Special Issue Novel Aspects in Freshwater Fauna Conservation)

Abstract

:
The stone crayfish, Austropotamobius torrentium, is a native European freshwater species sensitive to habitat alterations such as stream channelization and urban development, putting its populations at risk. This study aims to assess how habitat alteration and subsequent water quality changes affect the stone crayfish population in the Kustošak Stream (Croatia) through three selected sites under different levels of anthropogenic disturbance: (1) undisturbed; (2) recently modified, and (3) long-time modified sites. At each site, crayfish were captured, measured, and marked to estimate population size, structure, and crayfish condition. Additionally, we examined whether water quality (18 measured physicochemical parameters) affects relative crayfish abundance. We also used mitochondrial sequencing and microsatellite genotyping to assess species genetic diversity and population connectivity and to compare results among the sites. The results showed that habitat alteration caused an overall reduction in population abundance and changes in size structure; however, it had not yet resulted in detectable genetic differences. Partial least squares regression showed that crayfish abundance was affected by the physicochemical parameters of water, including, among others, oxygen, calcium ions, nitrates, pH, and water temperature. We discuss our findings in the context of the effects of anthropogenic disturbance on the viability and persistence of this EU priority species.

1. Introduction

Austropotamobius torrentium (von Paula Schrank, 1803), the stone crayfish (Figure 1), is a native European crayfish species [1]. It is the smallest among all native European crayfish, and it is considered an ecosystem engineer and a keystone species in freshwater ecosystems [2]. In recent decades, native European crayfish species, including the stone crayfish, have begun facing significant population declines [1,3] caused by water pollution [2], climate change [3], the presence of invasive alien crayfish species and their pathogens [4], and habitat alteration [2]. The stone crayfish is highly vulnerable to all of these pressures, as it is the species with the lowest reproductive output of all native species [5] and is determined to become especially endangered in the future due to climate change and invasive crayfish range expansion scenarios [6]. Its status in Europe is assessed as unfavourable-inadequate (U1) or unfavourable-bad (U2) in all biogeographical regions, according to reporting under Article 17 of the Habitats Directive [7]. Finally, the stone crayfish is listed in Appendix III of the Bern Convention [8], and in Annexes II and V of the EU Habitats Directive (92/43/EEC) [9]. Following the EU Habitats Directive Annex II, the stone crayfish is a priority species for which each EU member state is required to designate specific Natura 2000 sites (special areas of conservation, SACs), while other listings also aim to ensure its conservation and the appropriate management of its populations.
Stone crayfish populations in Croatia, similar to other populations across Europe, are endangered [3]: previous studies estimated that 28% of previously existing populations have disappeared [3,10]. In Croatia, due to sufficient and long-term monitoring data, the stone crayfish is classified as a vulnerable species according to the IUCN [11], and it is strictly protected on a national level by the Nature Protection Act (NN 80/13, NN 144/2013) which should ensure prohibition of its capture and prevent damage or destruction of its habitat.
Finally, the centre of genetic diversity of the stone crayfish is situated in the western part of the Balkan Peninsula, with 7 out of 9 described divergent mitochondrial lineages present in the karstic areas in Croatia [12,13,14]. This cold-adapted species usually inhabits areas with small pristine water bodies at higher altitudes [1]. One of those areas, the Medvednica Nature Park, is a Natura 2000 site situated above Croatia’s capital, the city of Zagreb. The park contains 45 streams which support a high number of the stone crayfish populations [15,16,17]. However, while upper courses of those streams are located within the park, large areas of the streams are located outside of the park’s borders, meaning that an unknown proportion of stone crayfish populations is present in urban areas of the city of Zagreb [18], outside the park and the Natura 2000 network. One of the aforementioned streams is the Kustošak Stream [15,16,17,18], for which 68.85% of the stream is located outside the park’s borders, where it flows through populated areas under elevated anthropogenic pressures. Additionally, the stream has been hydromorphologically changed through channelization, stream bed alterations, and building of dams as a part of municipal stream management and flood protection. Furthermore, part of the Kustošak Stream outside the park’s borders was modified recently during construction work, when the stone substrate and vegetation were removed from the stream bed, resulting in a reduction in the natural shade of the stream. The construction work was completed according to all regulations given by government authorities, but has resulted in potentially damaging habitat alterations for the stone crayfish. Here, we aimed to assess how these recent habitat modifications and subsequent water quality changes affected the stone crayfish population in the Kustošak Stream and whether these effects can be observed at the genetic level. Even though the conducted research encompasses a short period of time, it reflects the effect of anthropogenic pressure on natural stone crayfish populations. In other words, habitat alteration and loss can negatively impact the demographics of natural populations, reducing population size, gene flow, and genetic diversity, thereby decreasing the likelihood of population persistence, which will be more pronounced over a longer period of time. Such reductions lead to inbreeding and make species more vulnerable to extinction because lower diversity decreases adaptability and species long-term persistence [19,20].

2. Materials and Methods

2.1. Study Area and Data Collection

For this study, we selected three spatially close sites (less than 500 m) along the lower part of the Kustošak Stream, outside the Medvednica Nature Park borders, and under different levels of the anthropogenic disturbance: (1) undisturbed, on the border with the Medvednica Nature Park; (2) recently modified, with stone substrate and vegetation removed by construction work in the riverbed; and (3) long-time modified (channelled), with concrete banks (Figure 1). Sites 2 and 3 were situated in a populated area, indicating potentially higher levels of anthropogenic disturbance (Figure 2).
The field work was conducted during a week-long period in September 2021, during a period of increased crayfish activity [2]. The crayfish were trapped using 10 baited handmade traps per site. The traps were made of two plastic bottles (1.5 L) coupled together, with funnel entrances (made from plastic net, mesh size = 2 mm) at each end. The traps were baited with sausages and left in the water overnight for a total of 7 days, regularly checked every day. Upon capture, the sex of each individual was determined, and the samples were measured (weight and total length). Weight (w [g]) was measured using a dynamometer (Pesola 100 g [accuracy ± 0.3 g], Switzerland). The crayfish total body length (TL [mm], from the tip of the rostrum to the end of the telson), was recorded per each crayfish using a digital caliper (Alpha Tools [accuracy ± 0.02 mm], Franklin, NJ, USA). From each individual, one pereopod was sampled and stored in 96% ethanol at 4 °C until further DNA isolation. The survival of crayfish was not compromised because the sampled pereopods will regenerate upon the next moulting. Sampling was conducted in accordance with ethical standards, and the required permission was obtained from the Ministry of Economy and Sustainable Development of the Republic of Croatia (UP/I-612-07/21-48/129). After sampling, the crayfish were marked as described in Section 2.2. and released back into the stream. Finally, at each site, 18 physicochemical water parameters were measured (Table 1). Parameters 1–5 were measured directly in the field [O2 and water temperature were measured using an oximeter (OXPB-1, Lutron YK-2005WA, Taiwan); pH was measured using a pH meter (PE-03, Lutron YK-2005WA, Taiwan); ORP was measured using a pH and redox meter (SenTix 60, WTW pH 3310, Weilheim, Germany); water turbidity was measured using a turbidimeter (Hach 2100Q, Loveland, CO, USA)]. For analyses of parameters 6–18, water samples were collected in bottles, washed three times before filling them to the top, transported on ice, and stored at −20 °C until the analyses were performed. Concentrations of Cl, NO3, SO42−, Na+, K+, Mg2+, and Ca2+ were determined in the lab using a two-channel analytical ion chromatograph ICS6000 (Thermo Scientific, Waltham, MA, USA), with suppressed conductometric detection and electrolytic preparation of eluents on both channels. For anion separation, an AS11-HC-4 µm (2 × 250 mm, Thermo Scientific, Waltham, MA, USA) column was used, with a suitable precolumn AG11-HC (Thermo Scientific, Waltham, MA, USA) and KOH as the eluent, while for cation separation, a CS16–4 µm column (2 × 250 mm, Thermo Scientific, Waltham, MA, USA) was used, with a suitable precolumn CG16 (Thermo Scientific, Waltham, MA, USA) and MSA as an eluent; conventional analytical determinations for concentrations of NH4+, COD, NO3N, NO2, TN, TP, and COD were conducted with Hach Lange Cuvette Tests (LCK 304, 1414, 339, 341, 338, 350) using a DR3900 spectrophotometer (Hach, Loveland, CO, USA).

2.2. Data Analyses

2.2.1. Population Size

Upon capture, each individual was marked with a number on the carapace using an oil-based marker pen. This approach enabled us to estimate population size per site by two mark-recapture methods: the Schnabel method [21],
N = M t C t R t + 1 ,
and the Schumacher–Eschmeyer method [22],
N = C t M t 2 M t R t ,
where: N = estimation of the number of individuals in a population, Mt = number of individuals marked in sample t, Ct = total number of individuals caught in sample t, Rt = number of individuals already marked when caught in sample t.
For the Schnabel method, the upper and lower confidence limits of the estimated population size were determined,
1 N ± t × var 1 N ,
where t = 1.96 (critical value of Student’s t-test, with 95% confidence).
The relative abundance of crayfish was also estimated as the catch per unit effort (CPUE: number of crayfish caught per trap per night).

2.2.2. Size Class Frequency

Collected data regarding total length were used for the analysis of the size structure per site. Based on total length, the crayfish were divided into 5 size classes (0–2.99 cm, 3–4.99 cm, 5–6.99 cm, 7–8.99 cm, and >9 cm). The size classes were arbitrarily set, similar to the method of Maguire and Klobučar [23].

2.2.3. Fulton’s Condition Factor

Data on weight and total length were used for the calculation of the condition of the crayfish. Fulton’s condition factor (FCF [g/mm3]) was calculated as an indicator of crayfish fitness [24],
FCF = w TL 3 × 100 ,
where: w = weight of the individual, and TL = total length of the individual.

2.2.4. Analysis of Physicochemical Parameters of the Water

Collected data regarding the physicochemical parameters of the water were used to examine whether a correlation exists between these and the CPUE.

2.3. Statistical Analyses

Crayfish characteristics and population parameters (CPUE, TL, weight, and FCF) were first tested for normality using the Shapiro–Wilk test. Since the data did not meet the assumptions necessary for the use of parametric tests, even after transformations, their non-parametric analogues were used instead. The Mann–Whitney U test was used to determine whether differences in TL, weight, and FCF exist between males and females at each site. If there were no statistically significant differences between the sexes, males and females were pooled in the subsequent analyses. However, only in the case of FCF, analyses were performed separately for males and females due to observed significant differences between sexes (resulting from sexual dimorphism). Differences in all measured crayfish characteristics and population parameters between the sites were analysed using Kruskal–Wallis ANOVA with Dunn’s post hoc test. Analyses were conducted in TIBCO Statistica version 14.0.1.25 (Palo Alto, CA, USA).
The partial least squares regression (PLS-R) method was used to examine the correlation between the physicochemical parameters of the water (explanatory variables, X), and the CPUE at each site (response variable, Y). Initially, the model quality indices were calculated for two components to validate the performance of the model. Then, a correlation radar was generated in order to visually represent the relationship between explanatory and response variables. Lastly, to indicate the importance of the explanatory variables for the response variables, variable importance in the projections (VIPs) was calculated. The analysis was performed using XLSTAT version 2021.3.1.1189 software for data analysis and visualisation (Addinsoft, Paris, France, Microsoft Excel). In all performed analyses, the significance level was set at p < 0.05.

2.4. Genetic Diversity and Structure

The total genomic DNA was extracted from the pereopod muscle tissue with a GenElute Mammalian Genomic DNA Miniprep kit (Sigma-Aldrich, St. Louis, MO, USA), following the manufacturer’s protocol.
The phylogenetic position and haplotype diversity of the studied crayfish were assessed by mitochondrial DNA analysis (cytochrome oxidase subunit I gene), while the fine genetic diversity and population structure were studied by microsatellite DNA analysis.

2.4.1. Mitochondrial DNA Analyses

The mitochondrial COI gene was amplified and sequenced with universal barcode primers LCO-1490 and HCO-2198 [25], allowing for comparison with previously published stone crayfish sequences. PCR, purification, and sequencing were performed according to the methods of Lovrenčić et al. [14]. The sequences were edited and aligned in Bioedit v. 7.2.5 [26]. The final COI alignment did not contain any length variants or ambiguous sites and included all previously published sequences, with the final length of 582 bp. The sequences were subsequently collapsed to unique haplotypes using FaBox [27] in order to associate haplotypes obtained in the present study with the haplotypes obtained in previous research. Newly obtained haplotypes were submitted to GenBank (accession numbers OQ048681 to OQ048683). Additionally, Austropotamobius pallipes (Lereboullet, 1858) was chosen as an outgroup (GenBank Accession numbers: KX369673, KX369674).
The phylogenetic assignment of the studied individuals was estimated using Bayesian analysis (BA) in MrBayes ver.3.2.6 [28]. The optimal model of nucleotide evolution for the COI dataset was HKY + I + G, selected under the Bayesian information criterion (BIC) using the jModelTest 2.1.10 [29]. The BA was carried out with priors set according to the suggested model; two separate runs with four Metropolis-coupled Monte Carlo Markov chains (MMCM) were performed for 10,000,000 generations, and trees were sampled every 1000 generations. After checking the congruence (ESS values > 200) with Tracer v1.7.1 [30], the first 25% of the sampled trees were eliminated as burn-in, and a consensus tree was constructed, with nodal values representing the posterior probabilities (values ≥ 0.95 were considered supported).

2.4.2. Microsatellite DNA Analyses

The population genetic diversity and structure were estimated using seven polymorphic microsatellite loci (ATM78, ATM79, ATM64, AT1, AT37, ATOR37, and Aas3040) and following the PCR protocols according to Lovrenčić et al. [31]. Genotyping was performed by capillary electrophoresis using internal GeneScan 600 LIZ Size Standard in Macrogen, Inc. (Seoul, South Korea), while microsatellite genotypes were scored and double-checked manually using Peak Scanner software v.1.0 (Applied Biosystems, Waltham, MA, USA). Microsatellite loci were assessed for potential presence of genotyping errors due to scoring of null alleles, stuttering, and large allele dropout using MICRO-CHECKER v.2.2 [32].
The within-population genetic diversity was assessed by calculating the proportion of polymorphic loci (P), mean number of alleles (NA), number of private alleles (APR), observed heterozygosity (HO), unbiased expected heterozygosity (HE), and deviation from the Hardy–Weinberg equilibrium (HWE) for each site across all loci and using GenAlEx v.6.51 [33]. Allelic richness (AR) was calculated and corrected for sample size by the rarefaction method using FSTAT v.2.9 [34]. The same software was used for the calculation of the inbreeding coefficient (FIS) and the levels of genetic connectivity of each site by pairwise comparisons of FST values and evaluated using 1000 permutations. Potential signatures of recent bottlenecks were tested under three different mutational models: the infinite allele model, the stepwise mutation model, and the two-phase model in BOTTLENECK v.1.2 [35]. Significant deviations from mutational-drift equilibrium were tested using the Wilcoxon sign rank test with 10,000 simulations.
The genetic structure among the studied sites and the assembling of individuals into genetic clusters was assessed using the Bayesian model-based clustering approach, as implemented in STRUCTURE v.2.3 [36]. The conditions performed were 10 runs for each potential genetic cluster (K) between 1 and 3, with a 100,000 burn-in period followed by 100,000 Markov Chain Monte Carlo iterations, using correlated allele frequencies under a straight admixture model. The best number of clusters within the dataset (K) was determined using the Evanno method (ΔK method) [37] in STRUCTURE HARVESTER [38]. STRUCTURE graphical results were plotted with CLUMPAK [39].

3. Results

3.1. Descriptive Statistics

A total of 204 individuals were caught, 107 at site 1, 56 at site 2, and 41 at site 3. Descriptive statistics of measured crayfish parameters, as well as Fulton’s condition factor and CPUE per site and sex, are presented in Table 2, while descriptive statistics for the measured physicochemical parameters is shown in Supplementary Tables S1 and S2.

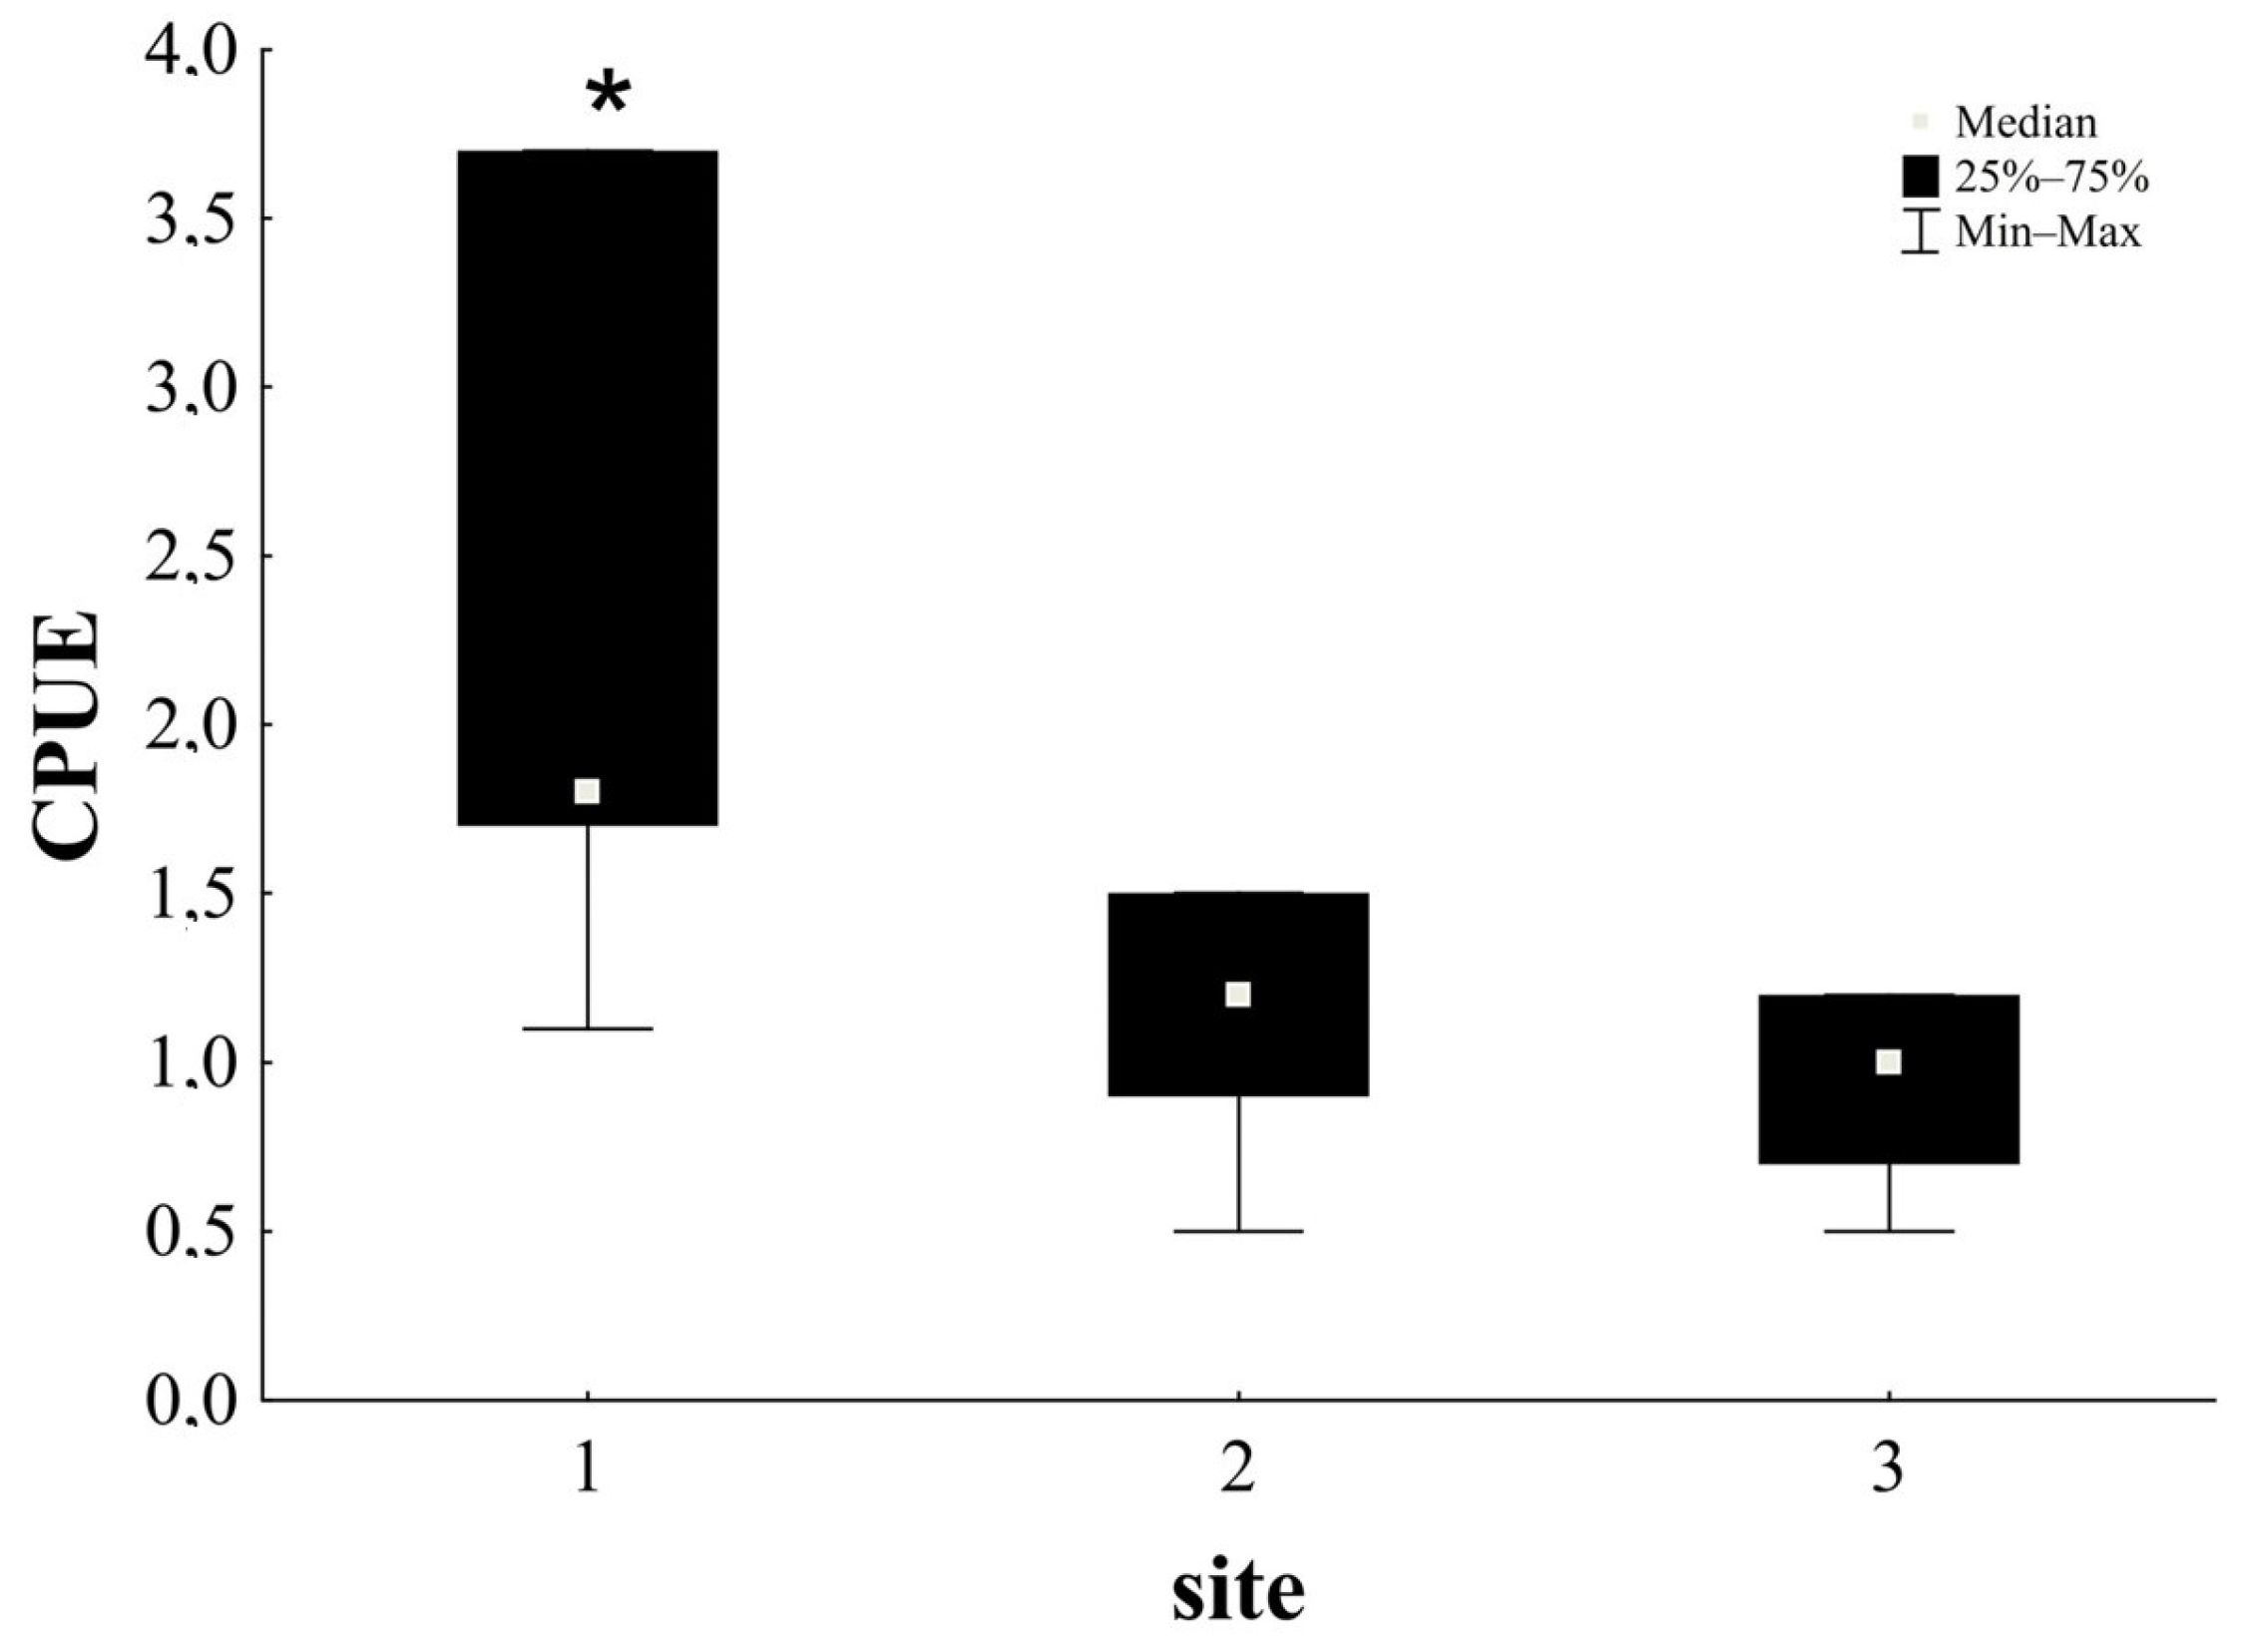
3.2. Estimation of Total and Relative Population Size

The total estimated number of crayfish using both mark-recapture methods (the Schnabel method and the Schumacher–Echmeyer method) followed the recorded disturbance gradient, and the highest number of crayfish was estimated at the undisturbed site (site 1), followed by the recently modified site (site 2), and the lowest number was estimated at the long-time modified site (site 3) (Table 3).
These results also reflected differences in recorded CPUE, which exhibited significant differences between sites (Kruskal–Wallis ANOVA: H (2, N = 204) = 121.7805, p < 0.001). The CPUE at the undisturbed site 1 was significantly higher than the CPUE at the two modified sites (Figure 3).

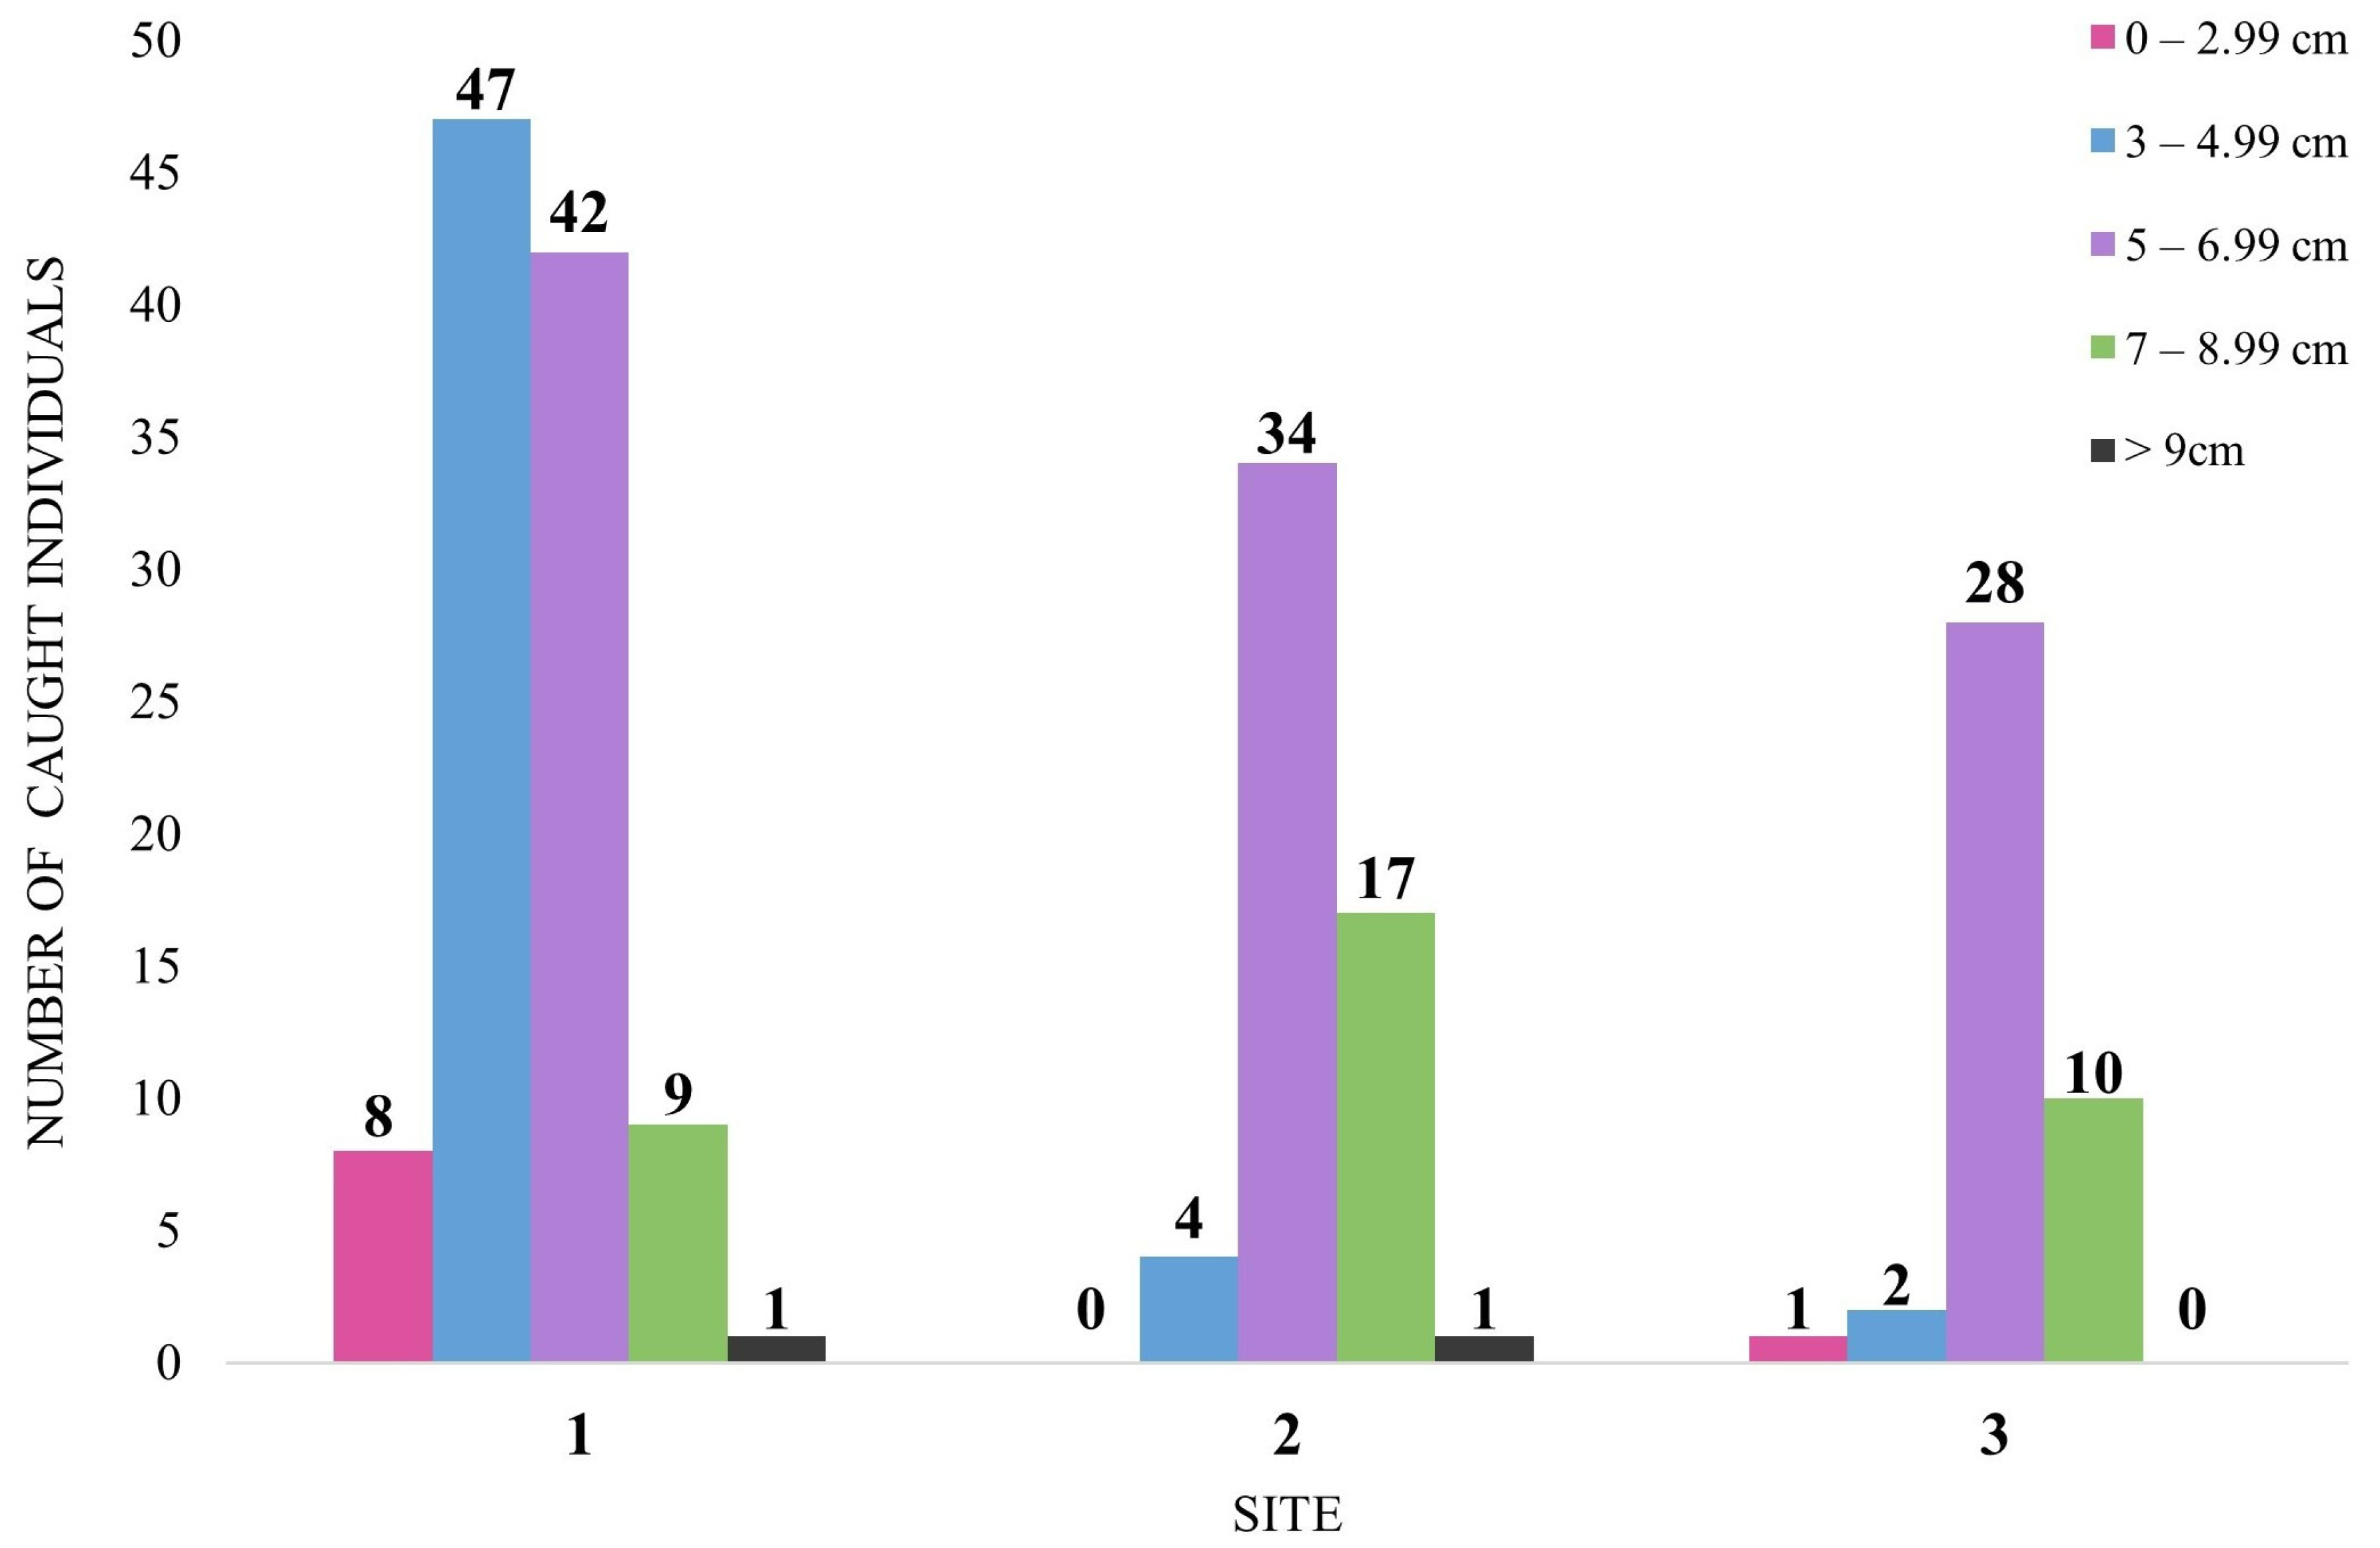
3.3. Size Structure and Crayfish Condition

Crayfish size also differed significantly between the examined sites: total length (Kruskal–Wallis ANOVA: H (2, N = 204) = 35.77619, p < 0.001) and weight (Kruskal–Wallis ANOVA: H (2, N = 204) = 39.11740, p < 0.001), with undisturbed site 1 again showing significant differences in size of caught individuals compared to the other two modified sites (Figure 4).
The size class frequency of crayfish per site is shown in Figure 5. All size classes were present only at the undisturbed site, while the two modified sites lacked smaller size classes.
Crayfish condition, measured as Fulton’s condition factor, exhibited no significant differences between the sites, for either males or females (p > 0.05).

3.4. Effect of Physicochemical Parameters of Water Quality on CPUE

Using the PLS-R method, the relationships between crayfish abundance expressed as CPUE (response variable, Y) and various physicochemical parameters of the water (explanatory variables, X) were analysed. As for the model quality indices R2X and R2Y in component 1, 70.1% of the variance in the set of explanatory variables (X) was used to explain 42.6% of the variance for the response variable (Y). In component 2, 100% in the set of explanatory variables (X) was used to explain 43.6% of the response variable (Y). Q2, as a measure of good prediction, showed that component 1 contributed 31.2% and component 2 contributed 30.4% to the model quality. The relationship between the explanatory and response variables is visually represented in the form of a correlation radar (Figure 6), with positively correlated variables close together and negatively correlated examples far apart. PLS-R analysis showed that K+, NO3, O2, and Ca2+ were the most important parameters that positively influenced CPUE, followed by water turbidity, COD, ORP, Cl, TN, and NO3, N, while the most pronounced negative correlation was found for Mg2+, Na+, pH, and water temperature, followed by NO2, NH4+, TP, and SO42− (Figure 6, Supplementary Table S3). The majority of the parameters (11 in total) had VIP values > 1, meaning that they are considered highly relevant in explaining the CPUE and contribute significantly to the model (Supplementary Figure S1).

3.5. Genetic Diversity and Structure

3.5.1. Mitochondrial DNA Analyses

We obtained 33 new sequences from the studied stream, belonging to six unique COI haplotypes, three of them (AT154, AT156, AT157) recorded for the first time (Supplementary Table S4, Figure 7). Haplotypes from this study were recovered within the well-supported monophyletic phylogroup Central and South Eastern Europe (CSE) sensu Klobučar et al. [12] (Figure 7). Regarding haplotype diversity at each of the studied sites, we recorded six haplotypes at site 1 (AT9, AT119, AT143, AT154, AT156, AT157), five at site 2 (AT9, AT119, AT143, AT154, AT156), and four at site 3 (AT9, AT143, AT156, AT157) (Supplementary Table S4).

3.5.2. Microsatellite DNA Analyses

A total of 36 alleles were observed across the seven microsatellite loci, ranging from three (loci AT1 and Ator37) to nine (loci ATM64 and AT37). No genotyping error due to stuttering or large allele dropout was apparent across the loci. Null alleles were detected only within locus AT37 at sites 2 and 3. However, since no locus showed null alleles across all populations, a bias in our analyses due to null alleles was unlikely, and all subsequent analyses were conducted using the original dataset.
The summary statistics of the genetic diversity indices for the studied sites are shown in Table 4. Overall, the microsatellite markers showed a high level of polymorphism and an acceptable level of genetic diversity (Table 4). Genetic diversity, expressed as P, NA, APR, AR, and HO, was the highest at site 1, followed by site 3, while the lowest genetic diversity was indicated for site 2 (Table 4). A total of 13 private alleles were found, ranging from 3 (site 2) to 5 (sites 1 and 3). The inbreeding coefficient (FIS) per population was low, ranging between 0.07 at site 2 to 0.12 at sites 1 and 3, indicating a slight homozygote excess/heterozygote deficit. Moreover, all sites were in Hardy–Weinberg equilibrium (Table 4). Bottleneck analysis did not reveal consistent signs of contraction of population size and recent bottleneck, according to the three mutational models tested (Table 5).
Genetic differentiation among three sites showed no genetic differentiation, with pairwise FST = 0 for all site pairs. Regarding population genetic structure, the Evanno method revealed that the optimal number of clusters was two (ΔK = 2). The Bayesian clustering analysis in STRUCTURE showed a high level of admixture, with all individuals exhibiting the same genetic architecture and ancestry from both genetic clusters (Figure 8).

4. Discussion

The results of this research provide another example of how anthropogenic pressure negatively affects populations of endangered freshwater species. Stone crayfish populations are facing population declines driven by the introduction of invasive alien species, climate change, and anthropogenic disturbance of their habitats [1,3,40]. Recent studies have revealed that anthropogenic impacts on freshwater habitats pose the highest threat for the stone crayfish populations in Croatia, while in the future, currently suitable habitats are predicted to be lost under different climate change scenarios [31]. Since natural habitats of the stone crayfish are usually isolated and often fragmented by habitat destruction [41], and since the stone crayfish has a low dispersal capacity, there is a weak to no possibility for natural repopulation, if a certain population disappears [42]. Although the study was conducted in a short period of time, and we are aware that long-time monitoring would provide a clearer representation of the state of the stone crayfish population in the Kustošak Stream, we nonetheless gained initial insights into the effects of anthropogenic pressures on a stone crayfish population located outside of the protected areas. Habitat alterations, including stream channelization and urban development, have a drastic negative impact on the freshwater ecosystems [43]. There are numerous documented records of population declines due to habitat alteration, including freshwater taxa such as fish and mussels [44,45]. Furthermore, human activities have also affected the quality of the physical habitat for crayfish, subsequently resulting in reduced crayfish abundance [46,47]. For example, from 67 threatened North American crayfish species, 52% were reported to be imperiled by habitat alteration [48]. In addition, the abundance of crayfish has often been positively correlated to the abundance of shelters [49], which are usually provided by heterogeneous (natural) habitats, that include cobbles, macrophytes, and bank vegetation. Previous studies on the white-clawed crayfish, A. pallipes, showed that the presence of bank vegetation provides valuable protection for smaller size classes, resulting in positive effects on the abundance of this species [50]. The results of our study corroborate that habitat alteration (both recent and historical) potentially caused reduction in the stone crayfish population abundance and changes in size structure. Both population size estimation methods (Schnabel–Schumacher and Eschmeyer), as well as relative crayfish abundance measured using CPUE, show the decline in abundance in population at the two anthropogenically impacted sites, the recently modified and long-time modified sites in the Kustošak Stream. These significant differences were observed in a short stretch (ca. 1 km long), suggesting that they could be a result of the habitat alterations and likely subsequent water quality changes, reduced natural shading, and availability of shelters. The observed changes in abundance were accompanied by changes in the population size structure and measured morphological characteristics. According to the size class frequency histograms, all size classes were observed only at the undisturbed site, which could indicate a healthy population [51]. There, crayfish were smaller compared to individuals in the recently modified and long-time modified site, where mature crayfish prevail. Considering that the stone crayfish reach sexual maturity at 50–60 mm [52], we can conclude that sexually mature individuals are present at all three sites, but anthropogenically impacted sites lack smaller individuals. The research regarding the movement rates of stone crayfish has shown that it is a more sedentary species compared to other crayfish [53,54]. Stone crayfish were recorded to have a maximum movement of 133 m in 55 days [54]. Since the three sites in our study are more distant (499.67 m between sites 1 and 2 and 236.73 m between sites 2 and 3) and capturing was done daily, we presume that the changes in the size class frequency were not a result of migration of bigger individuals between sites. Rather, the lack of smaller individuals at anthropogenically impacted sites could be due to stone substrate and bank vegetation removal, as well as streambed alteration, which changed the optimal living conditions for the stone crayfish population present there, making those sites insufficient for supporting all size classes. The results of our study showed no significant impact of habitat alteration on crayfish conditions, since no differences were observed between sites. This could be related to the timing of the research, considering that during the mating season, adult, reproductively active crayfish are at peak condition [52,55]. Previous studies defined the optimal physicochemical parameters of water supporting stone crayfish populations as pH 5.0–8.6, water temperature 11–26 °C, O2 over 4.0 mg/L, Ca2+ 7.0–70.0 mg/L, Mg2+ 2.6–21.0 mg/L, Cl up to 16.7 mg/L, NO3 up to 44 mg/L, and NO2 up to 1.7 mg/L [56]. Most of the physicochemical parameters measured in our study met the abovementioned ranges. Furthermore, PLS-R analyses showed the strongest positive correlation of relative crayfish abundance (CPUE) with K+, NO3, O2, and Ca2+ and the strongest negative correlation with Mg2+, Na+, pH, and water temperature. The oxygen demands of the stone crayfish have been reported to be higher in comparison to other native European crayfish species due to their occurrence in the upper parts of streams distinguished by water with lower temperature [57,58], explaining the positive correlation of CPUE with O2 and the negative correlation with water temperature. Similarly, the negative correlation of CPUE with pH was expected, as lower pH levels may be toxic in the long term [58]. The positive correlation with calcium ions was an expected outcome, which is typical for crustaceans in general due to their calcified exoskeleton [59].
Contrary to population size and structure results, genetic data revealed no significant effects of habitat alteration on the genetic diversity within the studied area, as genetic variation is still evident based on both mitochondrial haplotypes and nuclear alleles. While levels of genetic diversity were similar according to the microsatellite analysis, the number of recorded COI haplotypes differed among sites, with a higher number in the undisturbed site (1) compared to anthropogenically modified downstream sites (2 and 3).
Phylogenetic reconstruction indicated that three novel haplotypes nested within formerly recognised mitochondrial phylogroup CSE sensu Klobučar et al. [12]. This was expected, since the geographical position of the studied population falls into the region where the CSE mitochondrial phylogroup is distributed, and previous studies have established a strong phylogeographical structure of the stone crayfish, with numerous haplotypes described within each phylogroup [12,14]. This high level of haplotype diversity emerged from the past geo-climatic events, which altered river drainage patterns in the region [12], and low contemporary levels of gene flow among the populations [31]. However, although overall haplotype diversity across studied sites was high and comparable to other CSE populations in the region [14], we observed a decreasing number of haplotypes as habitat alteration increased.
Microsatellites analyses revealed moderate within-population genetic diversity and low differentiation among upstream and downstream sites, suggesting a high level of genetic connectivity, which indicates that the stone crayfish has maintained gene flow despite documented habitat disturbances. Similar results were found for various species, which did not show different levels of genetic diversity in altered and natural habitats [60,61,62]. Despite possible population fragmentation and human disturbance, all sites exhibited similar levels of genetic diversity when compared to other Croatian populations for which microsatellite data have been generated [31]. Generally, lower levels of genetic diversity occurring within the stone crayfish populations suggests that this species may have experienced severe habitat fragmentation or population size reduction, both in the past and recently [31]. The low genetic diversity, along with environmental instability, caused primarily by anthropogenic activities, can decrease species fitness and affect long-term survival [19,63]. Although our study showed that heterozygosity and inbreeding were not strongly affected by habitat alteration, all three sites showed lower observed heterozygosity than expected, suggesting that inbreeding or genetic drift might have an impact in the future. Inbreeding in a small, isolated population of the stone crayfish elevates its extinction risk, giving it substantial conservation significance [19,64]. The genetic clustering approach used to assess population structure showed high admixture and individuals exhibiting assignment to two ancestral genetic groups. Moreover, the geographical proximity of sites probably increased the gene flow and homogenized the present genetic variation, which resulted in all individuals exhibiting a similar genetic background.
Although habitat alteration did not yet result in detectable genetic consequences, we strongly recommend regular genetic monitoring that will establish genetic isolation trends of the studied population and identify early warning signs of further population decreases. Numerous studies have shown that a vast number of species experience genetic erosion due to habitat loss [65,66,67,68]. The negative effects of habitat destruction include increased the isolation of populations or species and the creation of small, isolated subpopulations. In the case of the stone crayfish, additional longer periods of isolation can lead to reduced population size and genetic diversity, consequently causing cascading effects throughout ecosystems due to its keystone role in freshwater habitats [19]. Long-term studies are thus required to fully understand the impacts of the anthropogenic disturbance on the population of the stone crayfish and its genetic diversity in this stream; thus, we advocate that such monitoring should be performed and maintained regularly, since our study indicates that such effects may exist and are visible with short-term monitoring. In conclusion, conservation of this species in general, and specifically in the Kustošak Stream, should focus on maintaining favourable habitat conditions and genetic connectivity. Additionally, we suggest that no further habitat alterations should be planned or performed in this stream, as they will further imperil population connectivity and potentially result in the disappearance of the stone crayfish from these downstream (urbanized) areas outside the park’s borders. Moreover, we strongly suggest that any further stream bed reconstruction activities planned in any of the park’s 45 streams inhabited by the stone crayfish should be avoided or planned only after long-time careful analysis of the current population status.

Supplementary Materials

The following supporting information can be downloaded at: https://www.mdpi.com/article/10.3390/d15050591/s1, Table S1: Results of descriptive statistical analysis (mean ± standard deviation) of physicochemical parameters of water measured per site in the field every day: dissolved oxygen (O2), water temperature (w. temp.), water pH (pH), oxidation reduction potential (ORP) and water turbidity (turbidity). Site 1 = undisturbed site, site 2 = recently modified site, and site 3 = long-time modified (channelled) site. Measuring units are shown in square brackets. Table S2: Results of descriptive statistical analysis of concentrations of physicochemical parameters of collected water samples measured in the laboratory per site: chlorides (Cl), nitrates (NO3), sulphates (SO42−), sodium ions (Na+), potassium ions (K+), magnesium ions (Mg2+), calcium ions (Ca2+), ammonium (NH4+), chemical oxygen demand (COD), nitrate nitrogen (NO3N), nitrites (NO2), total nitrogen (TN), and total phosphorus (TP). Site 1 = undisturbed site, site 2 = recently modified site, and site 3 = long-time modified (channelled) site. Measuring units are shown in square brackets. Table S3: Correlation matrix describing the relationship between crayfish abundance expressed as CPUE (response variable) and various physicochemical parameters of the water (explanatory variables). Figure S1: The variable importance of projection (VIPs) for explanatory variables of the first component (t1). VIPs > 1 indicate the explanatory variables that contribute most to the PLS model, while VIPs < 0.8 contribute little. Table S4: List of the stone crayfish samples and sequences used in the mitochondrial DNA analyses. The information comprises sampling site, COI haplotype ID, and GenBank accession numbers. Site 1 = undisturbed site, site 2 = recently modified site, and site 3 = long-time modified (channelled) site.

Author Contributions

Conceptualization, A.T., S.H. and I.M.; methodology, A.T., L.L., S.H. and I.M.; validation, A.T., S.H. and I.M.; formal analysis, A.T., L.L., S.H. and I.M.; investigation, A.T., L.L., L.Ž., M.T., D.G., M.G., J.Ć., S.H. and I.M.; resources, A.T., L.L., L.Ž., M.T., D.G., M.G., J.Ć., S.H. and I.M.; data curation, A.T., L.L., S.H. and I.M.; writing—original draft preparation, A.T. and L.L.; writing—review and editing, A.T., L.L., S.H. and I.M.; visualization, A.T. and L.L.; supervision, S.H. and I.M.; project administration, A.T.; funding acquisition, A.T. All authors have read and agreed to the published version of the manuscript.

Funding

This research was funded by The Second Public Call for Financing Student Activities by the Student Center of the University of Zagreb (402-09/21-01/01, 475-02-01-21-29) and the Department of Biology, Faculty of Science, University of Zagreb (602-04/21-01/5, 251-58-10603-21-20).

Institutional Review Board Statement

No institutional or national ethical guidelines exist for crayfish. Therefore, ethical review and approval were not required for this research. Required permission for sampling crayfish was obtained from the Ministry of Economy and Sustainable Development of the Republic of Croatia (UP/I-612-07/21-48/129, 517-10-1-1-21-4).

Data Availability Statement

All relevant data are provided in the Supplementary Materials.

Acknowledgments

We would like to thank Lina Vinković, Đina Nola, Božica Horvatić, Violeta Tarandek, and Vladimir Tarandek for their help during fieldwork; Dora Pavić for help with the PLS-R analyses; and the Institute for Medical Research and Occupational Health, Zagreb, for the analyses of water samples.

Conflicts of Interest

The authors declare no conflict of interest. The funders had no role in the design of the study; in the collection, analyses, or interpretation of the data; in the writing of the manuscript; or in the decision to publish the results.

References

  1. Kouba, A.; Petrusek, A.; Kozák, P. Continental-wide distribution of crayfish species in Europe: Update and maps. Knowl. Manag. Aquat. Ecosyst. 2014, 413, 5. [Google Scholar] [CrossRef]
  2. Souty-Grosset, C.; Holdich, D.; Noel, P.; Reynolds, J.D. (Eds.) Atlas of Crayfish in Europe; Muséum National D’histoire Naturelle: Paris, France, 2006. [Google Scholar]
  3. Maguire, I.; Klobučar, G.; Žganec, K.; Jelić, M.; Lucić, A.; Hudina, S. Recent changes in distribution pattern of freshwater crayfish in Croatia—Threats and perspectives. Knowl. Manag. Aquat. Ecosyst. 2018, 419, 2. [Google Scholar] [CrossRef]
  4. Jussila, J.; Vrezec, A.; Jaklič, T.; Kukkonen, H.; Makkonen, J.; Kokko, H. Aphanomyces astaci isolate from latently infected stone crayfish (Austropotamobius torrentium) population is virulent. J. Invertebr. Pathol. 2017, 149, 15–20. [Google Scholar] [CrossRef]
  5. Kozák, P.; Ďuriš, Z.; Petrusek, A.; Buřič, M.; Horká, I.; Kouba, A.; Kozubíková-Balcarová, E.; Policar, T. Crayfish Biology and Culture; University of South Bohemia in České Budějovice, Faculty of Fisheries and Protection of Waters: České Budějovice, Czechia, 2015. [Google Scholar]
  6. Marn, N.; Hudina, S.; Haberle, I.; Dobrović, A.; Klanjšček, T. Physiological performance of native and invasive crayfish species in a changing environment: Insights from Dynamic Energy Budget models. Conserv. Physiol. 2022, 10, coac031. [Google Scholar] [CrossRef] [PubMed]
  7. Article 17 Web Tool. Available online: https://www.eionet.europa.eu/article17/species/summary/?period=5&group=Arthropods&subject=Austropotamobius+torrentium®ion= (accessed on 5 December 2022).
  8. Convention of 19 September 1979 on the Conservation of European Wildlife and Natural Habitats; Council of Europe: Strasbourg, France, 1979.
  9. Directive, H. Council Directive 92/43/EEC of 21 May 1992 on the conservation of natural habitats and of wild fauna and flora. Off. J. Eur. Union 1992, 206, 7–50. [Google Scholar]
  10. Maguire, I.; Jelić, M.; Klobučar, G. Update on the distribution of freshwater crayfish in Croatia. Knowl. Manag. Aquat. Ecosyst. 2011, 401, 31. [Google Scholar] [CrossRef]
  11. Füreder, L.; Gherardi, F.; Souty-Grosset, C. Austropotamobius torrentium (errata version published in 2017). IUCN Red List. Threat. Species 2010, 4, T2431A121724677. [Google Scholar]
  12. Klobučar, G.I.V.; Podnar, M.; Jelić, M.; Franjević, D.; Faller, M.; Štambuk, A.; Gottstein, S.; Simić, V.; Maguire, I. Role of the Ddinaric Karst (western Balkans) in shaping the phylogeographic structure of the threatened crayfish Austropotamobius torrentium. Freshw. Biol. 2013, 58, 1089–1105. [Google Scholar] [CrossRef]
  13. Pârvulescu, L.; Pérez-Moreno, J.L.; Panaiotu, C.; Drăguț, L.; Schrimpf, A.; Popovici, I.; Zaharia, C.; Weiperth, A.; Gál, B.; Schubart, C.D.; et al. A journey on plate tectonics sheds light on European crayfish phylogeography. Ecol. Evol. 2019, 9, 1957–1971. [Google Scholar] [CrossRef]
  14. Lovrenčić, L.; Bonassin, L.; Boštjančić, L.L.; Podnar, M.; Jelić, M.; Klobučar, G.; Jaklič, M.; Slavevska-Stamenković, V.; Hinić, J.; Maguire, I. New insights into the genetic diversity of the stone crayfish: Taxonomic and conservation implications. BMC Evol. Biol. 2020, 20, 146. [Google Scholar] [CrossRef]
  15. Lucić, A.; Žganec, K. Istraživanje Populacija Potočnih Rakova (Austropotamobius torrentium) u Parku Prirode Medvednica Konačno Izvješće; Udruga za biološka istraživanja—BIOM: Zagreb, Croatia, 2010. [Google Scholar]
  16. Lucić, A.; Žganec, K.; Hudina, S. Monitoring Potočnih Rakova (Austropotamobius torrentium) na Području PP Medvednica Konačno Izvješće; Udruga za biološka istraživanja—BIOM: Zagreb, Croatia, 2012. [Google Scholar]
  17. Lucić, A.; Petljak, K.V.; Žganec, K. Monitoring Potočnih Rakova (Austropotamobius torrentium) na Području PP Medvednica Konačni Izvještaj; Udruga za biološka istraživanja—BIOM: Zagreb, Croatia, 2015. [Google Scholar]
  18. Maguire, I. Nacionalni Programi za Praćenje Stanja Očuvanosti Vrsta i Staništa u Hrvatskoj. Potočni rak ili rak Kamenjar Austropotamobius torrentium (Schrank, 1803); Državni Zavod za Zaštitu Prirode: Zagreb, Croatia, 2014; Available online: https://www.haop.hr/sites/default/files/uploads/dokumenti/03_prirodne/monitoring_prog/FINAL%20Austropotamobius_torrentium%2008-17.pdf (accessed on 18 November 2022).
  19. Frankham, R.; Briscoe, D.A.; Ballou, J.D. Introduction to Conservation Genetics; Cambridge University Press: Cambridge, UK, 2002. [Google Scholar]
  20. Allendorf, F.W.; Luikart, G.; Aitken, S.N. Conservation and the Genetics of Populations; Wiley-Blackwell: Oxford, UK, 2013. [Google Scholar]
  21. Schnabel, Z.E. The Estimation of total fish population of a lake. Am. Math. Mon. 1938, 45, 348–352. [Google Scholar] [CrossRef]
  22. Schumacher, F.X.; Eschmeyer, R.W. The estimate of fish population in lakes or ponds. Tenn. Acad. Sci. 1943, 18, 228–249. [Google Scholar]
  23. Maguire, I.; Klobučar, G. Size structure, maturity size, growth and condition index of stone crayfish (Austropotamobius torrentium) in North-West Croatia. Knowl. Manag. Aquat. Ecosyst. 2011, 401, 12. [Google Scholar] [CrossRef]
  24. Fulton, T.W. Twenty-Second Annual Report. The Rate of Growth of Fishes; Fisheries Board of Scotland: Edinburgh, UK, 1902; Volume 3, pp. 326–446. [Google Scholar]
  25. Folmer, O.; Black, M.; Hoeh, W.R.; Lutz, R.; Vrijenhoek, R. DNA primers for amplification of mitochondrial Cytochrome C oxidase subunit I from diverse metazoan invertebrates. Mol. Mar. Biol. Biotechnol. 1994, 3, 224–229. [Google Scholar]
  26. Hall, T.A. BioEdit: A user-friendly biological sequence alignment editor and analysis program for Windows 95/98/NT. Nucleic Acids Symp. Ser. 1999, 41, 95–98. [Google Scholar]
  27. Villesen, P. FaBox: An online toolbox for Fasta sequences. Mol. Ecol. Notes 2007, 7, 965–968. [Google Scholar] [CrossRef]
  28. Huelsenbeck, J.P.; Ronquist, F. MRBAYES: Bayesian inference of phylogenetic trees. Bioinformatics 2001, 17, 754–755. [Google Scholar] [CrossRef]
  29. Darriba, D.; Taboada, G.L.; Doallo, R.; Posada, D. jModelTest 2: More models, new heuristics and parallel computing. Nat. Methods 2012, 9, 772. [Google Scholar] [CrossRef]
  30. Rambaut, A.; Drummond, A.J.; Xie, D.; Baele, G.; Suchard, M.A. Posterior summarization in Bayesian phylogenetics using tracer 1.7. Syst. Biol. 2018, 67, 901–904. [Google Scholar] [CrossRef]
  31. Lovrenčić, L.; Temunović, M.; Bonassin, L.; Grandjean, F.; Austin, C.M.; Maguire, I. Climate change threatens unique genetic diversity within the Balkan biodiversity hotspot—The case of the endangered stone crayfish. Glob. Ecol. Conserv. 2022, 39, e02301. [Google Scholar] [CrossRef]
  32. Van Oosterhout, C.; Hutchinson, W.F.; Wills, D.P.M.; Shipley, P. Micro-Checker: Software for identifying and correcting genotyping errors in microsatellite data. Mol. Ecol. Notes 2004, 4, 535–538. [Google Scholar] [CrossRef]
  33. Peakall, R.; Smouse, P.E. GenAlEx 6.5: Genetic analysis in Excel. Population genetic software for teaching and research—An update. Bioinformatics 2012, 28, 2537–2539. [Google Scholar] [CrossRef]
  34. Goudet, J. FSTAT Version 2.9.4: A Program to Estimate and Test Population Genetics Parameters. Updated from Goudet (1995). Available online: https://www2.unil.ch/popgen/softwares/fstat.htm (accessed on 18 October 2022).
  35. Piry, S.; Luikart, G.; Cornuet, J.-M. BOTTLENECK: A computer program for detecting recent reductions in the effective population size using allele frequency data. J. Hered. 1999, 90, 502–503. [Google Scholar] [CrossRef]
  36. Pritchard, J.K.; Stephens, M.; Donnelly, P. Inference of population structure using multilocus genotype data. Genetics 2000, 155, 945–959. [Google Scholar] [CrossRef]
  37. Evanno, G.; Regnaut, S.; Goudet, J. Detecting the number of clusters of individuals using the software STRUCTURE—A simulation study. Mol. Ecol. 2005, 14, 2611–2620. [Google Scholar] [CrossRef]
  38. Earl, D.A.; Von Holdt, B.M. STRUCTURE HARVESTER: A website and program for visualizing STRUCTURE output and implementing the Evanno method. Conserv. Genet. Resour. 2012, 4, 359–361. [Google Scholar] [CrossRef]
  39. Kopelman, N.M.; Mayzel, J.; Jakobsson, M.; Rosenberg, N.A.; Mayrose, I. A program for identifying clustering modes and packaging population structure inferences across K. Mol. Ecol. Resour. 2015, 15, 1179–1191. [Google Scholar] [CrossRef]
  40. Jussila, J.; Edsman, L.; Maguire, I.; Diéguez-Uribeondo, J.; Theissinger, K. Money kills native ecosystems: European crayfish as an example. Front. Ecol. Evol. 2021, 9, 648495. [Google Scholar] [CrossRef]
  41. Dudgeon, D. Multiple threats imperil freshwater biodiversity in the Anthropocene. Curr. Biol. 2019, 29, R960–R967. [Google Scholar] [CrossRef]
  42. Bohl, E. An isolated population of the white-clawed crayfish (Austropotamobius pallipes) in the principality of Liechtenstein. Bull. Français De La Pêche Et De La Piscic. 1997, 347, 701–712. [Google Scholar] [CrossRef]
  43. Cooper, A.R.; Infante, D.M.; Daniel, W.M.; Wehrly, K.E.; Wang, L.; Brenden, T.O. Assessment of dam effects on streams and fish assemblages of the conterminous USA. Sci. Total Environ. 2017, 586, 879–889. [Google Scholar] [CrossRef]
  44. Nevers, R.J. A State-of-The-Unionids Address. In Conservation and Management of Freshwater Mussels. Proceedings of a UMRCC Symposium; Upper Mississippi River Conservation Committee: Rock Island, TN, USA, 1993; pp. 1–10. [Google Scholar]
  45. Page, L.M.; Pyron, M.; Cummings, K.S. Impacts of fragmentation on midwestern aquatic organisms. In Conservation in Highly Fragmented Landscapes; Springer: Boston, MA, USA, 1997; pp. 189–212. [Google Scholar]
  46. Light, T.; Erman, D.C.; Myrick, C.; Clarke, J. Decline of the shasta crayfish (Pacifastacus fortis Faxon) of Northeastern California. Conserv. Biol. 1995, 9, 1567–1577. [Google Scholar] [CrossRef]
  47. Maguire, I.; Gottstein-Matočec, S. The distribution pattern of freshwater crayfish in Croatia. Crustaceana 2004, 77, 25–48. [Google Scholar] [CrossRef]
  48. Wilcove, D.S.; Rothstein, D.; Dubow, J.; Phillips, A.; Losos, E. Quantifying threats to imperiled species in the United States. BioScience 1998, 48, 607–615. [Google Scholar] [CrossRef]
  49. Lodge, D.M.; Hill, A.M. Factors governing species composition, population size, and productivity of cool-water crayfishes. Nord. J. Freshw. Res. 1994, 69, 111–136. [Google Scholar]
  50. Smith, G.R.T.; Learner, M.A.; Slater, F.M.; Foster, J. Habitat features important for the conservation of the native crayfish Austropotamobius pallipes in Britain. Biol. Conserv. 1996, 75, 239–246. [Google Scholar] [CrossRef]
  51. Huber, M.G.J.; Sschubart, C.D. Distribution and reproductive biology of Austropotamobius torrentium in Bavaria and documentation of a contact zone with the alien crayfish Pacifastacus leniusculus. Bull. Français De La Pêche Et De La Piscic. 2005, 376–377, 759–776. [Google Scholar] [CrossRef]
  52. Streissl, F.; Hödl, W. Growth, Morphometrics, size at maturity, sexual dimorphism and condition index of Austropotamobius torrentium Schrank. Hydrobiologia 2002, 477, 201–208. [Google Scholar] [CrossRef]
  53. Pöckl, M.; Streissl, F. Austropotamobius torrentium as an Indicator for Habitat Quality in Running Waters? Bull. Français De La Pêche Et De La Piscic. 2005, 376–377, 743–758. [Google Scholar] [CrossRef]
  54. Kadlecová, K.; Bílý, M.; Maciak, M. Movement Patterns of the Co-Occurring Species Astacus Astacus (Noble Crayfish) and Austropotamobius Torrentium (Stone Crayfish). Fundam. Appl. Limnol. Arch. Für Hydrobiol. 2012, 180, 351–360. [Google Scholar] [CrossRef]
  55. Anastácio, P.M.; Marques, J.C. Crayfish (Procambarus clarkii) condition throughout the year in the lower Mondego River Valley, Portugal. Crustaceana 1998, 71, 593–602. [Google Scholar] [CrossRef]
  56. Bohl, E. Comparative studies on crayfish brooks in Bavaria (Astacus astacus L., Austropotamobius torrentium Schr.). Freshw. Crayfish 1987, 7, 287–294. [Google Scholar]
  57. Demers, A.; Soutty-Grosset, C.; Trouilhé, M.C.; Füreder, L.; Renai, B.; Gherardi, F. Tolerance of three European native species of cayfish to hypoxia. Hydrobiologia 2006, 560, 425–432. [Google Scholar] [CrossRef]
  58. Pârvulescu, L.; Pacioglu, O.; Hamchevici, C. The assessment of the habitat and water quality requirements of the stone crayfish (Austropotamobius torrentium) and noble crayfish (Astacus astacus) species in the rivers from the Anina Mountains (SW Romania). Knowl. Manag. Aquat. Ecosyst. 2011, 401, 03. [Google Scholar] [CrossRef]
  59. Holdich, D.M. Biology of Freshwater Crayfish; Blackwell Science: Oxford, UK, 2002. [Google Scholar]
  60. Carvalho, C.S.; Lanes, É.C.M.; Silva, A.R.; Caldeira, C.F.; Carvalho-Filho, N.; Gastauer, M.; Imperatriz-Fonseca, V.L.; Júnior, W.N.; Oliveira, G.; Siqueira, J.O.; et al. Habitat loss does not always entail negative genetic consequences. Front. Genet. 2019, 10, 1011. [Google Scholar] [CrossRef]
  61. Gladstone, N.S.; Garrison, N.L.; Lane, T.; Johnson, P.D.; Garner, J.; Whelan, N.V. Population genomics reveal low differentiation and complex demographic histories in a highly fragmented and endangered freshwater mussel. Aquat. Conserv. Mar. Freshw. Ecosyst. 2022, 32, 1235–1248. [Google Scholar] [CrossRef]
  62. Hurt, C.; Hildreth, P.; Williams, C. A Genomic perspective on the conservation status of the endangered nashville crayfish (Faxonius shoupi). Conserv. Genet. 2022, 23, 589–604. [Google Scholar] [CrossRef]
  63. Markert, J.A.; Champlin, D.M.; Gutjahr-Gobell, R.; Grear, J.S.; Kuhn, A.; McGreevy, T.J.; Roth, A.; Bagley, M.J.; Nacci, D.E. Population genetic diversity and fitness in multiple environments. BMC Evol. Biol. 2010, 10, 205. [Google Scholar] [CrossRef]
  64. Wcenter, L.I.; Tregenza, T.; Hosken, D.J. Inbreeding, inbreeding depression and extinction. Conserv. Genet. 2007, 9, 833–843. [Google Scholar] [CrossRef]
  65. Schlaepfer, D.R.; Braschler, B.; Rusterholz, H.-P.; Baur, B. Genetic effects of anthropogenic habitat fragmentation on remnant animal and plant populations: A meta-analysis. Ecosphere 2018, 9, e02488. [Google Scholar] [CrossRef]
  66. Leigh, D.M.; Hendry, A.P.; Vázquez-Domínguez, E.; Friesen, V.L. Estimated six per cent loss of genetic variation in wild populations since the industrial revolution. Evol. Appl. 2019, 12, 1505–1512. [Google Scholar] [CrossRef]
  67. Lino, A.; Fonseca, C.; Rojas, D.; Fischer, E.; Ramos Pereira, M.J. A meta-analysis of the effects of habitat loss and fragmentation on genetic diversity in mammals. Mamm. Biol. 2019, 94, 69–76. [Google Scholar] [CrossRef]
  68. Barnett, Z.C.; Adams, S.B.; Ochs, C.A.; Garrick, R.C. Crayfish populations genetically fragmented in streams impounded for 36–104 years. Freshw. Biol. 2020, 65, 768–785. [Google Scholar] [CrossRef]
Figure 1. Stone crayfish (Austropotamobius torrentium). Photo by Denis Lešić.
Diversity 15 00591 g001
Figure 2. Position of sampling sites along the Kustošak Stream: (1) undisturbed site, (2) recently modified site, and (3) long-time modified (channelled) site.
Diversity 15 00591 g002
Figure 3. Differences in recorded CPUE between sites (site 1 = undisturbed site, site 2 = recently modified site, and site 3 = long-time modified (channelled) site). Statistically significant differences are marked with an asterisk (*).
Diversity 15 00591 g003
Figure 4. (a) Differences in total length of crayfish between sites; (b) differences in weight of crayfish between sites. Site 1 = undisturbed site, site 2 = recently modified site, and site 3 = long-time modified (channelled) site. Statistically significant differences are marked with an asterisk (*).
Diversity 15 00591 g004
Figure 5. Size class frequency histograms of captured crayfish per site: site 1 = undisturbed site, site 2 = recently modified site, and site 3 = long-time modified (channelled) site.
Diversity 15 00591 g005
Figure 6. Correlation radar describing the relationships between crayfish abundance expressed as CPUE (response variable, Y; blue line) and various physicochemical parameters of the water (explanatory variables, X; red lines). The percentages of variances in X and Y explained by each variable are indicated on the respective axes.
Diversity 15 00591 g006
Figure 7. Phylogenetic tree of the stone crayfish based on COI haplotypes obtained through Bayesian analysis. Numbers at the nodes indicate Bayesian posterior probabilities (values > 0.91 are indicated). Haplotypes from the Kustošak Stream recovered within the phylogroup Central and South Eastern Europe (CSE) are indicated in bold, and newly obtained haplotypes are indicated with an asterisk. For easier interpretation, the remaining mitochondrial phylogroups, according to Lovrenčić et al. [14], were collapsed: Gorski Kotar (GK), Lika and Dalmatia (LD), Žumberak, Plitvice and Bjelolasica (ŽPB), southern Balkans (SB), Banovina (BAN), Zeleni Vir (ZV), Apuseni Mountain (APU), and Kordun (KOR) sensu Lovrenčić et al. [14]. Austropotamobius pallipes was chosen as an outgroup (GenBank accession numbers for COI: KX369673, KX369674).
Diversity 15 00591 g007
Figure 8. Genetic structure of stone crayfish at the three studied sites based on seven microsatellites inferred by STRUCTURE with the suggested K = 2 genetic clusters.
Diversity 15 00591 g008
Table 1. Physicochemical parameters (18) of water measured in the study.
ParameterAbbreviationMeasuring Unit
1Dissolved oxygenO2mg/L
2Water temperaturew. temp.°C
3Water pHpH/
4Oxidation reduction potentialORPmV
5Water turbidityturbidityNTU
6ChloridesClmg/L
7NitratesNO3mg/L
8SulphatesSO42−mg/L
9Sodium ionsNa+mg/L
10Potassium ionsK+mg/L
11Magnesium ionsMg2+mg/L
12Calcium ionsCa2+mg/L
13AmmoniumNH4+mg/L
14Chemical oxygen demandCODmg/L
15Nitrate nitrogenNO3Nmg/L
16NitritesNO2mg/L
17Total nitrogenTNmg/L
18Total phosphorusTPmg/L
Table 2. Results of descriptive statistical analysis (mean ± standard deviation) of parameters: total length (TL), weight (w), Fulton’s condition factor (FCF), and catch per unit effort (CPUE) of male and female individuals at different sites (site 1 = undisturbed site, site 2 = recently modified site, and site 3 = long-time modified (channelled) site).
SiteSexTL [mm]w [g]FCF [g/mm3]CPUE
1male49.97585 ± 13.768686.57317 ± 6.508220.00435 ± 0.000862.19756 ± 0.96475
1female54.22271 ± 12.920856.87879 ± 4.472180.00390 ± 0.000742.51212 ± 0.99591
2male62.50467 ± 9.8291110.5000 ± 5.344990.00402 ± 0.000521.13000 ± 0.30529
2female65.90153 ± 12.5604211.30769 ± 5.504680.00417 ± 0.003181.10370 ± 0.31191
3male59.93421 ± 11.5453610.23684 ± 5.460380.00556 ± 0.006590.94210 ± 0.24339
3female65.24272 ± 8.9962110.54545 ± 4.516920.00358 ± 0.000460.95000 ± 0.25023
Table 3. Estimation of total population size per site with two mark-recapture models, the Schumacher–Eschmeyer method and the Schnabel method. For the Schnabel method, the lower and upper confidence limits are shown.
Schumacher–Eschmeyer MethodSchnabel Method
siteestimationestimationlower confidence limitupper confidence limit
1328346251555
21619877139
387604686
Table 4. Summary results across seven microsatellite loci of population genetic diversity of the studied stone crayfish sites. P—proportion of polymorphic loci, N—sample size, NA—average number of alleles/locus, AR—allelic richness, APR—number of private alleles, uHE—unbiased expected heterozygosity, HO—observed heterozygosity, FIS—inbreeding coefficient, and PHWE—probability of deviation from Hardy–Weinberg equilibrium after Bonferroni adjustments (not significant—ns).
SiteNPNAARAPRuHEHOFISHW
11514.003.7350.5970.5240.126ns
21313.713.5630.4960.4650.065ns
31213.863.7350.5690.5020.122ns
Table 5. Probability (bold indicates significant p-values; p < 0.05) of bottleneck for stone crayfish populations using Wilcoxon sign rank test under three different mutational models: infinite allele model (IAM), stepwise mutation model (SMM), and two-phase model (TPM). Significant differences are marked in bold.
SiteWilcoxon Sign-Rank Test 1-TailWilcoxon Sign-Rank Test 2t
IAMTPMSMMIAMTPMSMM
10.030.150.410.050.300.81
20.340.710.950.690.690.30
30.040.340.660.080.690.81
Disclaimer/Publisher’s Note: The statements, opinions and data contained in all publications are solely those of the individual author(s) and contributor(s) and not of MDPI and/or the editor(s). MDPI and/or the editor(s) disclaim responsibility for any injury to people or property resulting from any ideas, methods, instructions or products referred to in the content.

