 Yunjie Liu
 Hanhan Zhang
 Changming Ma
 Bingxiang Liu
 Changjun Ding3*
- 1College of Forestry, Hebei Agricultural University, Baoding, China
- 2The County Forestry Development Service Center, Handan, China
- 3State Key Laboratory of Tree Genetics and Breeding, Key Laboratory of Tree Breeding and Cultivation of State Forestry Administration, Research Institute of Forestry, Chinese Academy of Forestry, Beijing, China
This study clarified the characteristics and influencing factors of sap flow in Populus tomentosa Carr. and Salix babylonica L., and verified the applicability of Granier’s original formula for measuring the sap flow of the two species, aimed to provide a basis for the accurate assessment of tree transpiration. P. tomentosa and S. babylonica were used as research objects, their sap flow was measured by the thermal dissipation probe method (TDP), together with changes in meteorological factors and soil water content. Meanwhile, the transpiration of both species was measured by the liquid level equilibrium method (LLE) to verify the applicability of Granier’s original formula. We found that: (1) the sap flow velocity of P. tomentosa and S. babylonica under typical sunny and cloudy conditions showed unimodal or bimodal changes, which were highly significantly correlated with meteorological factors (P < 0.01), but they were all small and poorly correlated with meteorological factors on rainy days. (2) The sap flow velocity of both species was significantly and negatively correlated (P < 0.05) with the daily change in stem and soil water content at 10–20 cm. (3) Compared to that calculated with the LLE method, the sap flows of the two species calculated by the TDP technique using Granier’s original formula were seriously underestimated, with error rates of -60.96% and -63.37%, respectively. The Granier’s correction formulas for P. tomentosa and S. babylonica established by the LLE method were Fd = 0.0287K1.236 (R2 = 0.941) and Fd = 0.0145K0.852 (R2 = 0.904), respectively, and the combined correction formula was Fd = 0.0235K1.080 (R2 = 0.957). It was verified that the errors of sap flow calculated by the specific correction formulas for P. tomentosa and S. babylonica were -6.18% and -5.86%, and those calculated by the combined correction formula were -12.76% and -2.32%, respectively. Therefore, the characteristics of the sap flow velocity of P. tomentosa and S. babylonica on sunny, cloudy and rainy days were different and significantly influenced by meteorological factors. The original Granier’s formula for calculating their sap flow resulted in a large error, but can be measured more accurately by constructing specific correction and combination formulas through the LLE method.
Introduction
Tree transpiration plays an important role in the water balance of forest trees (Chang et al., 2014). Trunk sap flow is a direct indicator of tree transpiration that reflects the physiological characteristics of individual trees and is critical in maintaining hydraulic transport between the soil and atmosphere as well as in providing oxygen to thin-walled xylem cells and promoting nutrient uptake (Hubbart et al., 2007; Mcdowell et al., 2010). Studies have shown that plant sap flow is mainly influenced by meteorological factors and soil moisture (Yang et al., 2019; Zhao et al., 2021). Meteorological factors affect the water potential gradient between the boundary layer and the inner cavity of the leaves, thus affect the opening and closing of stomata (Chen et al., 2010). Kanalas et al. (2010) concluded that soil moisture is the fundamental factor affecting transpiration intensity and that if the soil moisture content is minimal, then the sap flow is minimal regardless of the meteorological factors driving it. The plant stem is the pathway through which soil water enters the leaves for transpiration (Tyree and Sperry, 1988), and changes in water tension in the trunk as the tree transpires cause microvariations in trunk diameter (Martínez-Vilalta et al., 2007). The shrinkage of the trunk indicates the depletion of water stored in the xylem, and the process of its diurnal variation indicates the sum of all external and internal conditions that affect the water relationships of the tree (Zweifel and Häsler, 2001). Therefore, the variations in trunk sap flow and stems at the daily scale may be able to jointly reflect the response of plant water use to changes in environmental conditions.
The thermal dissipation probe method (TDP) is a way of measuring stem sap flow velocity obtained by Granier after experiments, and it is widely used because of its relatively reliable measurement results, simple operation, and low cost (Liu et al., 2011; Molina et al., 2019). However, in recent years, many scholars have begun to question its accuracy, and it is generally believed that the measured values of trunk sap flow are lower than the actual values (Liu et al., 2012; Rana et al., 2019; Dix and Aubrey, 2021). Pasqualotto et al. (2019) found in Corylus avellana L. trunk sap flow that the original Granier’s formula underestimated the effective transpiration of the tree by 60%. Xie and Wan (2018) found that the errors in trunk sap flow measured by TDP ranged from 40 to 80% for Quercus variabilis Bl. and more than 80% for Robinia pseudoacacia L. It can be concluded that Granier’s original formula is not applicable to all tree species, and Smith and Allen (1996) recommended that the Granier formula coefficients be calibrated for each tree species. Currently, the in vitro stem weighing method is the main test method for sap flow correction. For example, the sap flow of Pinus caribaea Morelet, Pinus sylvestris L., Fagus grandifolia subsp., and Tamarix ramosissima Ledeb. were corrected by this method (Hultine et al., 2010; Steppe et al., 2010; Fan et al., 2018), and the fitting effect was better because the experimental conditions were controlled, reducing operational errors and external influences. However, the in vitro stem weighing method is performed under positive pressure, which is inconsistent with the vacuum state of trees under natural conditions and may also lead to the formation of embolism in the xylem and increased resistance to transport, resulting in an underestimation of the true values (Schenk et al., 2013; Fuchs et al., 2017). The whole-tree container weighing method is an accepted method but has problems such as invariable operation and higher labor intensity (Ma et al., 2021). However, the liquid level equilibrium (LLE) used in this paper is a new method of sap flow calibration formed by combining the whole-tree container method and the marsupial bottle water control method (Ladefoged, 1960; Roberts, 1977; Knight et al., 1981), and it is accurate in measurement and can be used as a base for simultaneous comparison and water consumption correction.
Currently, the main ecological problems in most areas of China are low per capita forest and green space, scarcity of water resources, and insecurity of ecological water (Gao et al., 2011). If we can accurately calculate the water consumption of forest trees and then realize precise irrigation, it is of certain importance for the effective use of ecological water resources in China. Therefore, in this paper, Populus tomentosa Carr. and Salix babylonica L., the main fast-growing timber forest species in northern China (Wang et al., 2018; Qu et al., 2022), were the objects of the research, and the changes in sap flow were continuously measured using TDP and the LLE methods and combined with the continuous changes in meteorological factors, soil moisture and radial direction of the trunk. The purpose of this paper is to answer the following questions: (1) changing characteristics and influencing factors of sap flow velocity, (2) verification of the original Grainer formulas, and (3) correction of the original Grainer formulas of P. tomentosa and S. babylonica, so as to reveal the transpiration water consumption pattern and water consumption capacity of the two species, and provide theoretical guidance for the accurate assessment of transpiration of major fast-growing timber forest species and the utilization and management of water resources, which is of great significance to improve the economic and ecological benefits of forest land in China.
Materials and methods
Study site
This experiment was conducted in the West Campus of Hebei Agricultural University in Baoding, Hebei Province, China (N38° 48′23″, E115° 24″58′, 20 m above sea level). The area is located in central Hebei Province and belongs to the warm temperate continental monsoon climate zone. The average annual temperature is 12°C, the average annual sunshine hours are 2,511 h. The average annual precipitation is approximately 575.9 mm, which is mainly concentrated in June—August, with the highest precipitation in July. The average annual wind speed is 1.8 m⋅s–1, and the average annual evaporation is approximately 1,430 mm.
The experiment period was from August to October of 2021. In April of 2021, nine P. tomentosa and S. babylonica specimens, each 3 years old, with healthy growth, without diseases or pests, and with straight trunks, were selected from the Science and Technology Park of Hebei Agricultural University and transplanted to the West Campus of Hebei Agricultural University and planted in large containers. The containers were 54.5 cm in diameter at the top, 41.0 cm in diameter at the bottom, and 41.0 cm in height, with a water supply and drainage port at the bottom. To make the drainage smooth, the barrel was padded with stones approximately 4 cm high. After transplanting, cultivated on soil containing nutrient substrate with reasonable water and fertilizer management, and after stabilizing growth, three sample trees with good and consistent growth of each P. tomentosa and S. babylonica were selected for the test (Table 1). At the beginning of the experiment, the containers were wrapped in all directions with radiation-proof films to prevent the evaporation of soil moisture and to reduce the damage of the containers by solar radiation. During the whole experiment, the containers were not always wrapped. Each experiment was conducted on 3–7 consecutive sunny days, and at the end of the experiment, the wrapped radiation-proof films were removed and the soil was allowed to breathe normally for about 3 days before the next experiment, thus avoiding the effect of long-term soil wrapping on the growth of the sample trees.
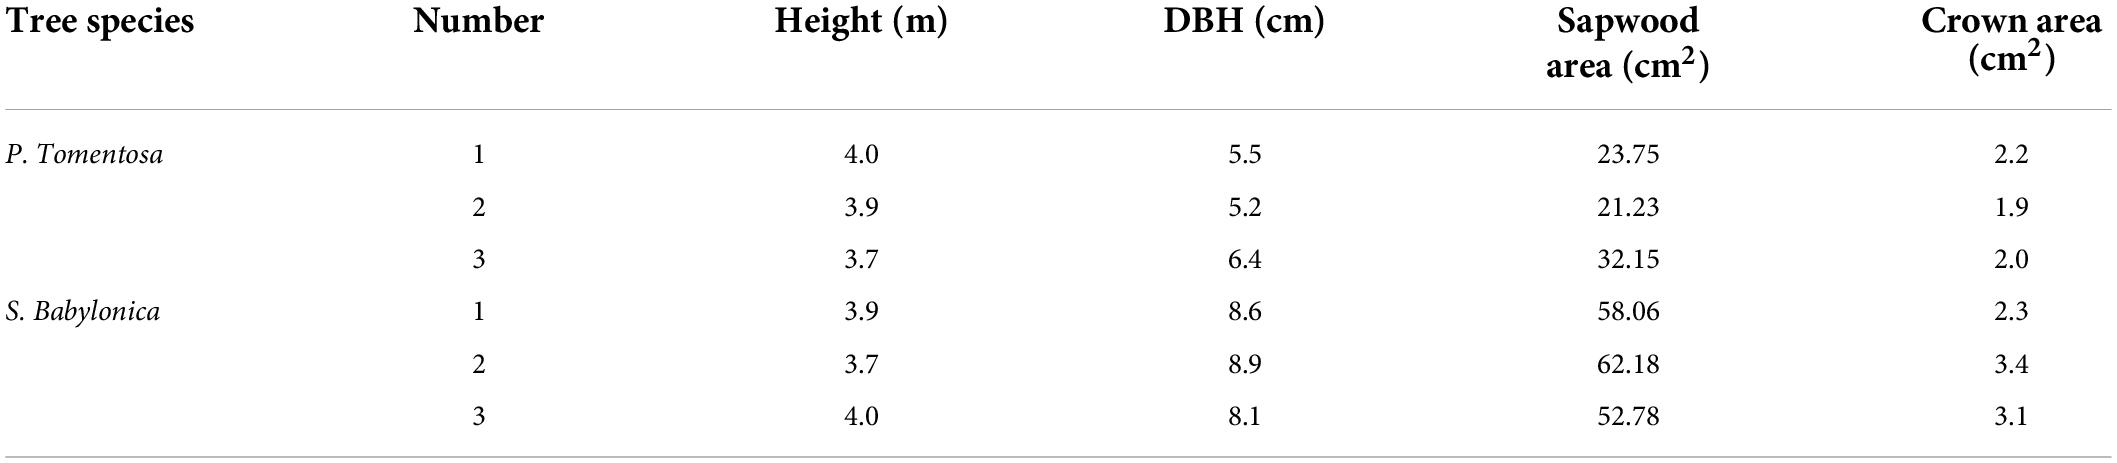
Table 1. Basic characteristics of sample trees.
Research methods
Measurement of sap flow velocity by thermal dissipation probe method
The sap flow velocity is measured by TDP. A set of thermal dissipation probes (AV-3665R, Rainroot Scientific Ltd., China) was installed in each tree, and the distance between the two probes is 10 cm. The basic principle is that two probes composed of thermal elements are inserted into the sapwood, and the probe inserted on top is heated using a constant current, while the probe below serves as a control. As the heat transfer from the sapwood increases with the stem flow velocity, more heat is removed from the heating probe, resulting in a temperature difference. The temperature difference between the two probes is greatest when the stem flow velocity is zero or very small (ΔTmax). 20 mm probes are used, powered by a 12 V rechargeable battery.
The installation was scheduled for July 2021. The probes were installed at 1.3 m above ground in the trees. First, the rough bark of the sample wood was scraped off at the probe mounting point, and then two vertical holes were drilled with a drill of a specific specification into which the probes were inserted. After the probes were inserted, they were clamped with a foam block and wrapped with insulating and antiradiation material after being fixed with tape. Finally, the probes were sealed with tape to prevent rainwater from entering. The whole stem flow velocity measurement system, including the stem flow meter, was composed of the TDP feedback line and data collector, which was used to collect and record the sap flow data automatically with a sampling frequency of 60 s and a data collection interval of 10 min. The sap flow velocity was calculated by Granier’s original formula (Granier, 1985) as follows:
Where Fd is the sap flow velocity (cm3⋅cm–2⋅S–1); Fs is the sap flow (cm3⋅S–1); ΔTmax is the maximum temperature difference of the probes when the sap flow velocity is zero or very small. The weakest sap flow velocity of each day generally occurs in the early morning hours, and the ΔTmax is determined using the maximum temperature difference over a 3-day period in this study; ΔT is the temperature difference when sap flow velocity is occurring; As is the sapwood area of the sample (cm2).
The cumulative sap flow volume S (cm3) is:
Where n is the number of collected samples; Fsi is the sap flow (cm3⋅S–1) at the i-th collection; Δt is the sampling interval time (s).
Results obtained with continuously heated TDP probes showed that the natural thermal gradient had a direct effect on the sap flow measurement with a large potential error, and the natural thermal gradient of more than 0.2°C was not negligible (Do and Rocheteau, 2002). Before conducting the experiment, we referred to the results of Ma (2020) for the sap flow measurement of the same tree species in the region and found that their natural thermal gradients were all below 0.2°C. Therefore, we neglected the effect of the natural thermal gradient in our experiment.
Measurement of transpiration by liquid level equilibrium method
The transpiration is measured by LLE. Water levels of barrel-planted P. tomentosa and S. babylonica are recorded under continuous sunny, windless weather using a marsupial bottle, which is a bottle made of special glass (5 cm inner diameter, 5.6 cm outer diameter, 100 cm height). The upper end of the bottle has a vent, the lower end contains the vent at 8 cm above the ground and the water inlet at 3 cm from the ground, and the water inlet and the bottom of the barrel of the two drainage ports are connected with polyvinyl chloride (PVC) pipe to the end of the door valve to prevent the water from entering the barrel when filling the bottle. When filling the bottle, the door valve is closed, the upper exhaust port is opened, the air flows, and the atmospheric pressure is stable. When the water level reaches approximately 90 cm, the upper exhaust port is blocked, the door valve is opened, and the vacuum state is maintained in the bottle. When the water in the barrel reaches saturation, the height of the falling water level is recorded. The recording time was 6:00–20:00, and the water level change was recorded every half hour. To avoid the effect of sunlight on the bottle, it was wrapped with radiation-proof film. The difference in water level height between two consecutive records of the bottle multiplied by the bottom area is the transpiration of P. tomentosa and S. babylonica in half an hour (Figure 1). The marsupial bottle has the ability to control the water level and automatic replenishment, which allows the water level inside the planting container to be maintained at an appropriate level. Based on the water balance principle, the amount of water consumed in the marsupial bottle is equal to the amount of water consumed by the tree in the well-packed planting container.
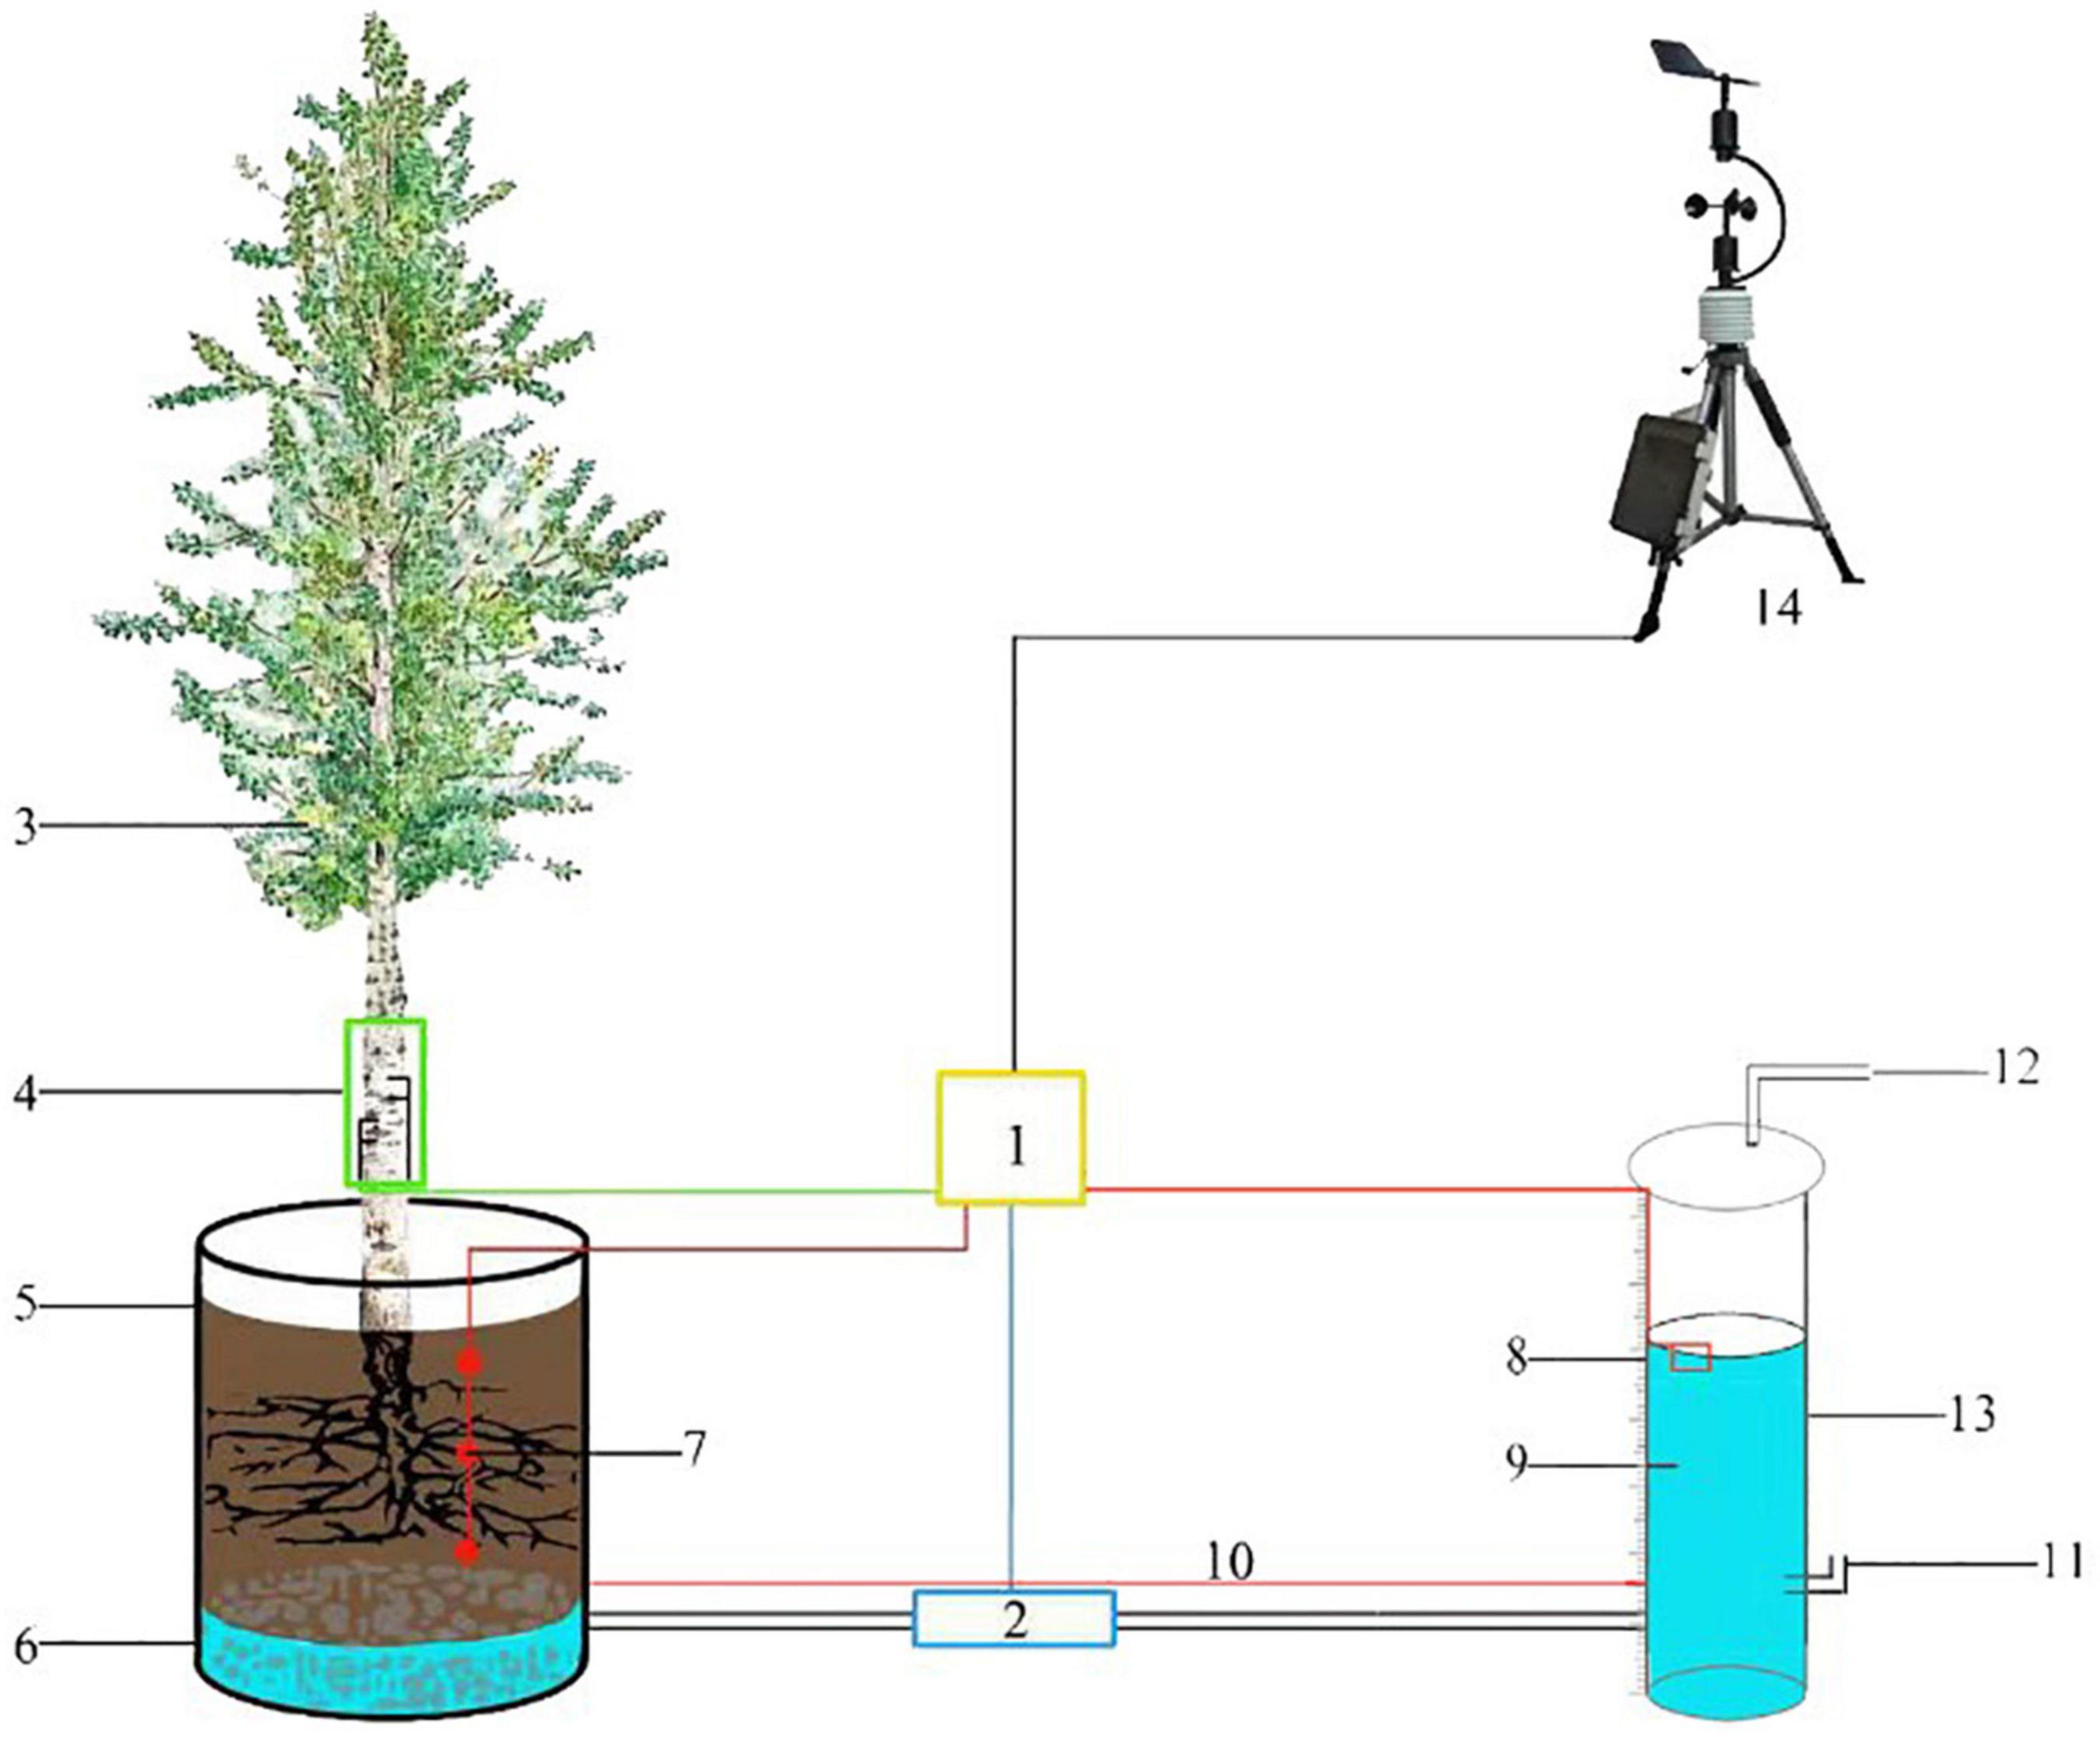
Figure 1. Schematic diagram of LLE method for measuring transpiration. 1, Data collector; 2, Switch; 3, Sample tree; 4, TDP; 5, Planting container; 6, Permeable matrix; 7, Soil moisture probe; 8, Scale line; 9, Water; 10, Equilibrium water level; 11, Intake pipe; 12, Exhaust pipe; 13, Marsupial bottle; 14, Weather station.
Monitoring of soil moisture transport
A soil moisture monitor (TH302, Tang Hua Ltd., China) was used to monitor the change in soil moisture transport. Its working principle is to use probes to monitor the moisture in the soil in real time and then reflect the change in soil moisture content. The soil moisture monitoring probes were inserted into the two species, P. tomentosa and S. babylonica. The probes were inserted at soil depths of 10, 20, and 30 cm and were covered with soil. The other end of the probes were connected to a universal data collector, and the data collector was connected by Bluetooth to THHelper software on a cell phone. The data were recorded and stored at a time interval of 5 min.
Monitoring change of diameter at breast height
The change in diameter at breast height (DBH) was monitored using a trunk radial change recorder (DBL60, ICT International, Australia), which has a high resolution and is capable of measuring small changes in the stem to micrometer (μm) level accuracy. The principle of the operation is to monitor the stem change in real time using the relationship between the pressure and the sensor due to the radial variation in the trunk that exerts pressure on the fixed probe. The trunk radial change recorders were installed at the stem of each tree species (1.5 m above ground level) before the start of the formal experiment and were set to record and store data once every 30 min.
Monitoring of meteorological factors
During the test period, solar radiation (RA, W⋅m–2), relative air humidity (RH, %), atmospheric temperature (TA, °C), wind speed (WS, m⋅s–1), rainfall (Rain, mm) were automatically monitored by a weather station (RR-9170, Rainroot Scientific Ltd., China) located approximately 5 m from the sample site. The sampling interval was 10 min for recording and storage. The vapor pressure deficit (VPD, kPa) was calculated by the formula (Zhao et al., 2017):
Determination of sapwood area
At the end of the test, the trunk core was drilled at a height of 1.3 m using a growth cone, and then the drilled core was dyed to observe the areas of sapwood and heartwood distribution, and the sapwood thickness was measured and recorded statistically to determine the sapwood area (Dang et al., 2020).
Data statistics and analysis
The water consumption of the sample trees calculated by Granier’s original formula is the sap flow velocity, the water consumption recorded by LLE is the transpiration, and the transpiration divided by the sapwood area is the transpiration velocity. To facilitate verification and correction, the units are standardized to cm3⋅cm–2⋅s–1.
The transpiration measured by LLE was used as a benchmark to verify whether there was any error in the sap flow velocity measured by TDP. The temperature difference coefficient (K) measured by TDP was used as the horizontal axis, and the transpiration velocity measured by LLE was used as the vertical axis to establish calibration equations for P. tomentosa and S. babylonica. Then, the calibration equations of each tree species were used to test the sap flow of the corresponding tree species and to verify the validity of the equations. The data of the two species were combined to fit Granier’s correction formula for the bulkwood species, and the formula was tested against the sap flow velocity of the two species measured by TDP to verify the validity of Granier’s correction formula for bulkwood species.
Relative to the transpiration velocity measured by LLE, the coefficient of determination (R2) and the Willmott consistency index (D) were used to test the appropriateness of the calibration formulas, the root mean square error (RMSE) and the mean absolute error (MAE) were used to test the accuracy of the calibration formulas and transpiration velocity, and the mean bias error (MBE) was used to determine the deviation of the calibration formulas and transpiration velocity.
Where, n is the number of observations; Ei is the sap flow velocity of the calibration equations; Oi is the transpiration velocity, and is the average of the transpiration velocity. The closer R2 is to 1, the better the fitted model; the D index is close to 1, and the closer RMSE, MAE, and MBE are to 0, indicating that the transpiration velocity is in good agreement with the sap flow velocity of the calibration equations (Abbas et al., 2011).
Microsoft Excel 2016 was used to organize and calculate the original data, and SPSS 24.0 was applied to analyze the correlation between environmental factors and sap flow velocity.
Results and analysis
Characteristics of changes in sap flow velocity and influencing factors
Characteristics of changes in sap flow velocity
Figure 2 shows that the daily changes in sap flow velocity of P. tomentosa and S. babylonica under typical sunny, cloudy and rainy conditions showed an increasing and then decreasing pattern, and the sap flow velocity was sunny > cloudy > rainy. The sap flow velocity of P. tomentosa showed a “single-peak” pattern of change on sunny days, a “double-peak” pattern on cloudy days, and fluctuated very little on rainy days. The sap flow velocity of S. babylonica showed a “single-peak” pattern on sunny and cloudy days, and it was also very small on rainy days.
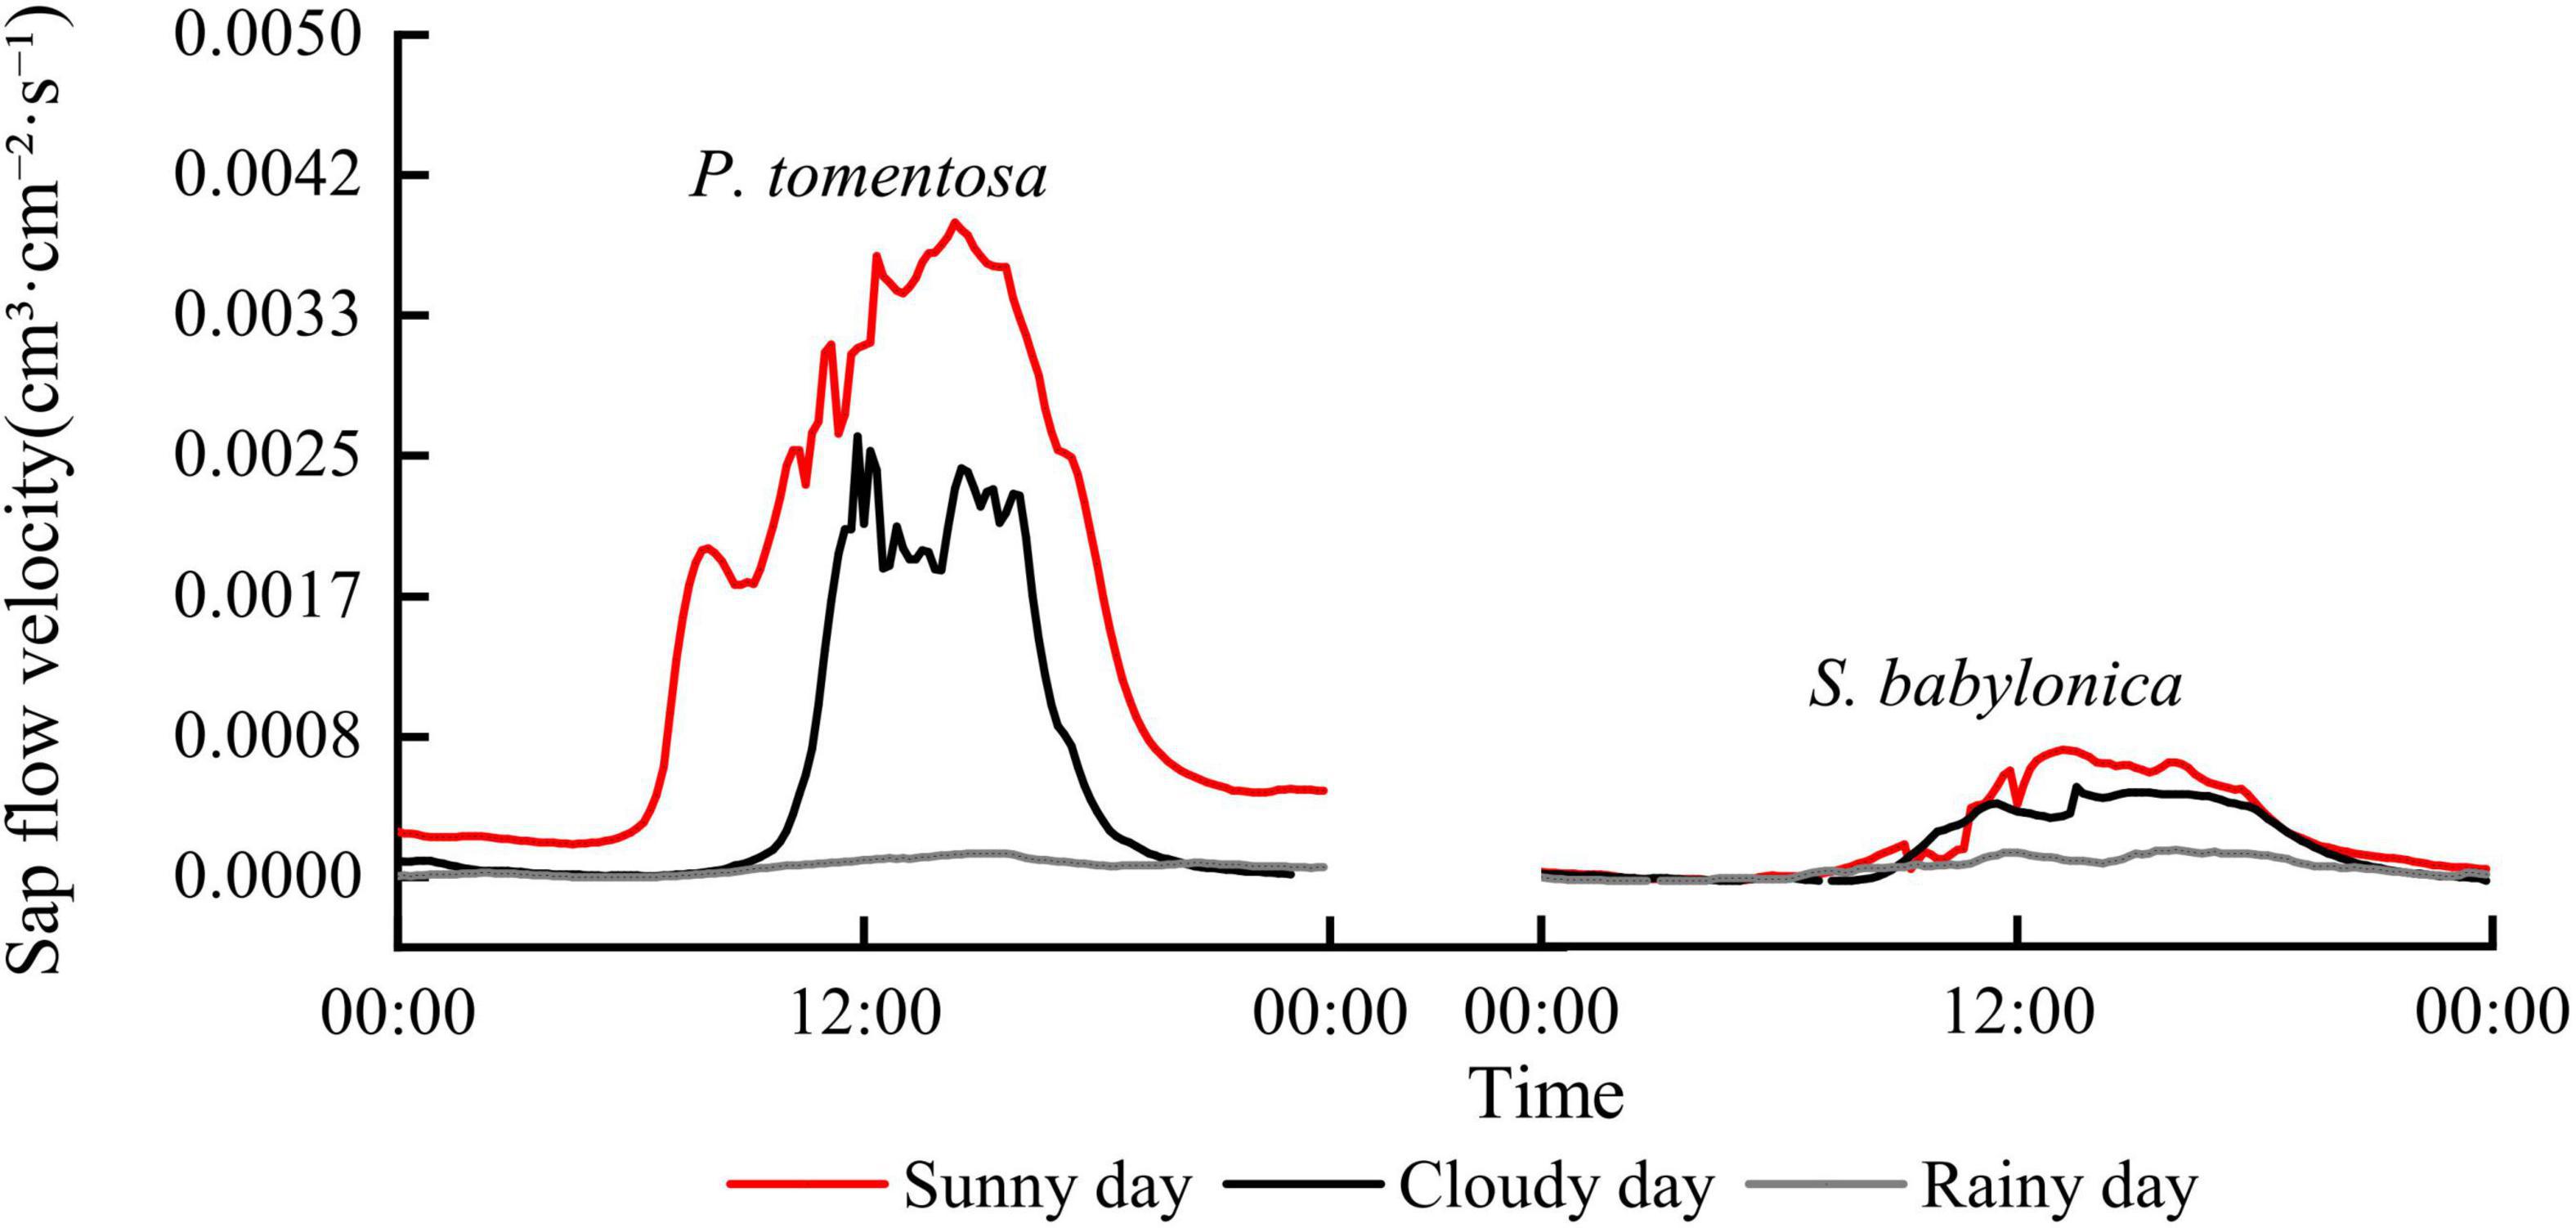
Figure 2. The changes of sap flow velocity of P. tomentosa and S. babylonica under different weather conditions.
Response of sap flow velocity to meteorological factors
The correlations between the sap flow velocity of P. tomentosa and S. babylonica and meteorological factors were analyzed on sunny, cloudy and rainy days (Table 2), and the results showed that the sap flow velocity of P. tomentosa was highly significantly and positively correlated with TA, RA, and VPD, highly and negatively correlated with RH on sunny, cloudy and rainy days, the overall correlation between sap flow velocity and meteorological factors was weak on rainy days. The sap flow velocity of S. babylonica was highly significantly and positively correlated with TA, RA, WS, and VPD, highly significantly and negatively correlated with RH on sunny and cloudy days, and it was also weakly correlated with each meteorological factor on rainy days.
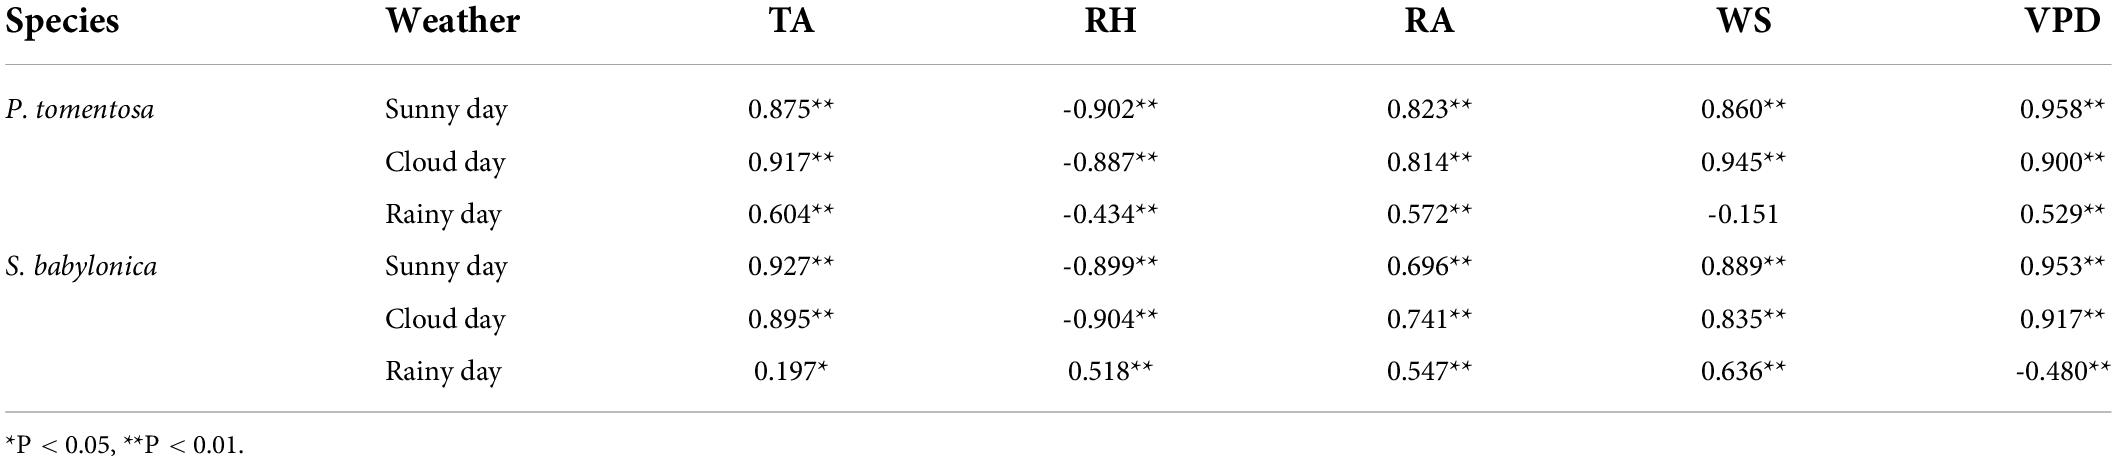
Table 2. Correlations between sap flow velocity of P. tomentosa and S. babylonica and meteorological factors.
To further clarify the main meteorological factors affecting P. tomentosa and S. babylonica under different weather conditions, stepwise regression analysis was used to establish regression models with TA, RH, RA, WS, and VPD, and the factors entering the models were the main influencing factors. The regression equations of sap flow velocity and meteorological factors on sunny, cloudy and rainy days were as follows:
P. tomentosa (sunny days) = 1.137VPD+0.001RA+ 0.015RH - 1.916 R2 = 0.926
P. tomentosa (cloudy days) = 0.014WS+0.037TA+0.001RA - 0.009RH+0.13 R2 = 0.967
P. tomentosa (rainy days) = 0.031TA+0.743VPD-0.001WS - 0.379 R2 = 0.580
S. babylonica (sunny days) = 0.497VPD+0.013RH- 0.025TA - 0.746 R2 = 0.954
S. babylonica (cloudy days) = 0.140VPD - 0.092 R2 = 0.899
S. babylonica (rainy days) = 0.001WS+0.062RH+0.040TA - 0.001RA+2.049VPD - 6.864 R2 = 0.863
From the above Equations, it can be seen that the main influencing factors of sap flow velocity of P. tomentosa on sunny days were VPD, RA, and RH; on cloudy days they were WS, TA, RA, and RH; on rainy days they were TA, VPD, and WS; the main influencing factors of sap flow velocity of S. babylonica on sunny days were VPD, RH, and TA; on cloudy days they were VPD; and on rainy days they were WS, RH, TA, RA, and VPD.
Relationship between sap flow velocity and diameter at breast height
As seen in Figure 3, the sap flow velocity and DBH changes of both P. tomentosa and S. babylonica showed opposite trends at the daily scale. During the daytime, with increasing temperature and solar radiation, transpiration of the trees was enhanced, and the sap flow velocity was accelerated. The water stored in the trunk during the previous night might be utilized preferentially, so the water in the trunk was reduced continuously, leading to the shrinking of the stem, and the sap flow velocity increased continuously at this stage. Later, as the temperature and solar radiation decreased, transpiration also decreased gradually, the sap flow velocity began to show a decreasing trend, the stem began to expand slowly until the temperature and solar radiation increased, the sap flow velocity increased, and the stem contracted again.
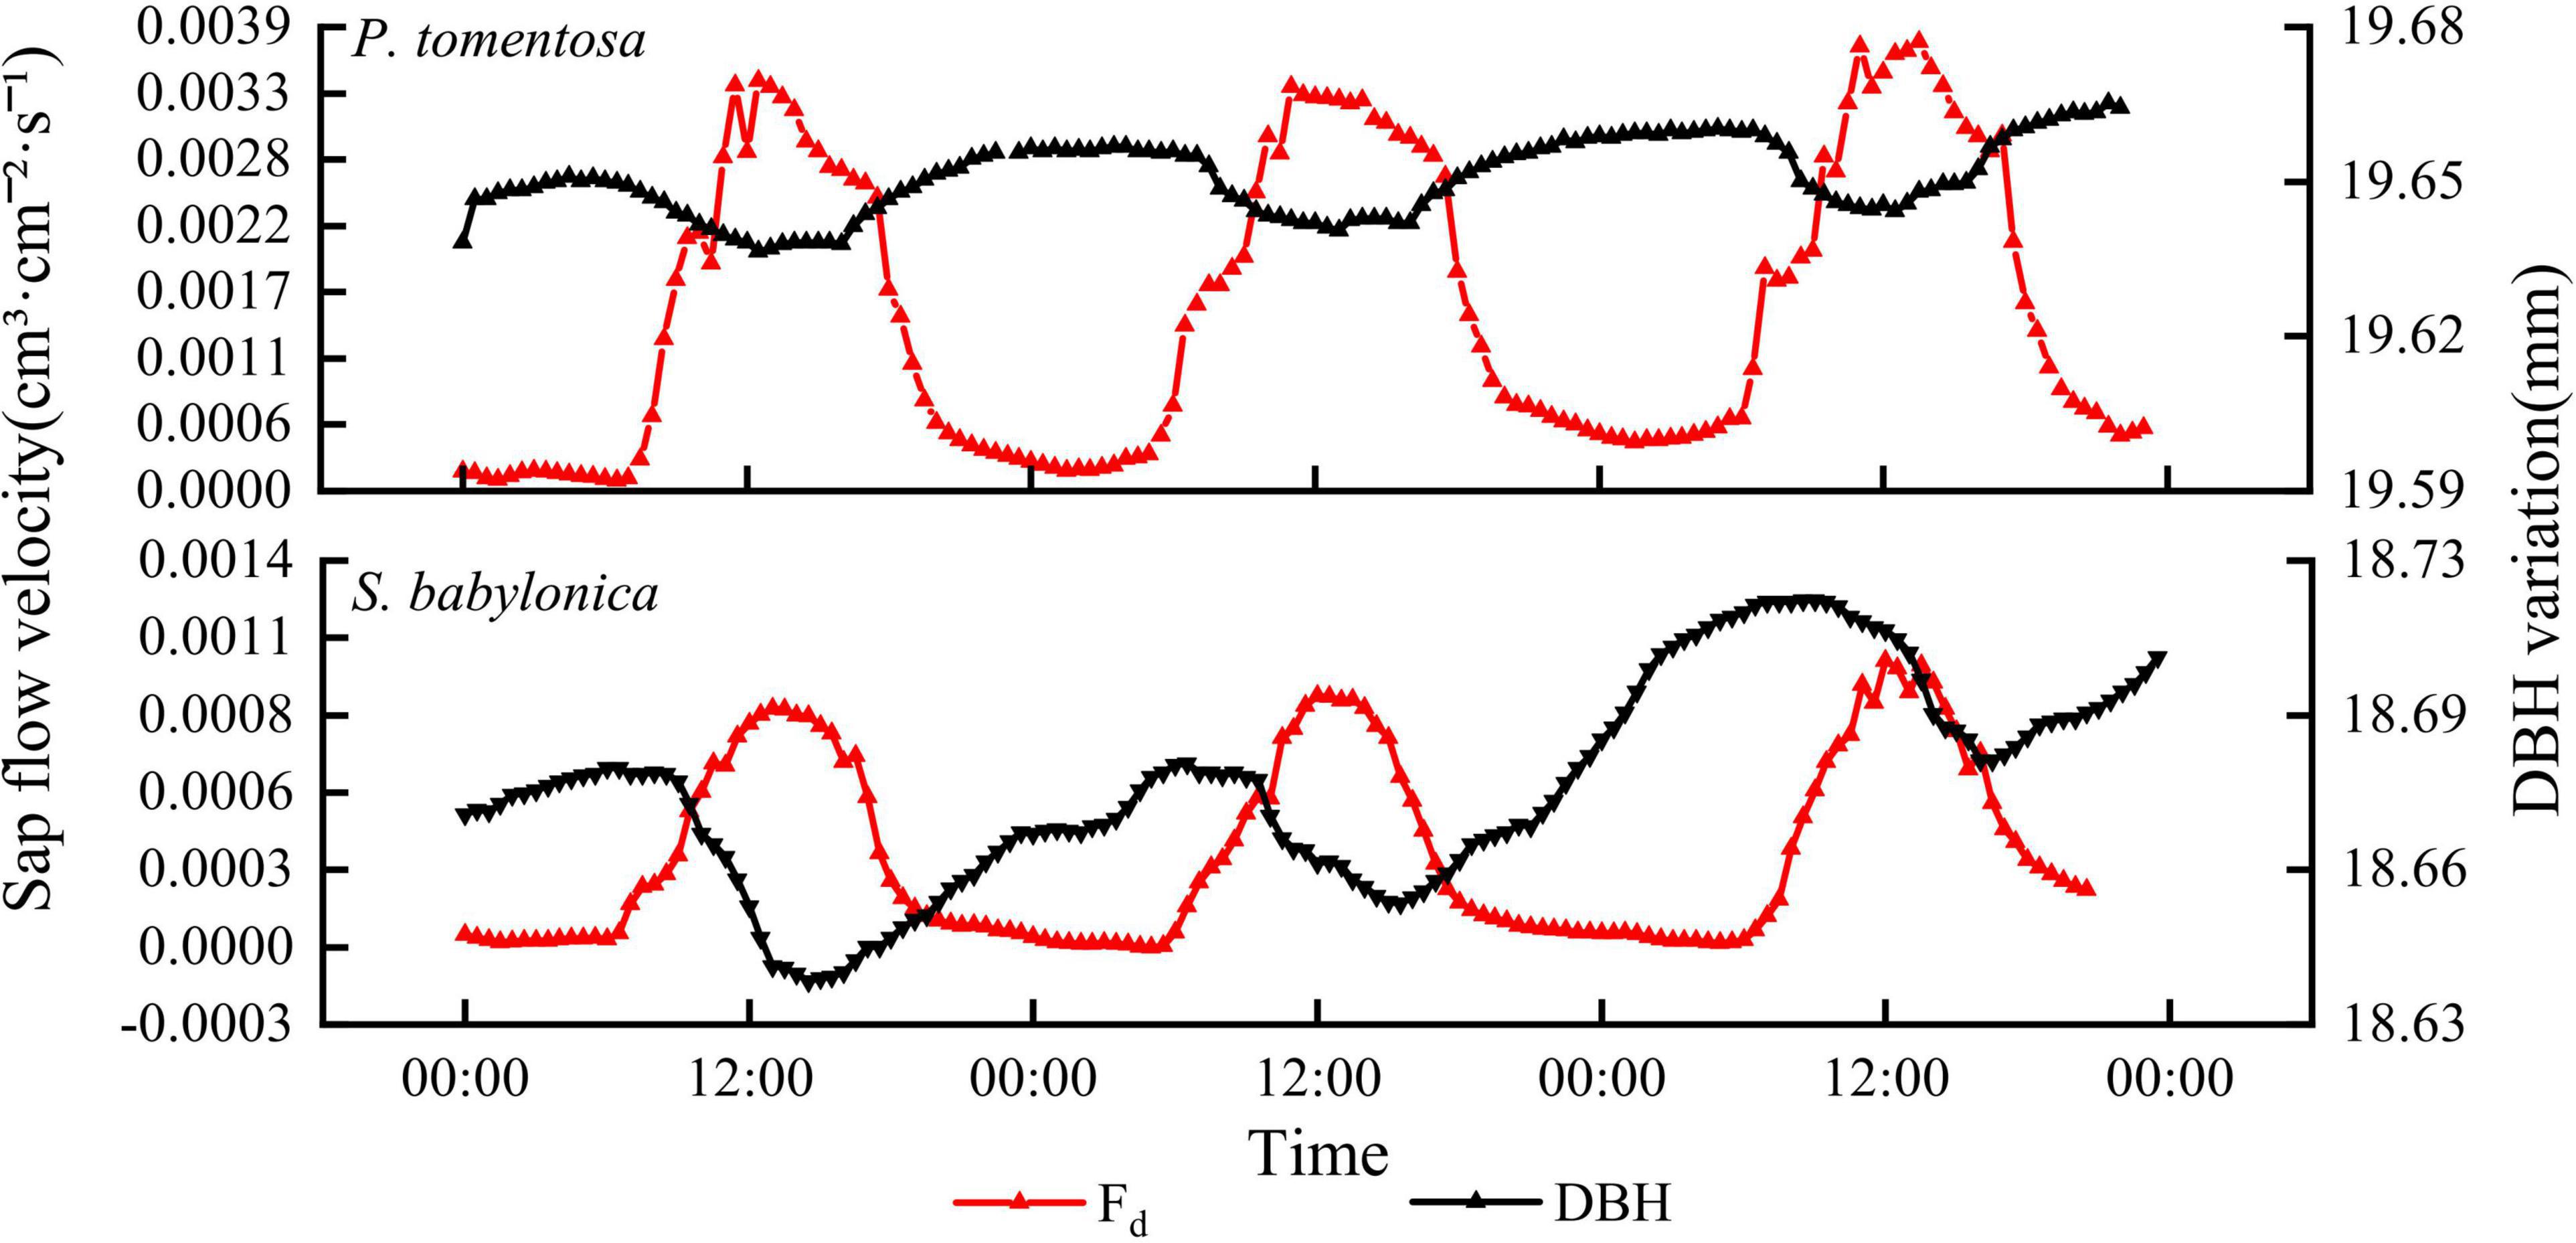
Figure 3. The changes of sap flow velocity and DBH of P. tomentosa and S. babylonica.
As seen in Table 3, the DBH microvariation and TA, RH, RA, and VPD of P. tomentosa and S. babylonica were all highly significantly correlated. Both were highly significantly negatively correlated with TA, WS, and VPD and highly significantly positively correlated with RH.
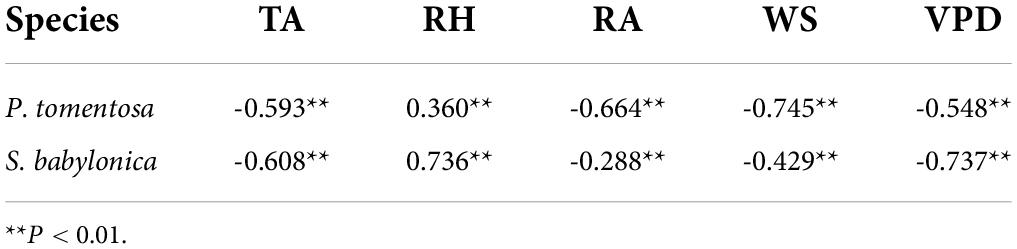
Table 3. Correlation coefficients between DBH microvariation and meteorological factors of P. tomentosa and S. babylonica.
Response of sap flow velocity to soil water transport
A container full of soil without trees planted was used as a blank control, and the marsupial bottles continuously supplied water to the P. tomentosa and S. babylonica planted in the containers and the blank control. It can be seen from Figure 4 that the higher the depth of the blank experimental soil layer is, the greater the soil water content, and the soil water content at different depths showed an increasing trend, and the greater the depth of the soil layer is, the more obvious the trend of soil water content change. As soil capillary water was transported upward under the action of matrix potential and gravitational potential, its rising rate gradually decreased with time under continuous water supply. For P. tomentosa and S. babylonica, the lower the depth of the soil layer is, the lower the soil water content. Water was transported from bottom to top, and its soil water content was lower as it was closer to the surface soil. The trend of soil water content changes at three different depths was not the same, which might be caused by the large absorption of surrounding soil water by the roots. The soil water content was highest at depths of 20–30 cm, and the trend of change was not obvious, indicating that there might be a small amount of roots distributed in this layer, while the trend of soil water content at depths of 10–20 cm was obvious and similar to the trend of sap flow velocity, which indicated that the roots of P. tomentosa and S. babylonica may be mainly distributed in this soil layer. The upward trend of the change of soil water content at 0–10 cm depth may be due to sufficient water to make the soil water continuously transported upward, even though the phenomenon of water absorption by the roots existed at this soil layer, but in general it did not affect the continuous rise, and in the process of rising and constantly approaching the soil water content at 10–20 cm, it could finally reach a relative equilibrium state.
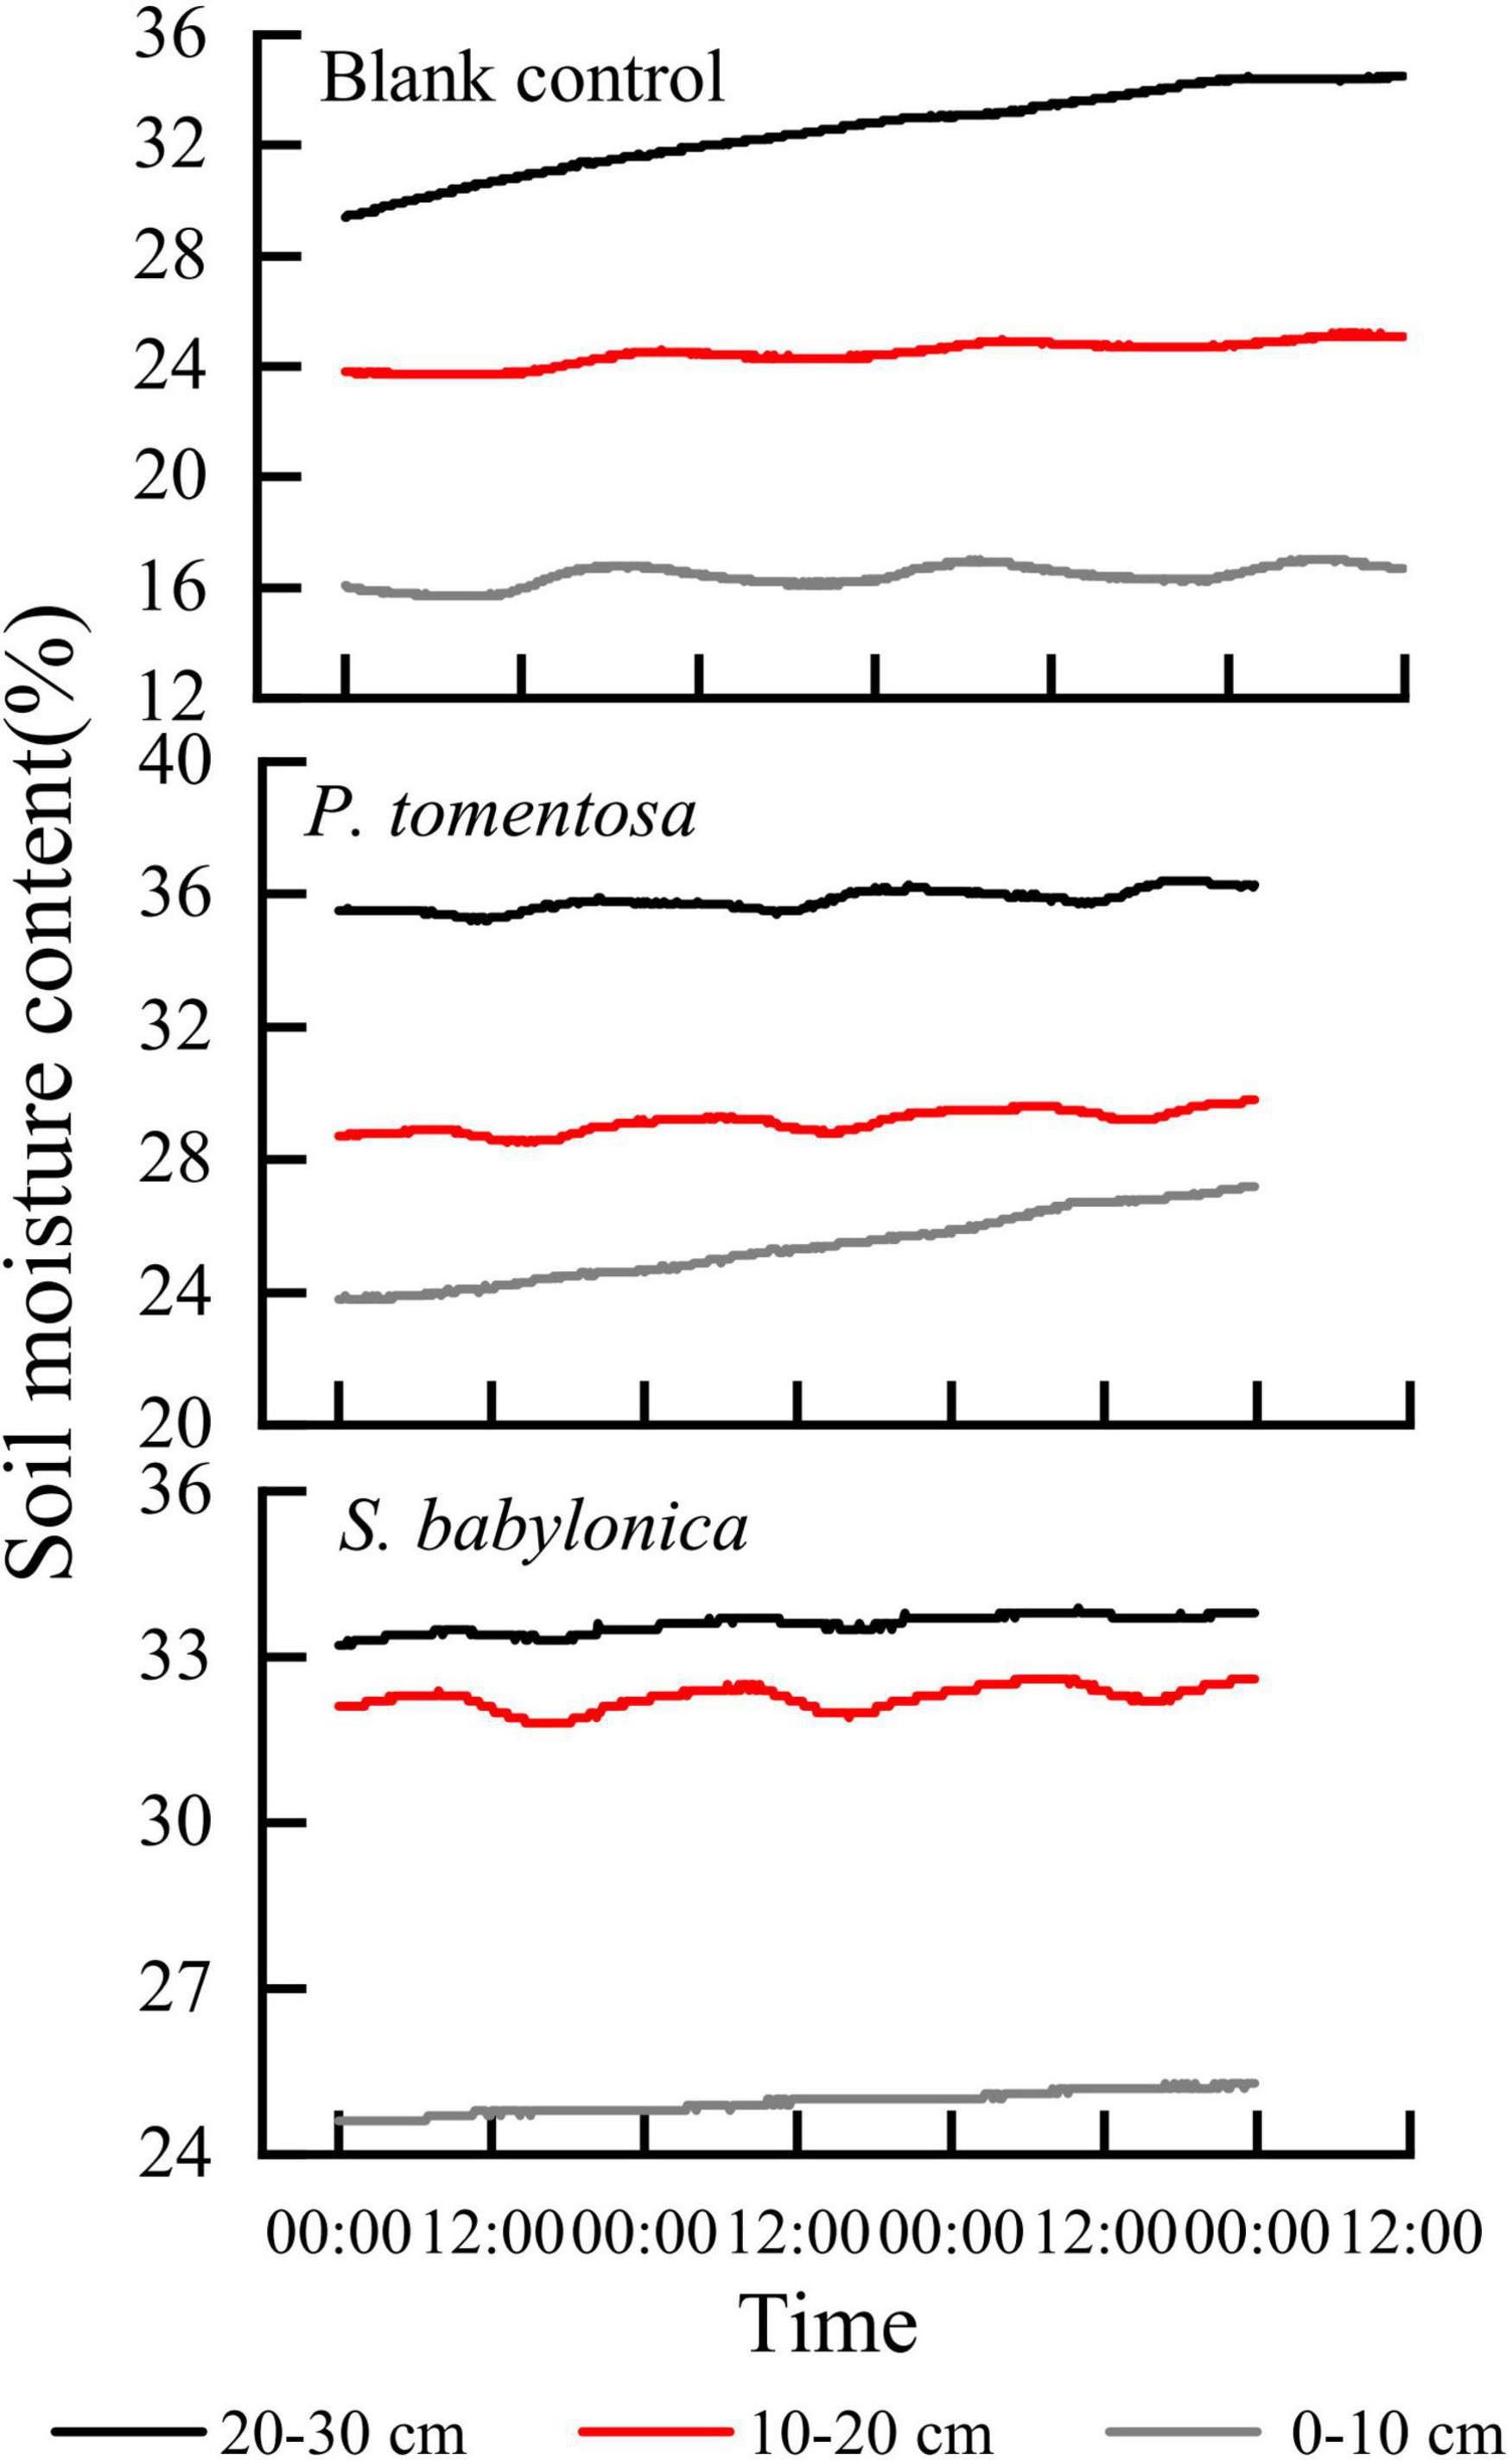
Figure 4. The changes of soil water content in blank control, P. tomentosa and S. babylonica at different soil depths.
The correlations between the sap flow velocity and soil water content at different depths were determined for P. tomentosa and S. babylonica, and the results showed that the sap flow velocity of both species was highly significantly negatively correlated with the soil water content at 10–20 cm (P < 0.01). Figure 5 shows that the sap flow velocity of P. tomentosa and S. babylonica showed an opposite trend with the soil water content at 10–20 cm. As the roots of trees may be widely distributed at this depth, with the increase in transpiration, the trees gradually absorb a large amount of water, and when the root absorption rate is greater than the water transport rate, the soil water content begins to decline; when the transpiration rate gradually decreases, the root absorption is smaller than the soil water transport rate, and then the soil water content gradually increases.
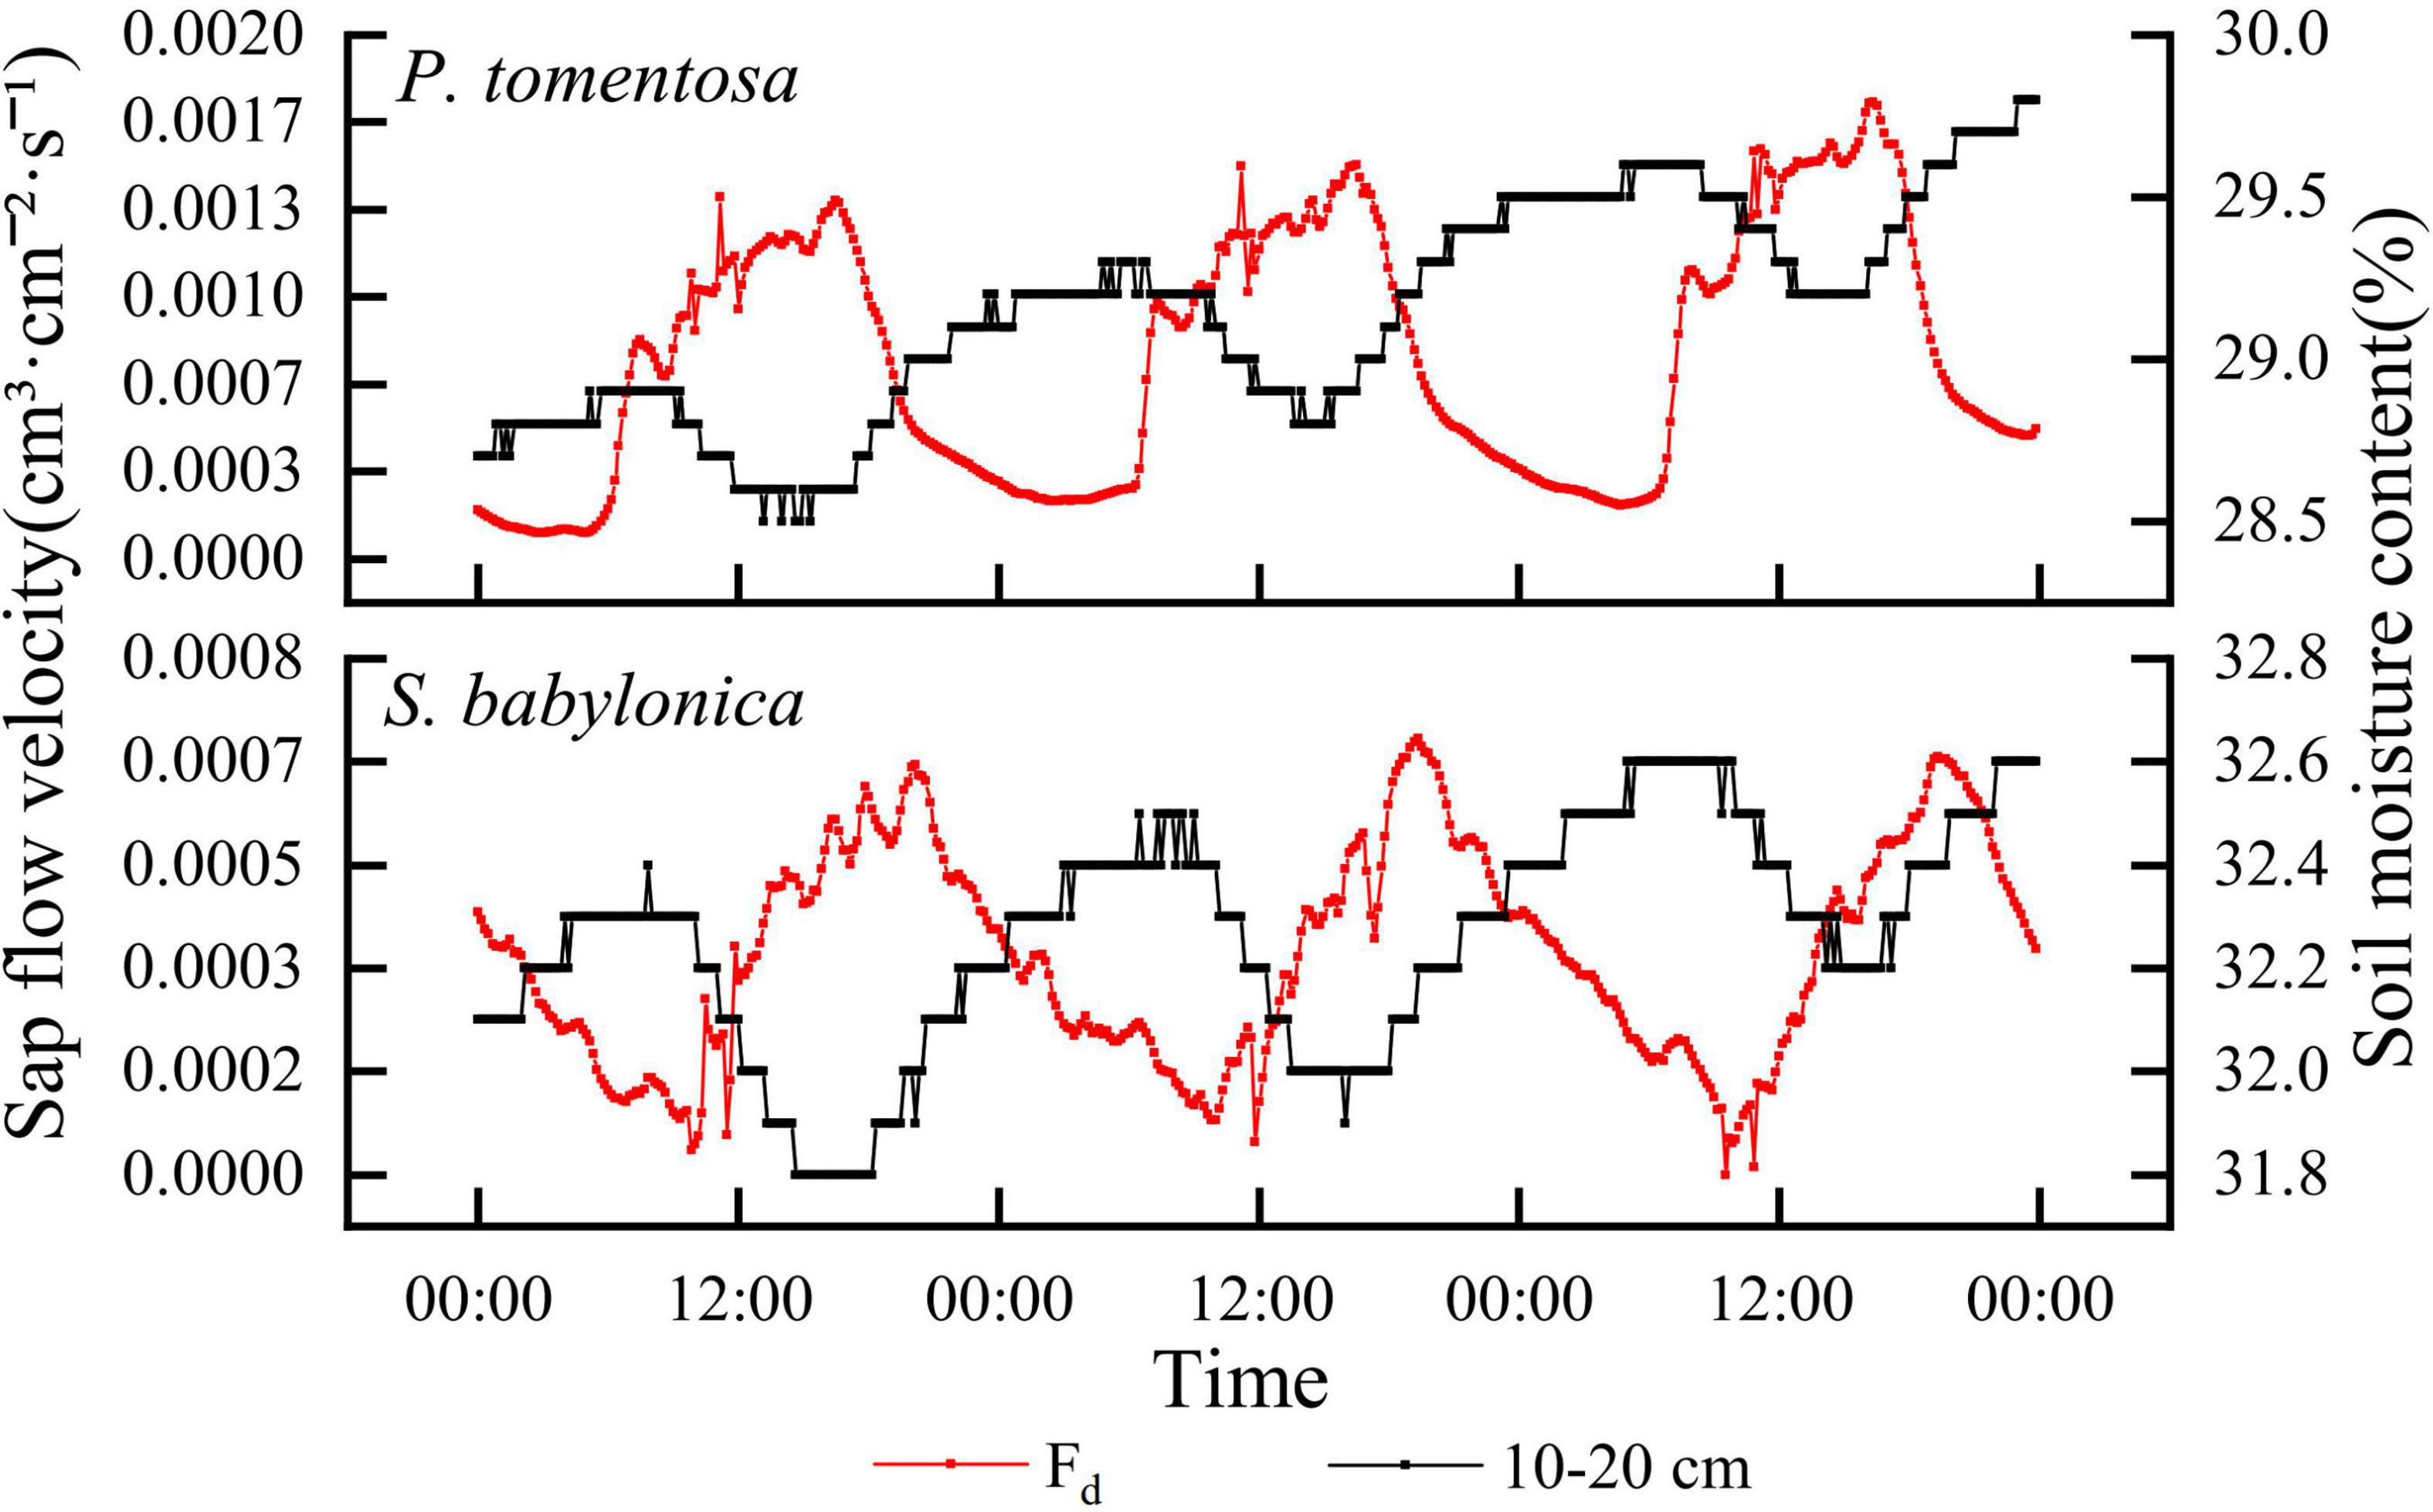
Figure 5. The changes of sap flow velocity and soil water content of P. tomentosa and S. babylonica.
Validation and correction of the original Granier’s formula
Validation of the original Granier’s formula
TDP was used to measure the sap flow, and LLE was used to simultaneously measure transpiration. The sap flow measured by TDP of the two species was positively correlated with the transpiration measured by LLE (P < 0.01), showing a consistent pattern of variation, but the transpiration was significantly greater than the sap flow (Figure 6), indicating that the TDP-measured sap flow underestimated the true values.
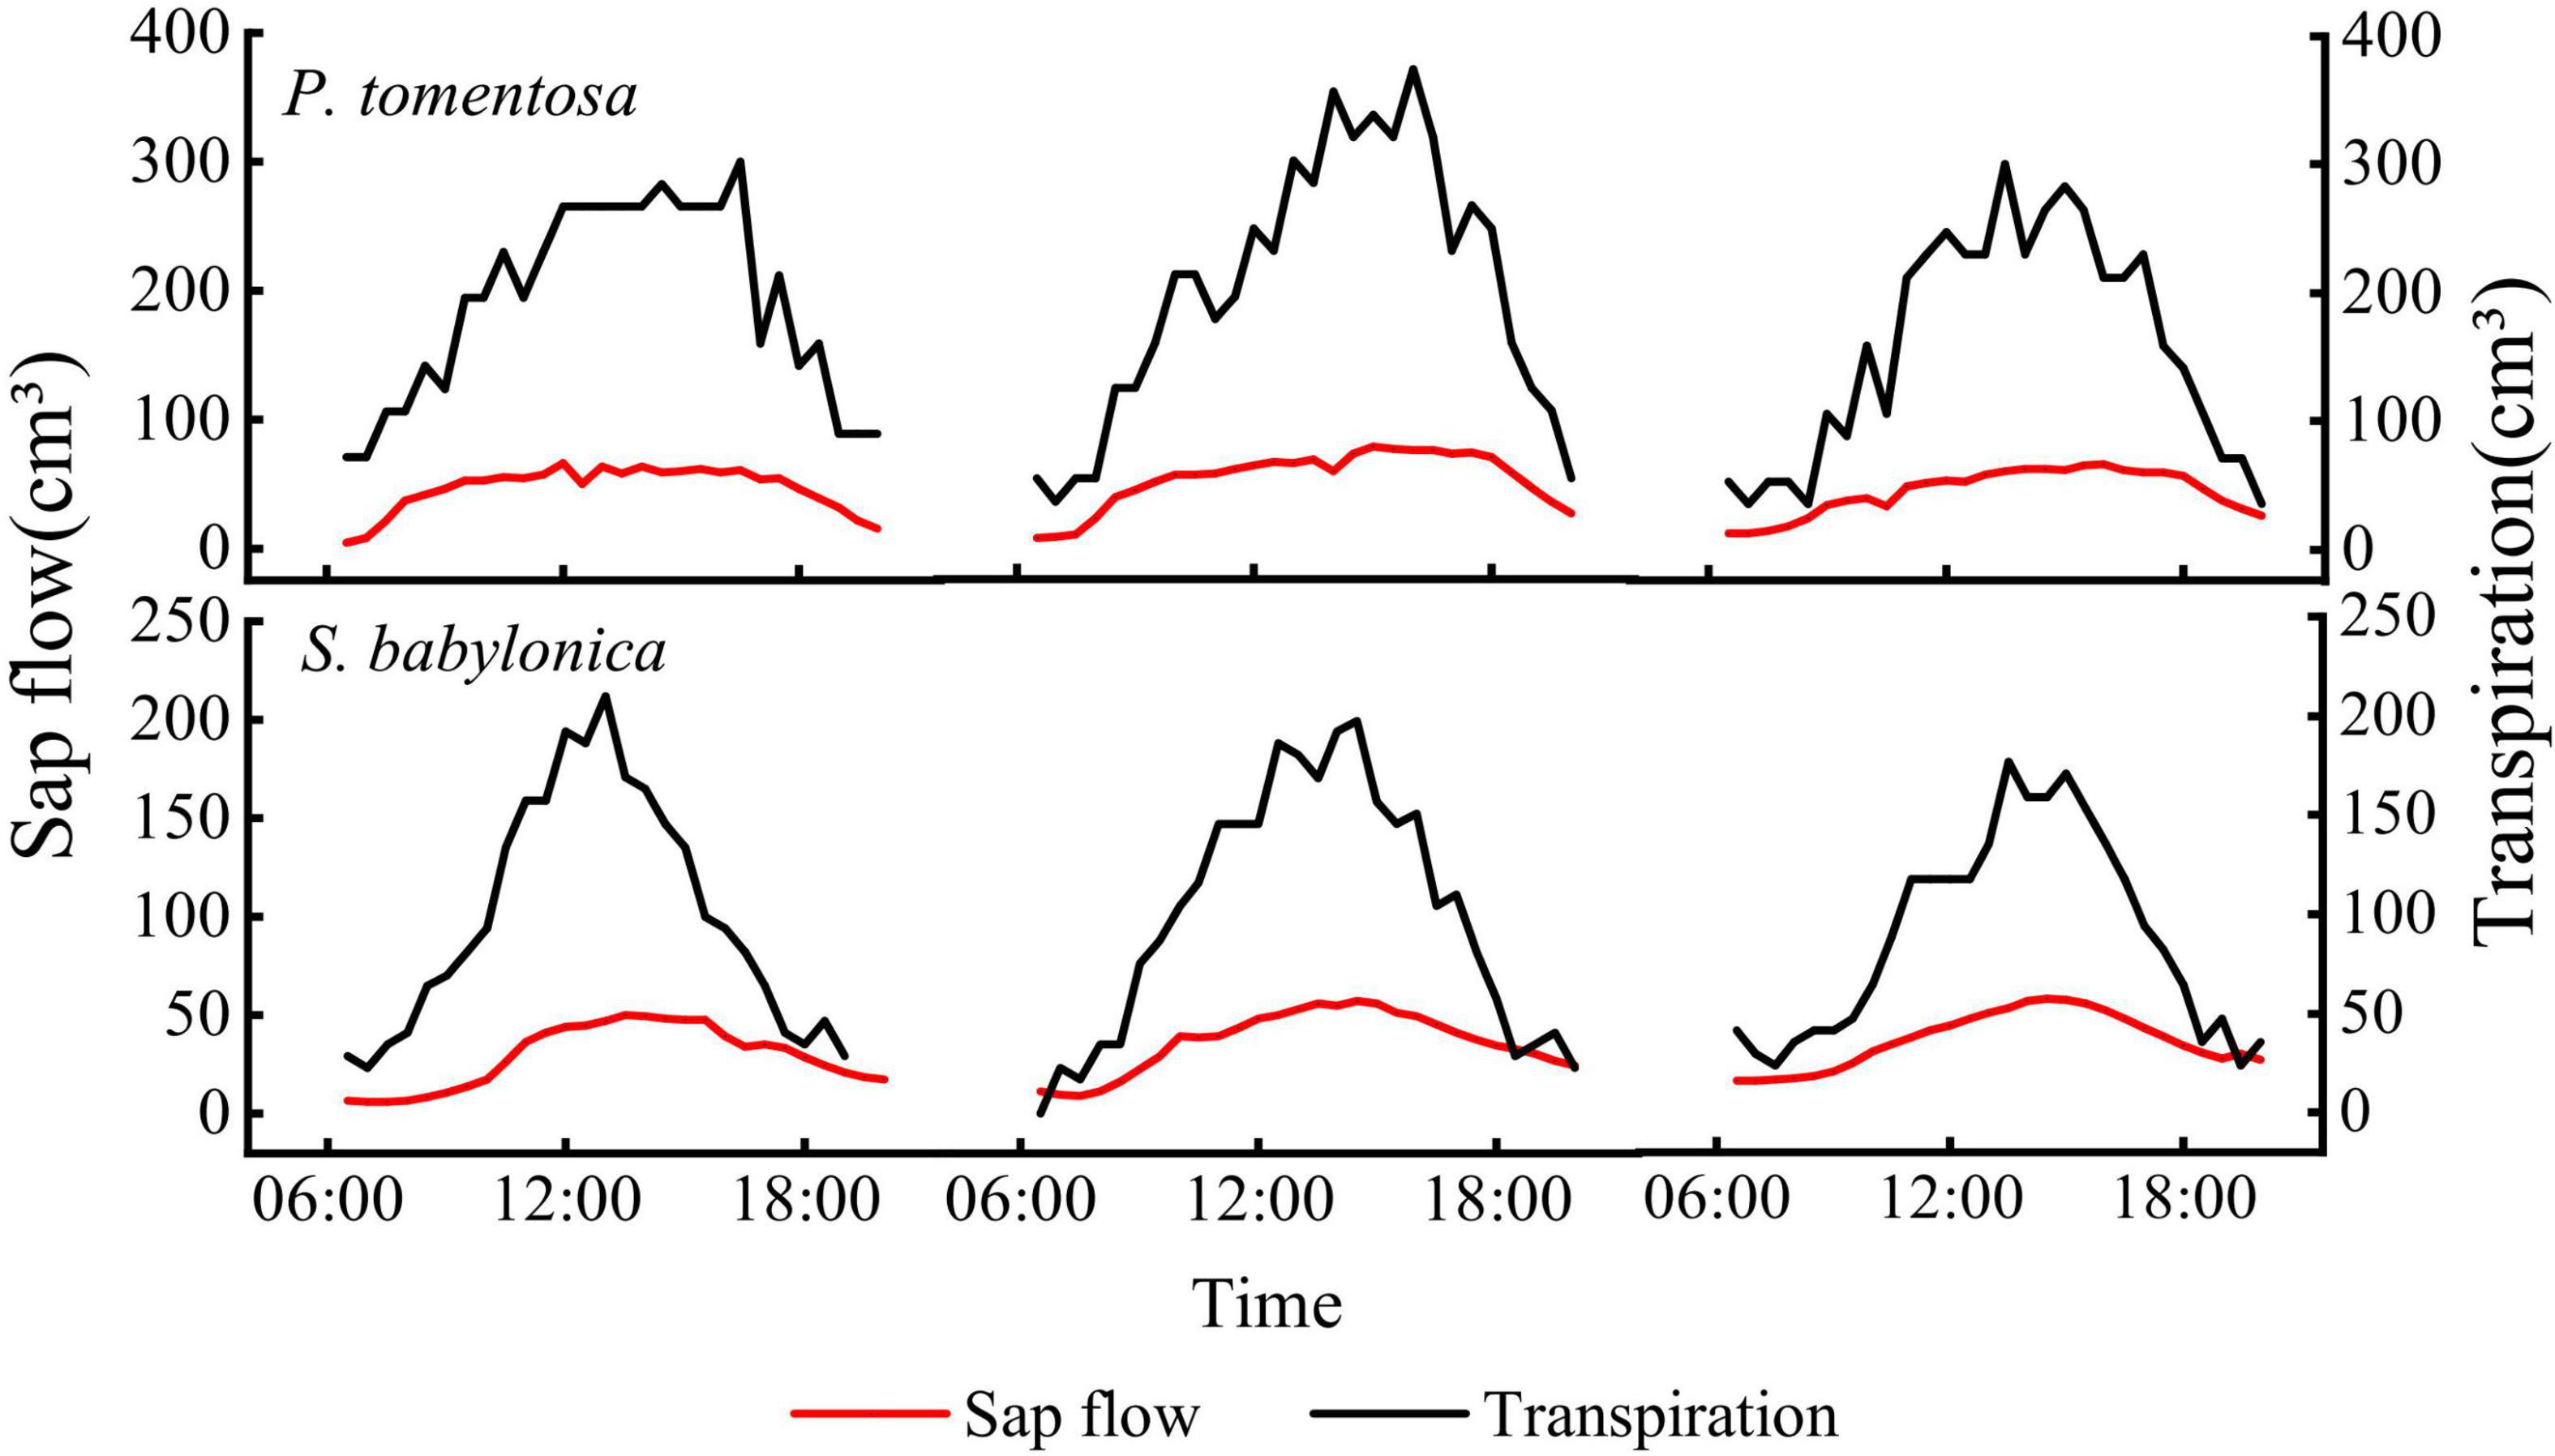
Figure 6. Daily changes of transpiration and sap flow of P. tomentosa and S. babylonica.
The transpiration and sap flow of the two species were linearly fitted separately (Figure 7). The sap flow of P. tomentosa and S. babylonica were both smaller than the transpiration, with error values of -60.96% and -63.37%, respectively. Therefore, it is necessary to correct the original Granier’s formulas.
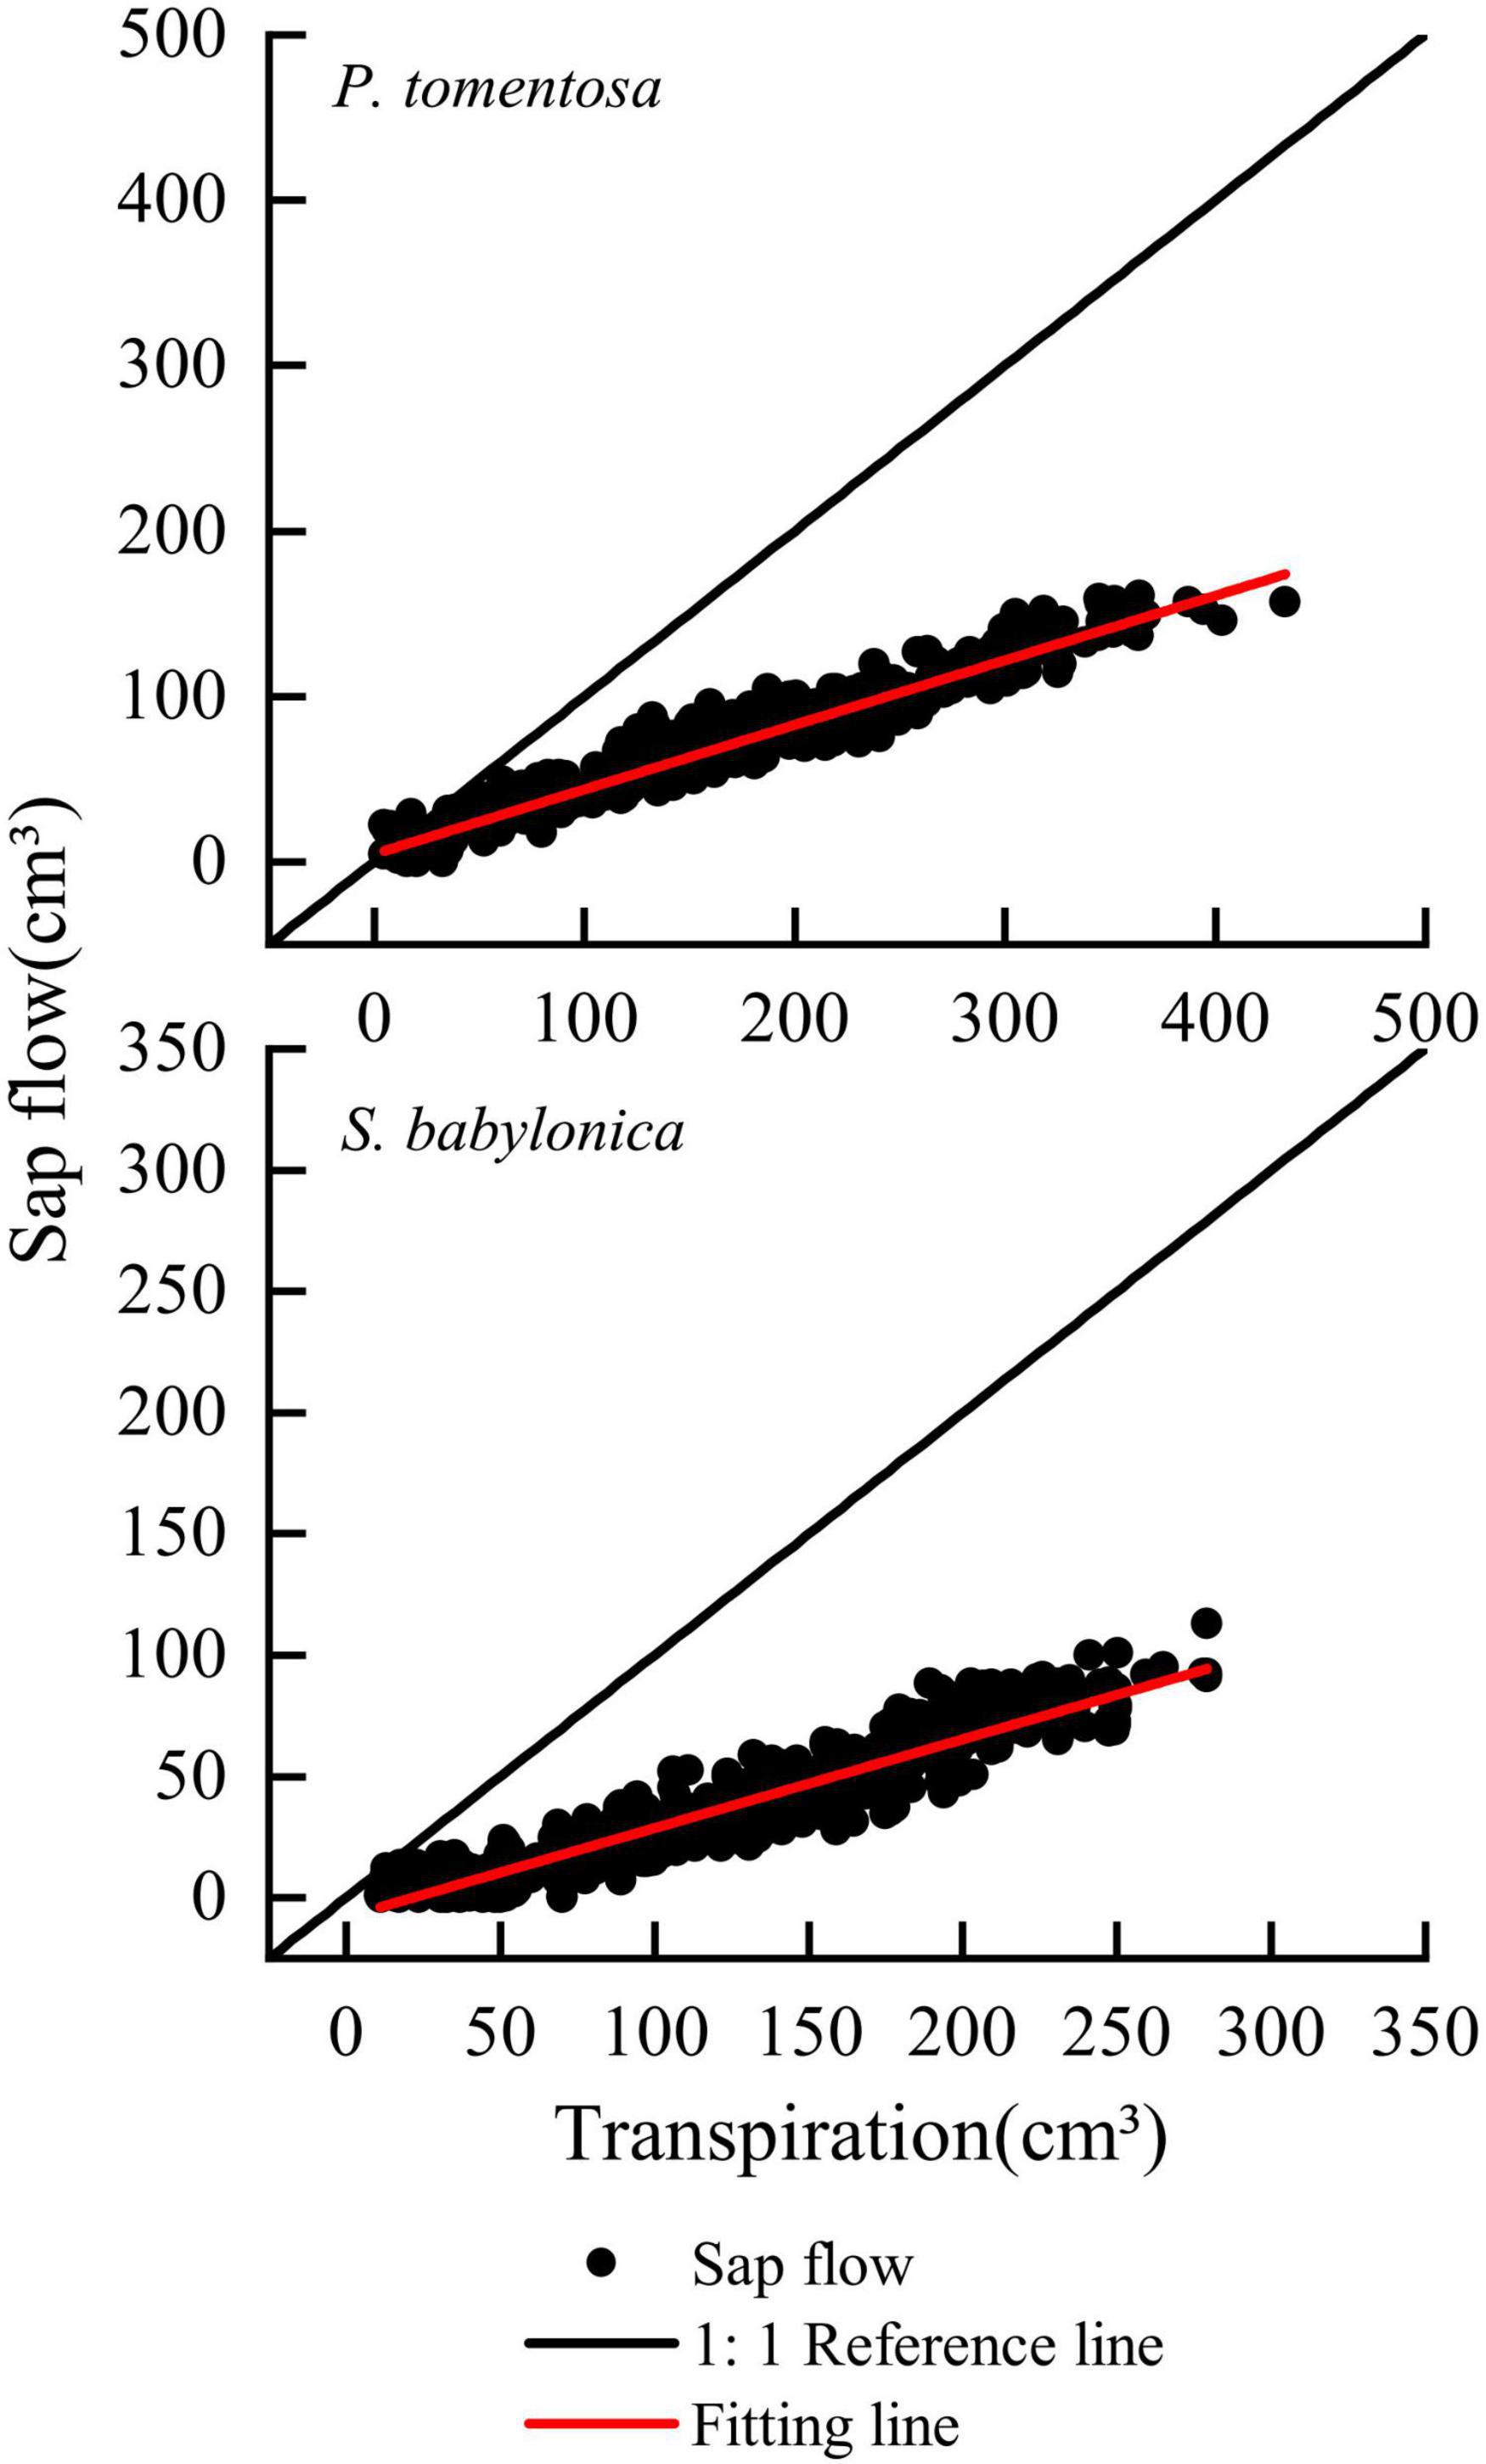
Figure 7. Validation of the original Granier’s formulas of P. tomentosa and S. babylonica.
Correction of the original Granier’s formula
The correction equations were obtained by fitting a power function with the TDP-measured K as the horizontal coordinate and the LLE-measured transpiration rate as the vertical coordinate. The specific correction equations for P. tomentosa and S. babylonica were Fd = 0.0287K1.236 (R2 = 0.941) and Fd = 0.0145K0.852 (R2 = 0.904), respectively. Compared with Granier’s original formula Fd = 0.0119K1.231, the coefficient α of the correction formula for P. tomentosa (0.0287) is larger than that of Granier (0.0119), and the correction coefficient β (1.236) is similar to that of Granier (1.231); the coefficient α (0.0145) of the correction formula for S. babylonica is larger than that of Granier (0.0119), and the correction coefficient β (0.852) is smaller than that of Granier (1.231). The K values and transpiration rates of P. tomentosa and S. babylonica were integrated to establish the combined correction equation: Fd = 0.0235K1.080 (R2 = 0.957). Compared with Granier’s original formula Fd = 0.0119K1.231, the coefficients α (0.0235) and β (1.080) of the combined correction formula were both different from the coefficients of Granier’s original formula (Figure 8).
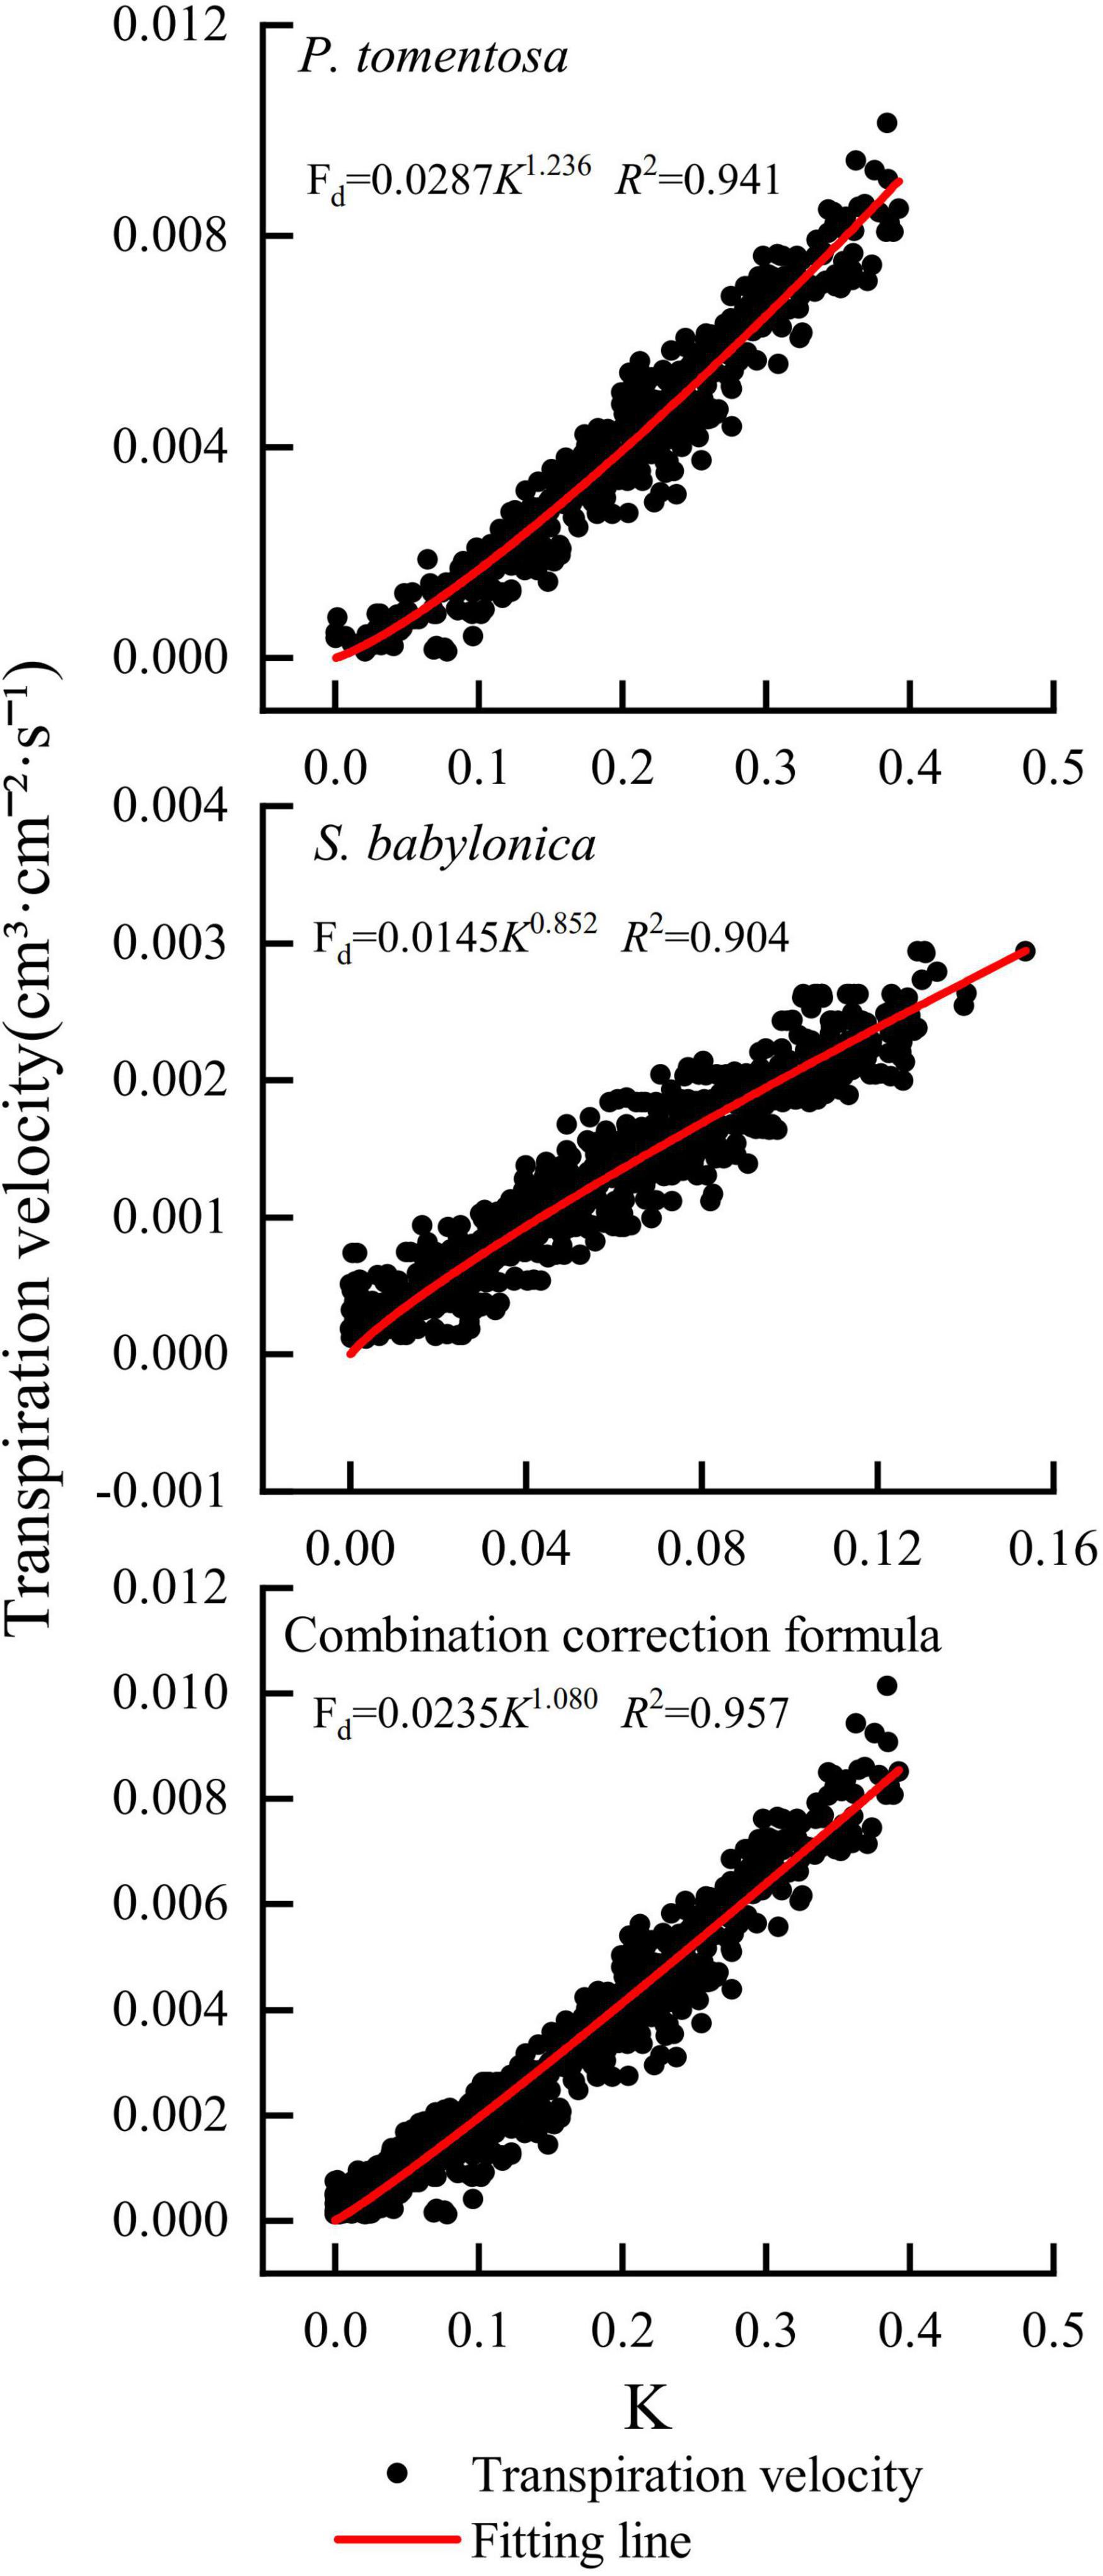
Figure 8. Correction formulas for P. tomentosa and S. babylonica.
Validation of Granier’s correction formulas
There were significant positive correlations between the sap flow measured by Granier’s original formula, specific correction formulas, combined correction formula, and transpiration measured by LLE of P. tomentosa and S. babylonica (p < 0.01); however, the sap flow calculated by Granier’s original formula was obviously lower than that calculated by the other three methods (Figure 9). Compared with Granier’s original formula, both the specific correction formulas and the combination correction formula were closer to the transpiration value measured by LLE.
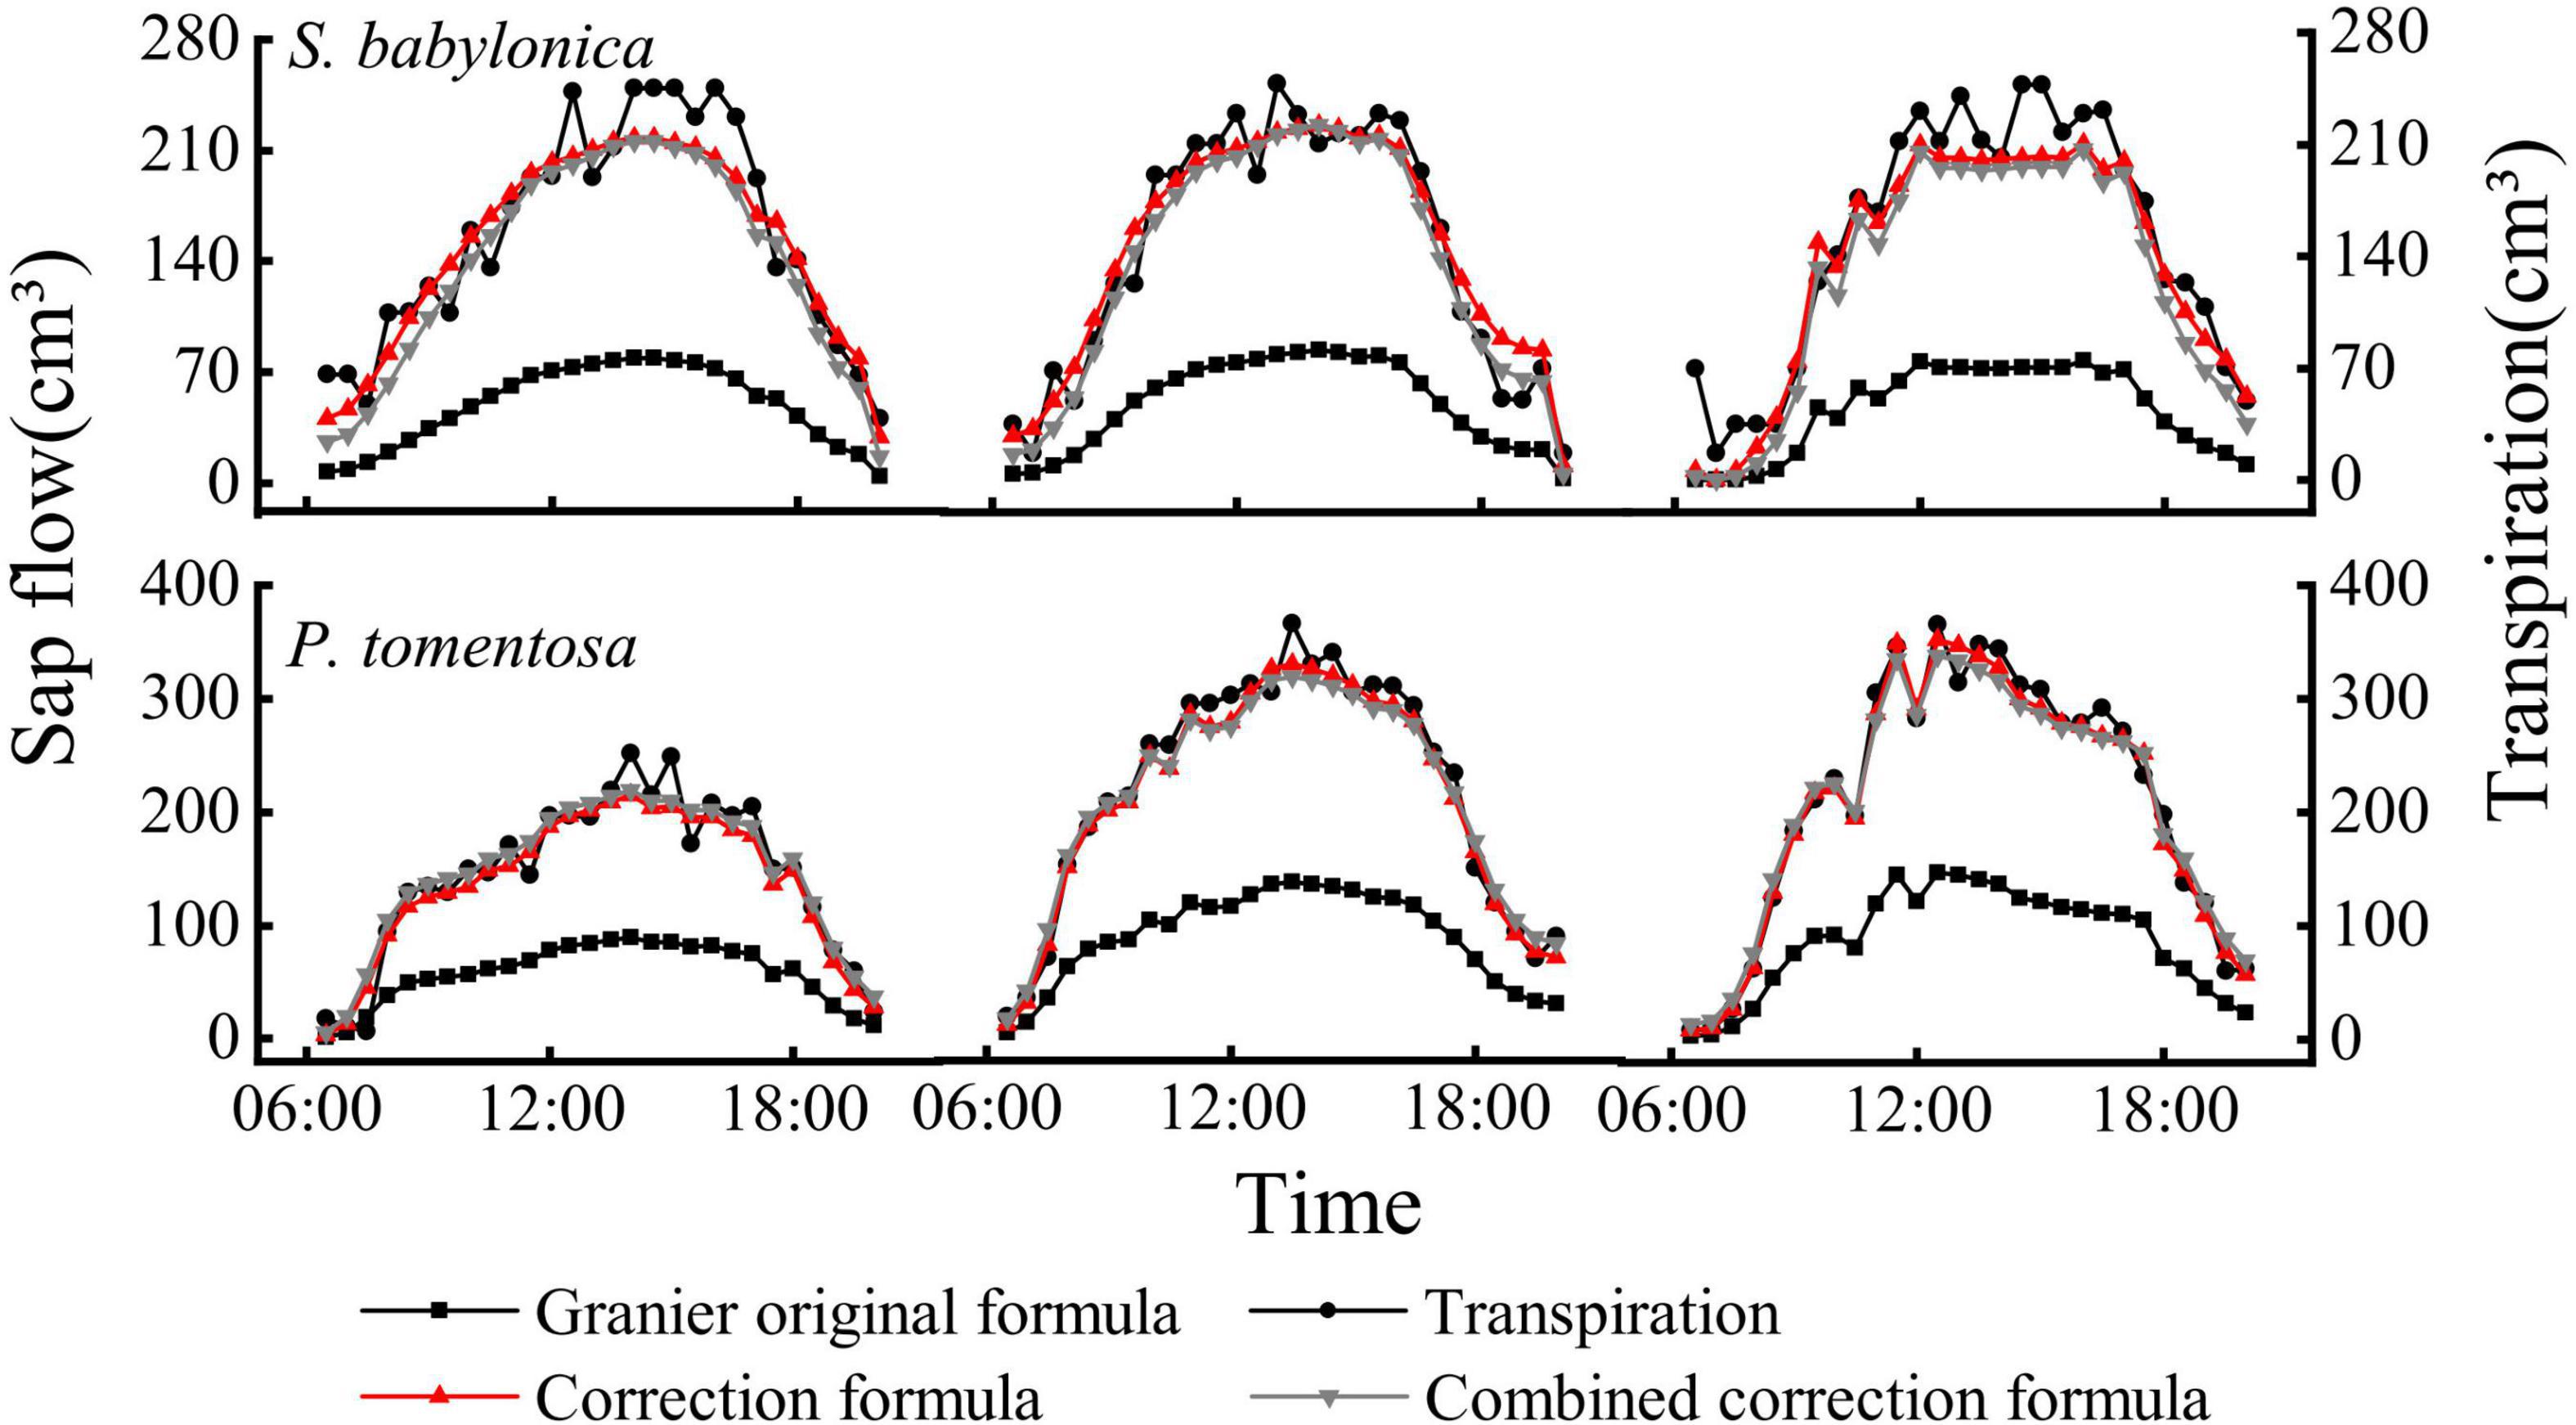
Figure 9. Daily variations of transpiration and sap flow of P. tomentosa and S. babylonica.
The sap flow calculated by Granier’s original formula and specific correction formula and the transpiration measured by LLE of P. tomentosa and S. babylonica were fitted linearly (Figure 10). The results showed that the sap flow calculated by the specific correction formulas was closer to the reference line of 1:1, while that calculated by Granier’s original formula was obviously lower. Compared with those of transpiration, the errors of sap flow calculated by the specific correction formulas were 6.18% and 5.86%, respectively, and the errors were obviously reduced.
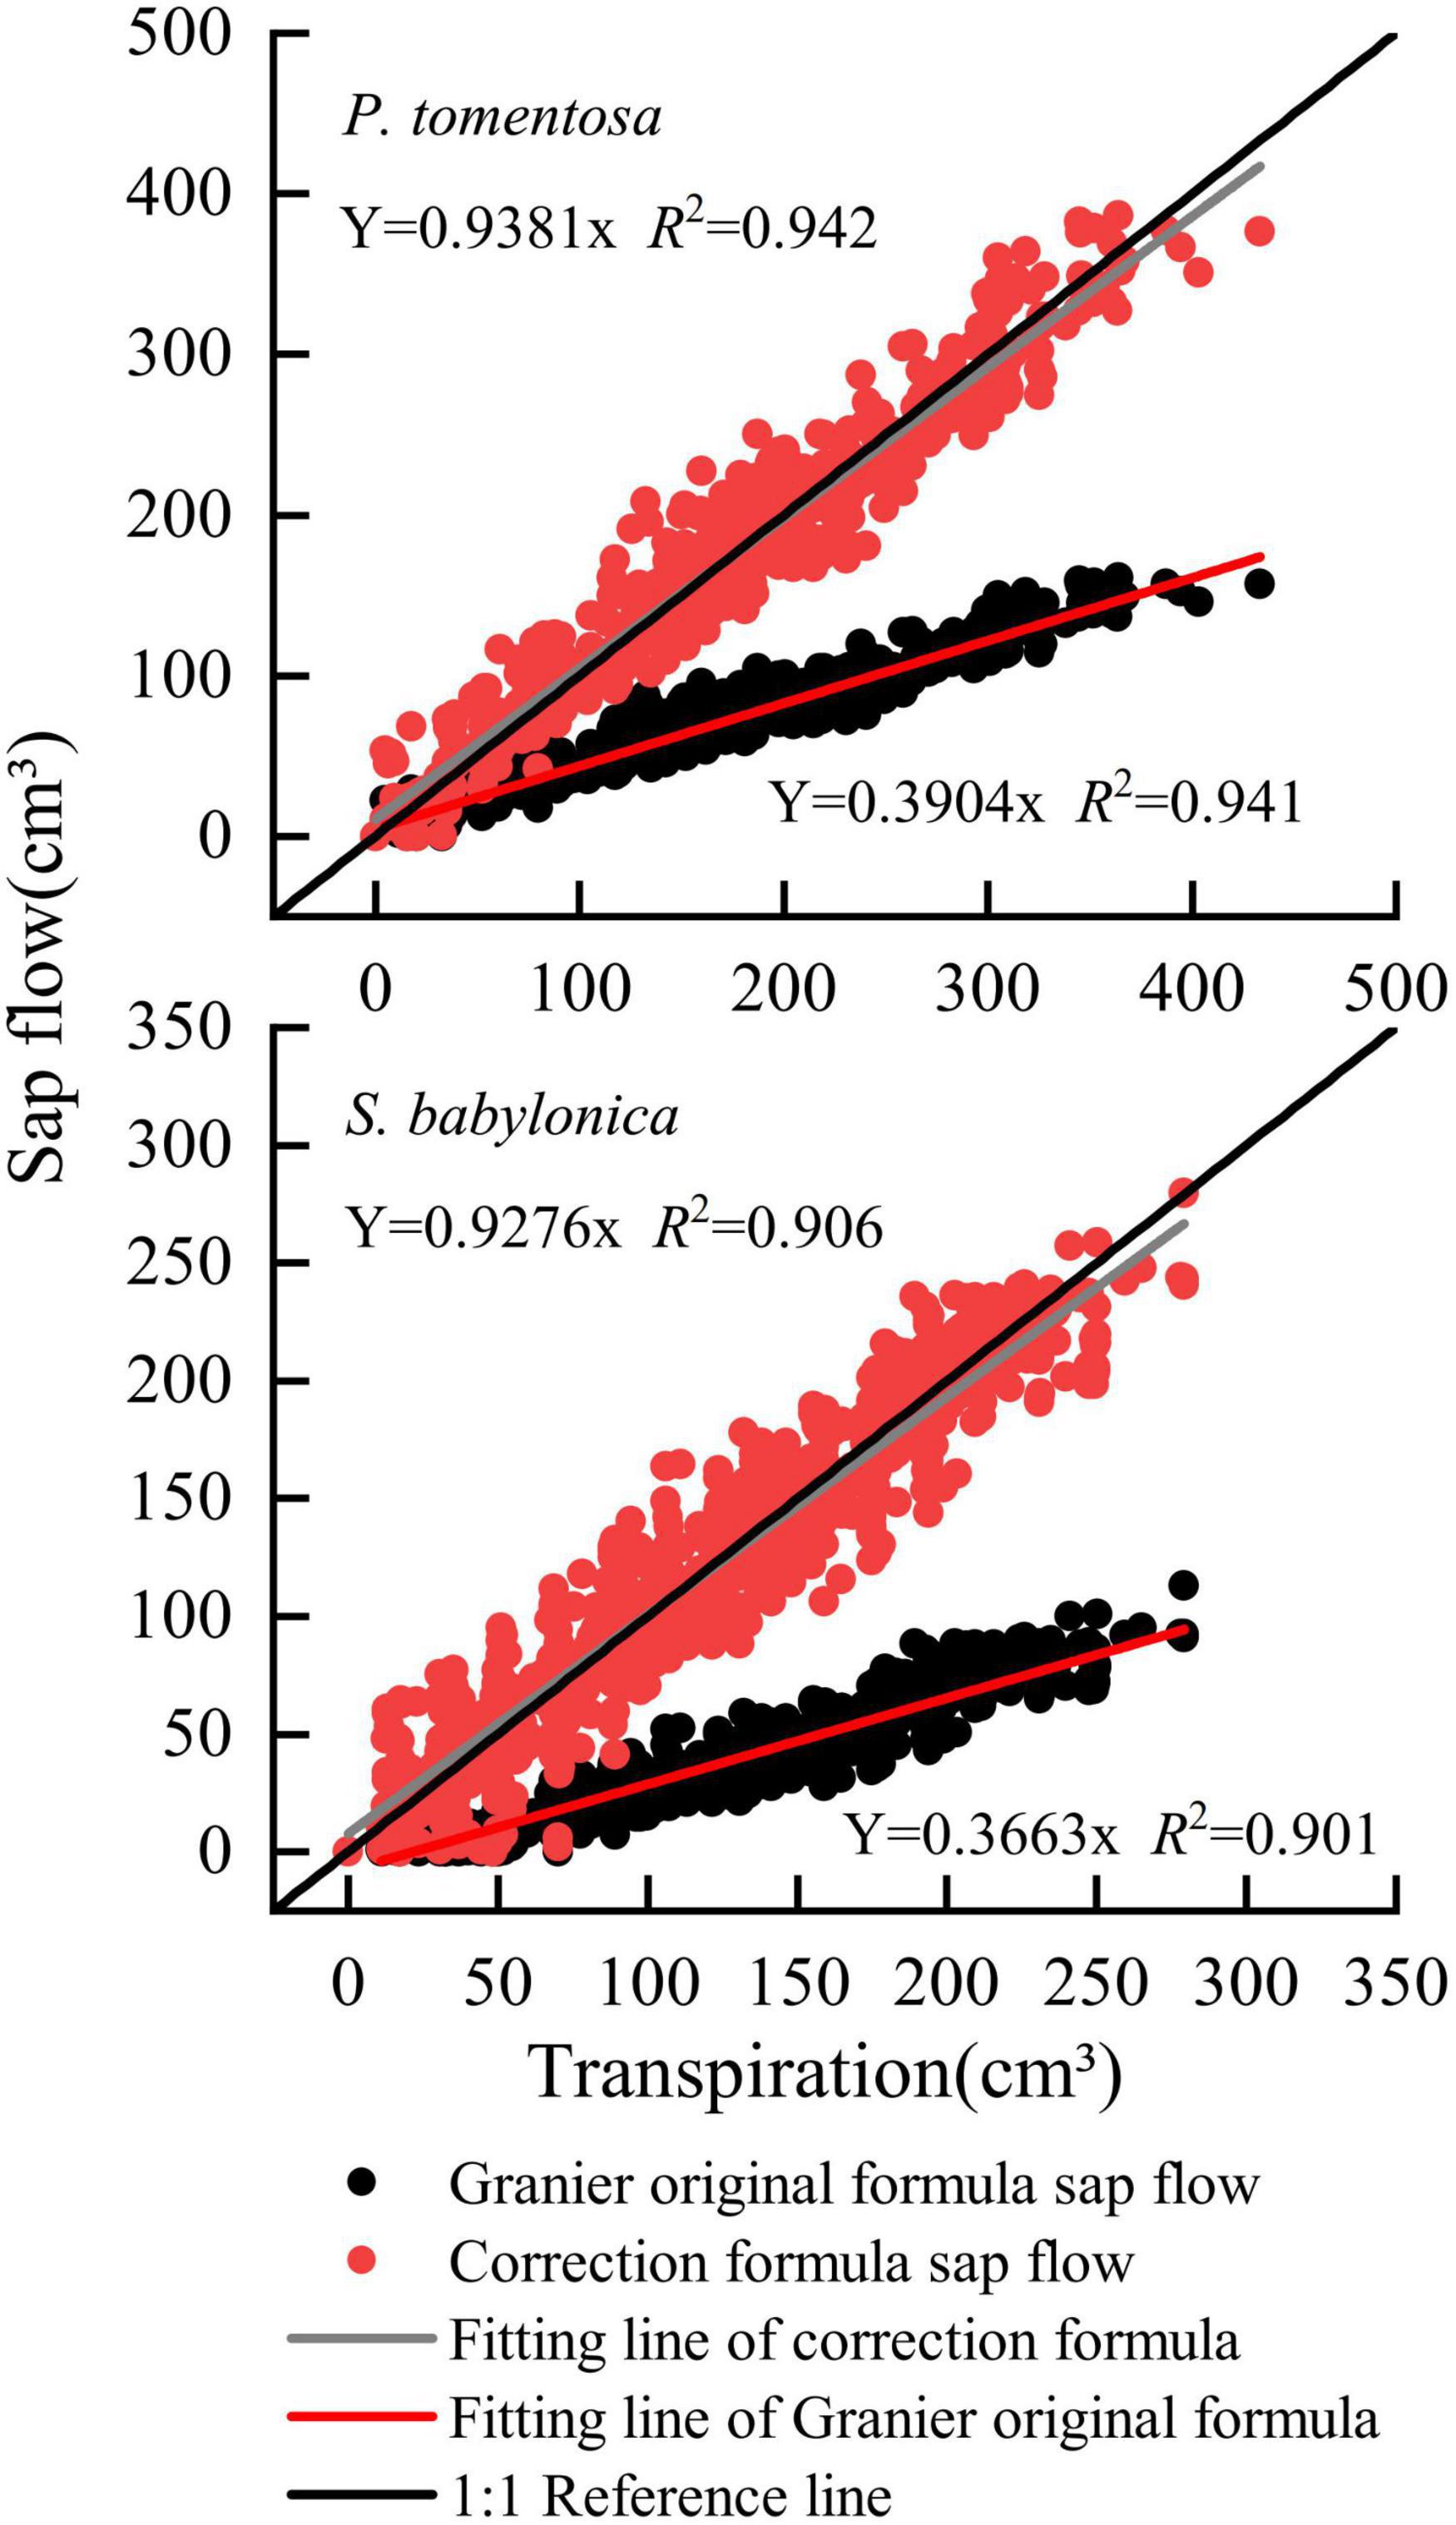
Figure 10. Verifying the correction formulas of P. tomentosa and S. babylonica.
As shown in Figure 11, the overall sap flow calculated by the combined correction formula for P. tomentosa and S. babylonica was closer to the 1:1 reference line, with an error of -3.97%. The errors of the combined correction formula for P. tomentosa and S. babylonica were -12.76% and -2.32%, respectively, which was more accurate.
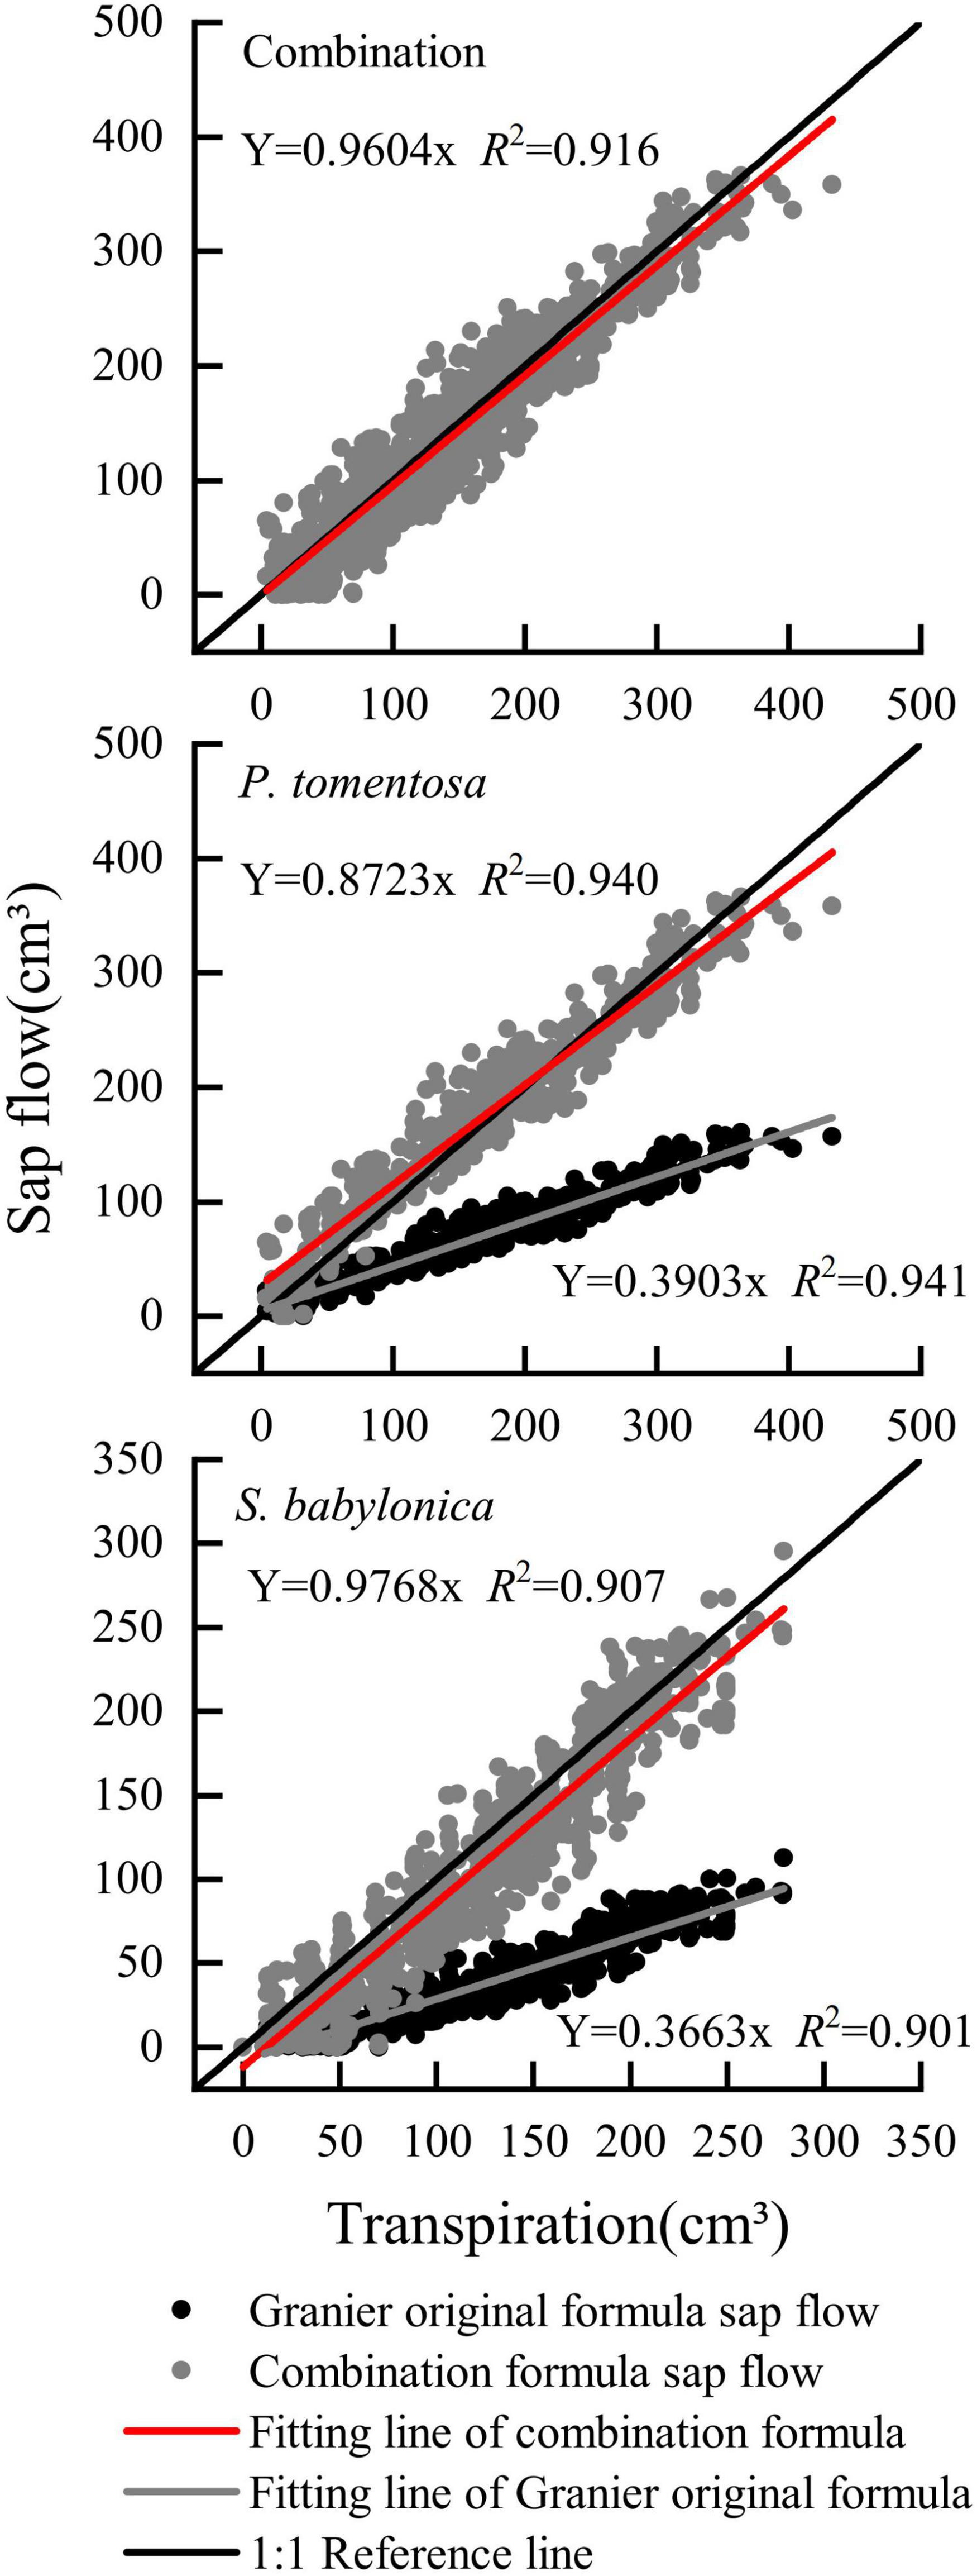
Figure 11. Verifying the combination formula of P. tomentosa and S. babylonica.
To further verify the accuracy of the specific and combined correction formulas for P. tomentosa and S. babylonica, the validity of the formulas was tested for deviations from the true transpiration rates using the D-index, RMSE, MAE, and MBE (Table 4). The combined correction formula and specific correction formulas of P. tomentosa and S. babylonica were both valid and similar, with the transpiration rates measured by LLE.
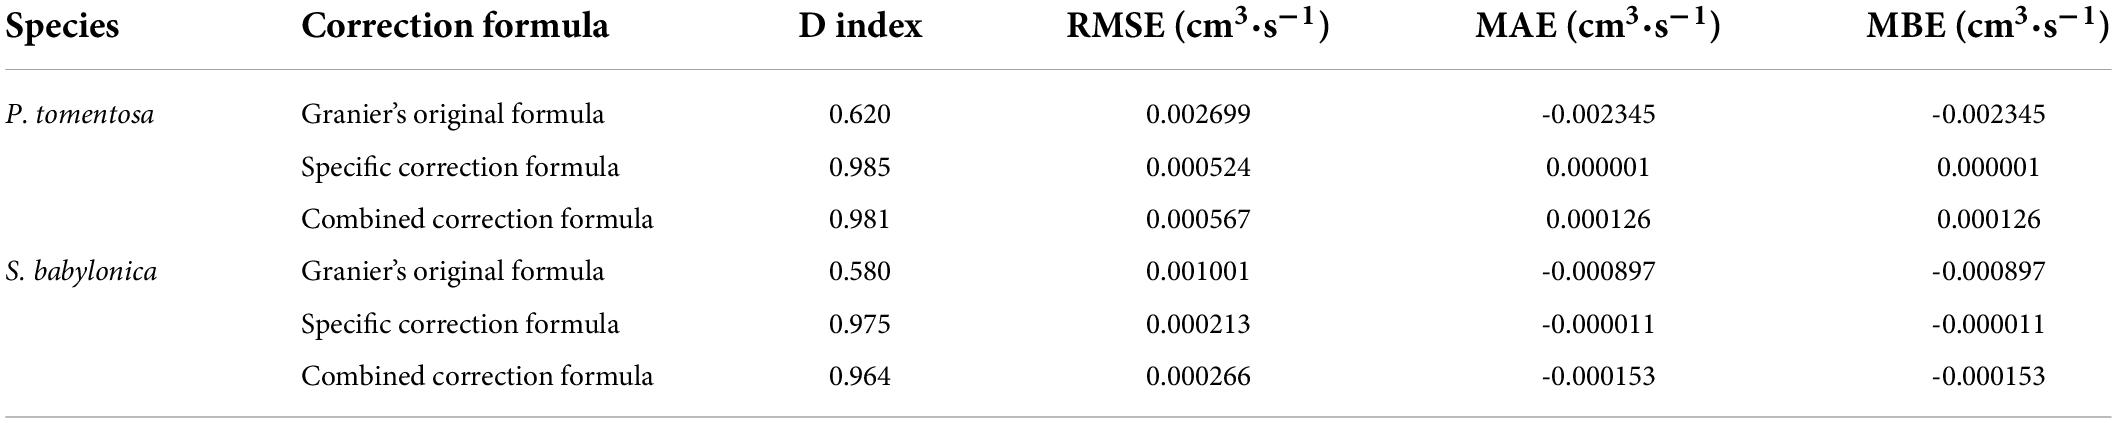
Table 4. Effectiveness of P. tomentosa and S. babylonica in calculating sap flow velocity by Granier’s original formula, specific correction formulas and combined correction formula.
Discussion
Characteristics of changes in sap flow velocity and influencing factors
The daily patterns of sap flow velocity vary significantly under different weather conditions. Most studies concluded that the sap flow velocity showed a single-peaked or a double-peaked curve on sunny days (Zhu et al., 2013). Yu (2010) showed that the sap flow velocity of Robinia pseudoacacia L. showed a single-peaked curve on sunny days and a double-peaked curve on cloudy days, which is consistent with the results of this study on P. tomentosa. In contrast, the sap flow velocity of S. babylonica showed a single-peaked curve on both rainy and sunny days, which may be greatly related to the selection of tree species. Most studies concluded that sap flow velocity had no obvious pattern of change on rainy days and that it was greater on sunny days than on rainy days (Li et al., 2019; Wang, 2020). In this study, the sap flow velocity of P. tomentosa and S. babylonica changed minimally and it was at the lowest velocity during rainy days, which was mainly due to the high relative humidity of the air during rainy days. The vapor pressure deficit between the inside and outside of the leaves was smaller on rainy days, and the rainfall could lead to the closure of leaf stomata, thus showing a greater inhibitory effect on tree transpiration (Cui et al., 2020).
Various environmental factors, such as the biological structure of trees and soil moisture content, exert constraints on the sap flow velocity (Yang et al., 2013). Studies have shown that sap flow velocity was significantly and positively correlated with RA, TA, and WS and significantly and negatively correlated with RH (Granier et al., 1996). As with the results of this study, the sap flow velocity of both P. tomentosa and S. babylonica under sunny and cloudy days was highly significantly and positively correlated with TA, RA, WS, and VPD and highly and negatively correlated with RH, and the overall correlation between sap flow velocity and meteorological factors was weak during rainy days, indicating that sap flow changes increased with TA, RA, and WS and decreased with RH. However, the main environmental factors affecting the trunk sap flow velocity of the two species in the same environment were different in this study, which may be related to the physiological and biochemical characteristics of the trees themselves (Li et al., 2019). Gong et al. (2011) pointed out that although environmental factors had an extremely important influence on tree trunk sap flow, species variability was also one of the important factors that cannot be ignored in sap flow variation, confirming the complexity and relativity of the mechanisms affecting and regulating transpiration water consumption in trees (Li et al., 2017). Studies have shown that more than 90% of the water absorbed by the soil is dissipated to the atmosphere in the form of transpiration (Wang et al., 2012). Ma et al. (2017) concluded that the normal growth of Populus beijingensis W. Y. Hsu was affected when it was subjected to water stress, and Wang et al. (2020) found that the transpiration rate of Betula platyphylla Suk. was accelerated when the soil water content was relatively sufficient; when the soil water was deficient, the stomata were closed or incompletely opened to adapt to the water stress, and the transpiration rate was reduced. Unlike the results of this study, the soil water content at 10–20 cm in P. tomentosa and S. babylonica was more variable, and the change in soil water content at this layer and sap flow velocity were highly significantly negatively correlated, this may be because this experiment was conducted in containers, and the marsupial bottles were constantly supplying sufficient water. The soil moisture meter monitored the change in soil moisture at the microscopic level, and at the macroscopic level, it was always at saturation. Transpiration leads to the depletion of stored water in sapwood tissues, some contraction and expansion of stems occurs at the daily scale, and water reserves in the stem contribute to transpiration and play an important role in optimizing water transport by buffering the extremes of water depletion (Zweifel et al., 2001). Through studies on Populus hopeiensis Hu et Chow, Pinus tabulaeformis Carr., Quercus liaotungensis Blume, and Robinia pseudoacacia L. (Liu et al., 2018, 2021), it was found that sap flow velocity showed an inverse pattern of variation with daily changes in stems, which is the same as the results of this experiment. Stem microvariation was considered to be correlated with meteorological factors such as TA, VPD, TA, and rain (Drew and Downes, 2009; Ehrenberger et al., 2012), which is similar to the conclusions reached in the present experiment, further indicating that stem daily variation is a marker indicating the water status of plants. It was concluded that the coordinated response of transpiration, stem water storage dynamics and tree growth-based water use efficiency allows trees to cope with seasonal and interannual drought conditions (Sánchez-Costa et al., 2015). Correlation analysis revealed that P. tomentosa sap flow velocity was highly significantly negatively correlated with stem change (P < 0.01) and significantly negatively correlated with soil water content (P < 0.05), and soil water content was highly significantly positively correlated with stem change (P < 0.01). S. babylonica sap flow velocity was highly significantly negatively correlated with both stem change and soil water content (P < 0.01), and stem change was significantly positively correlated with soil water content (P < 0.05), which showed that there was a close relationship between sap flow velocity, stem microvariation and soil water content.
Validation and correction of the original Granier’s formula
Granier’s original formula, which is one of the core elements of the heat dissipation sap flow determination technique, was constructed based on the calibration results of three species of Pseudotsuga menziesii (Mirb.) Franco, Pinus nigra Arn. and Quercus pedunculata Ehrh. and extended to other tree species for application (Granier, 1985). The formula was considered to be applicable to all tree species. However, in recent years, some scholars have studied the results of Quercus alba L., Corylus avellane Linn., Fagus grandifolia subsp., Robinia pseudoacacia L., Quercus variabilis Bl., Tamarix ramosissima Ledeb. and Chimononthus praecox (L.) Link and noted that there were cases of underestimation or overestimation of the true values of sap flow with relative errors ranging from -80 to 9% (Hultine et al., 2010; Steppe et al., 2010; Sun et al., 2012; Xie and Wan, 2018). In this study, the errors of P. tomentosa and S. babylonica were -60.96% and -63.37%, respectively. TDP measurement errors are mainly due to the biological and physical characteristics of trees, such as the sapwood area of Granier’s original formula, which requires the measurement of cross-sectional area without damaging the tree, possibly resulting in errors in determining the sapwood area (Jia et al., 2020; Ma et al., 2020). The length of sapwood conduits, the size of conduit diameter, and the number of grain pores, which affect the water transfer efficiency of conduits (Baas, 1976; Tyree and Zimmermann, 2013; Li, 2018). The differences in hydraulic conductivity of wood in different orientations, and the non-uniform distribution of trunk sap flow in radial depth caused by differences in xylem structure, which can also cause measurement errors (Becker, 1996; Cermak and Nadezhdina, 1998; Nadezhdina et al., 2002; Tateishi et al., 2008). The determination of the maximum temperature difference ΔTmax in Granier’s original formula, which may also have some errors that may vary with temperature and sap flow velocity (Lu et al., 2004). The fact that as the measurement time increases, the thermal damage to the trunk caused by the TDP heating probes increases, which may also have an impact on the accuracy of the measurement (Wiedemann et al., 2016). Thus, the effects of wood anatomy and the surrounding environmental factors on sap flow should be further investigated to reveal the causes of errors.
Because of the varying errors in the determination of trunk sap flow by TDP, many researchers have calibrated the original Granier’s formula coefficients. Sun et al. (2012) used the calibration coefficients for the calculation of sap flow in Populus deltoides Marsh. (α:0.0121, β:1.141), Quercus alba L. (α:0.0128, β:1.470), Ulmus americana L. (α:0.0272, β:2.572), Pinus echinata Mill. (α:0.0101, β:1.303), and Pinus taeda L. (α:0.0097, β:1.336) to reduce the errors of these five tree species to approximately 4% and the error for Liquidambar styraciflua L. (α:0.0124, β:1.115) to 8%. Rubilar et al. (2017) quantified the sap flow of 2-year-old Eucalyptus globulus L. using Granier’s original formula and further improved the sap flow determination using the calibrated parameters α = 0.0385 and β = 1.245. In this study, by verifying and correcting the original Granier’s formula for P. tomentosa and S. babylonica, the specific correction equations were obtained as Fd = 0.0287K1.236 (R2 = 0.941) and Fd = 0.0145K0.852 (R2 = 0.904), respectively, and the combined correction equation formula was Fd = 0.0235K1.080 (R2 = 0.957). For both the specific correction equations and the combined correction equation, the coefficients were all different from Granier’s original equation, and both fit better. It can also be reflected that both species belong to bulk-porous timber species, and the wood anatomical structures are relatively homogeneous in both, which makes them suitable for the development of a generalized calibration formula for bulk-porous timber. In contrast, the ring-porous and nonporous species need further calibration measurements because there are large differences in moisture transport structures for different species, as Bush et al. (2010) pointed out that the TDP method had a greater error rate for true sap flow with ring-porous wood, while Sun et al. (2012) also found that TDP underestimated sap flow more for bulk-porous wood (34–55%) than for ring-porous wood (9–15%). It is evident that the wood anatomy of different species can significantly affect the accuracy of TDP (Lu et al., 2004). In future studies, to improve the estimation accuracy, it can be combined with methods such as the lysimeter method (Tfwala et al., 2018) and high-precision electronic potometer method (Pasqualotto et al., 2019) to construct combined calibration equations (Bleby et al., 2004; Fuchs et al., 2017) by stand type or climatic zone, classified according to bulk-porous, ring-porous and nonporous material, which is more generalizable.
Conclusion
The sap flow velocity of P. tomentosa and S. babylonica under different weather conditions showed different curves. Meteorological factors and soil moisture content are the driving factors of sap flow velocity of both species. Sap flow velocity, soil water content and stem daily variation together reflected the water use dynamics of P. tomentosa and S. babylonica.
Compared to that measured by the LLE method, the sap flow measured by Granier’s original formula for P. tomentosa and S. babylonica was severely underestimated. We established and validated the specific correction formulas and the combined correction formula for both species, and the errors of sap flow calculated by the specific correction formulas for both species were -6.18% and -5.86%, and those calculated by the combined correction formula were -12.76% and -2.32%, respectively. Thus, the accuracy of the established specific correction formulas and the combined correction formula for estimating the sap flow of P. tomentosa and S. babylonica were both considerable.
Data availability statement
The raw data supporting the conclusions of this article will be made available by the authors, without undue reservation. The raw data for this study can be found in Supplementary material 2.
Author contributions
YL drafted, revised the manuscript, and contributed to data analysis. HZ participated in the experiments and contributed to data analysis. CD revised the manuscript and performed the maintenance of the instruments. CM and BL designed, coordinated the study and revised the manuscript. All authors contributed to the article and approved the submission.
Funding
This work was funded by the National Key Research and Development Program of China (grant no. 2021YFD2201201).
Acknowledgments
We express sincere gratitude to all the authors involved in this study.
Conflict of interest
The authors declare that the research was conducted in the absence of any commercial or financial relationships that could be construed as a potential conflict of interest.
Publisher’s note
All claims expressed in this article are solely those of the authors and do not necessarily represent those of their affiliated organizations, or those of the publisher, the editors and the reviewers. Any product that may be evaluated in this article, or claim that may be made by its manufacturer, is not guaranteed or endorsed by the publisher.
Supplementary material
The Supplementary Material for this article can be found online at: https://www.frontiersin.org/articles/10.3389/fpls.2022.946804/full#supplementary-material
Abbreviations
LLE, liquid level equilibrium method; TDP, thermal diffusion probe method; Fd, flow velocity; As, area.
References
Abbas, F., Fares, A., and Fares, S. (2011). Field calibrations of soil moisture sensors in a forested watershed. Sensors 11, 6354–6369. doi: 10.3390/s110606354
Baas, P. (1976). Some functional and adaptive aspects of vessel member morphology. Leiden Bot. Series 3, 157–181.
Becker, P. (1996). Sap flow in Bornean heath and Dipterocarp forest trees during wet and dry periods. Tree Physiol. 16, 295–299. doi: 10.1093/treephys/16.1-2.295
Bleby, T. M., Burgess, S. S. O., and Adams, M. A. (2004). A validation, comparison and error analysis of two heat-pulse methods for measuring sap flow in Eucalyptus marginata saplings. Funct. Plant Biol. 31, 645–658. doi: 10.1071/FP04013
Bush, S. E., Hultine, K. R., Sperry, J. S., and Ehleringer, J. R. (2010). Calibration of thermal dissipation sap flow probes for ring- and diffuse-porous trees. Tree Physiol. 30, 1545–1554. doi: 10.1093/treephys/tpq096
Cermak, J., and Nadezhdina, N. (1998). Sapwood as the scaling parameter-defining according to xylem water content or radial pattern of sap flow? Ann. Sci. For. 55, 509–521. doi: 10.1051/forest:19980501
Chang, X. X., Zhao, W. Z., Liu, H., Wei, X., Liu, B., and He, Z. B. (2014). Qinghai spruce (Picea crassifolia) forest transpiration and canopy conductance in the upper Heihe River Basin of arid northwestern China. Agric. For. Meteorol. 19, 209–220. doi: 10.1016/j.agrformet.2014.08.015
Chen, S. P., Lin, G. H., Huang, J. H., and Jenerette, G. D. (2010). Dependence of carbon sequestration on the differential responses of ecosystem photosynthesis and respiration to rain pulses in a semiarid steppe. Glob. Change Biol. 15, 2450–2461. doi: 10.1111/j.1365-2486.2009.01879.x
Cui, H. X., Tang, W. P., Hu, W. J., Zhou, W. C., Pan, L., and Yang, J. Y. (2020). Characteristics of the Sap Flow and Correlation Analysis with Environmental Factors of Two Tree Species in Shennongjia. J. Northwest For. Univ. 35, 37–44. doi: 10.3969/j.issn.1001-7461.2020.01.06
Dang, H. Z., Feng, J. C., and Han, H. (2020). Characteristics of azimuthal variation of sap flux density in Pinus sylvestris var. Mongolica grown in sandy land. Sci. Silvae Sin. 56, 29–37.
Dix, M. J., and Aubrey, D. P. (2021). Recalibrating Best Practices, Challenges, and Limitations of Estimating Tree Transpiration Via Sap Flow. Curr. For. Rep. 7, 31–37. doi: 10.1007/s40725-021-00134-x
Do, F., and Rocheteau, A. (2002). Influence of natural temperature gradients on measurements of xylem sap flow with thermal dissipation probes. 1. Field observations and possible remedies. Tree Physiol. 22, 641–648. doi: 10.1093/treephys/22.9.641
Drew, D. M., and Downes, G. M. (2009). The use of precision dendrometers in research on daily stem size and wood property variation: A review. Dendrochronologia 27, 159–172. doi: 10.1016/j.dendro.2009.06.008
Ehrenberger, W., Rüger, S., Fitzke, R., Vollenweider, P., and Günthardt-Goerg, M. (2012). Concomitant dendrometer and leaf patch pressure probe measurements reveal the effect of microclimate and soil moisture on diurnal stem water and leaf turgor variations in young oak trees. Funct. Plant Biol. 39, 297–305. doi: 10.1071/FP11206
Fan, J. L., Guyot, A., Ostergaard, K. T., and Lockington, D. A. (2018). Effects of earlywood and latewood on sap flux density-based transpiration estimates in conifers. Agric. For. Meteorol. 249, 264–274. doi: 10.1016/j.agrformet.2017.11.006
Fuchs, S., Leuschner, C., Link, R., Coners, H., and Schuldt, B. (2017). Calibration and comparison of thermal dissipation, heat ratio and heat field deformation sap flow probes for diffuse-porous trees. Agric. For. Meteorol. 244, 151–161. doi: 10.1016/j.agrformet.2017.04.003
Gao, Y., Jiang, H. Y., Zhao, D. N., Wang, Z. Y., and Feng, Q. X. (2011). Preliminary study on cultivation of big—diameter timber of precious tree. J. Jilin For. Sci. Technol. 40, 13–15. doi: 10.16115/j.cnki.issn.1005-7129.2011.02.004
Gong, X. Y., Chen, Q., Lin, S., Brueck, H., Dittert, K., Taube, F., et al. (2011). Tradeoffs between nitrogen-and water-use efficiency in dominant species of the semiarid steppe of Inner Mongolia. Plant Soil 340, 227–238. doi: 10.1007/s11104-010-0525-9
Granier, A. (1985). Une nouvelle méthode pour la mesure du flux de sève brute dans le tronc des arbres. Ann. Sci. For. 42, 193–200. doi: 10.1051/forest:19850204
Granier, A., Huc, R., and Barigah, S. T. (1996). Transpiration of natural rain forestand its dependence on climatic factors. Agric. For. Meteorol. 78, 19–29. doi: 10.1016/0168-1923(95)02252-X
Hubbart, J. A., Kavanagh, K. L., Robert, P., Tim, L., and Alisa, S. (2007). Cold air drainage and modeled nocturnal leaf water potential in complex forested terrain. Tree Physiol. 27, 631–639. doi: 10.1093/treephys/27.4.631
Hultine, K. R., Nagler, P. L., Morino, K., Bush, S. E., Burtch, K. G., Dennison, P. E., et al. (2010). Sap flux-scaled transpiration by tamarisk (Tamarix spp.) before, during and after episodic defoliation by the saltcedar leaf beetle (Diorhabda carinulata). Agric. For. Meteorol. 150, 1467–1475. doi: 10.1016/j.agrformet.2010.07.009
Jia, T. Y., Liu, T. X., Duan, L. M., Zhang, Y. R., Tong, X., and Bao, Y. Z. (2020). Transpiration and water consumption of poplar trees in semi-arid dune meadow transition zone. Chin. J. Ecol. 39, 3255–3264. doi: 10.13292/j.1000-4890.202010.014
Kanalas, P., Fenyvesi, A., Kis, J., Szõllõsi, E., Olah, V., Ander, I., et al. (2010). Seasonal and diurnal variability in sap flow intensity of mature sessile oak (Quercus petraea (Matt.) Liebl.) trees in relation to microclimatic conditions. Acta Biol. Hung. 61, 95–108. doi: 10.1556/ABiol.61.2010.Suppl.10
Knight, D. H., Fahey, T. J., Running, S. W., Harrison, A. T., and Wallace, L. L. (1981). Transpiration from 100-yr-old Lodgepole pine forests estimated with whole-tree Potometers. Ecology 62, 717–726.
Ladefoged, K. (1960). A method for measuring the water consumption of larger intact trees. Physiol. Plant. 13, 648–658. doi: 10.1111/j.1399-3054.1960.tb08087.x
Li, H., Hu, S. J., Zhu, H., and Li, X. Q. (2017). Characterization of stem sapflow Haloxylon ammodendron by using thermal dissipation technology. Acta Ecol. Sin. 37, 7187–7196.
Li, S. N., Lu, S. W., Zhao, Y. G., Zhao, N., and Chen, B. (2019). Characteristics and Influencing Factors in Sap Flow of Four Broadleaved Tree Species for Typical Weather Conditions of Beijing. J. Ecol. Rural Environ. 35, 189–196. doi: 10.19741/j.issn.1673-4831.2017.0869
Li, Y. L. (2018). Research on Modification of Fast-growing Poplar Based on Transpiration. Hohhot: Inner Mongolia Agricultural University.
Liu, M. J., Lv, J. L., Chen, Q. W., Yang, J., Li, G. Q., and Du, C. (2021). Dynamics and influencing factors of stem diameter micro-variations during the growing season in two typical forestation species in the loess hilly region. China. Chin. J. Appl. Ecol. 32, 1673–1680. doi: 10.13287/j.1001-9332.202105.005
Liu, Q. X., Meng, P., Zhang, J. S., Gao, J., Huang, H., and Sun, S. J. (2011). Potential errors in measuring tree transpiration based on thermal dissipation method. Chin. J. Appl. Ecol. 22, 3343–3350. doi: 10.13287/j.1001-9332.2011.0463
Liu, Q. X., Meng, P., Zhang, J. S., Gao, J., Sun, S. J., and Jia, C. R. (2012). Measurement accuracy of Granier calibration based on transpiration of Platycladus orientalis. Chin. J. Appl. Ecol. 23, 1490–1494. doi: 10.13287/j.1001-9332.2012.0249
Liu, W., Wei, T. X., and Zhu, Q. K. (2018). Growing season sap flow of Populus hopeiensis and Pinus tabulaeformis in the semi-arid Loess Plateau. China. J. Zhejiang Univ. 35, 1045–1053. doi: 10.11833/j.issn.2095-0756.2018.06.007
Lu, P., Urban, L., and Zhao, P. (2004). Granier’s thermal dissipation probe (TDP) method for measuring sap flow in trees: Theory and practice. Acta Bot. Sin. 46, 631–646.
Ma, C. M., Ma, Y. J., and Cheng, Y. M. (2017). Characteristics and the Driving Forces of Sapflow in stems of Populus beijingensis in Bashang Area of North-west Hebei. J. Soil Water Conserv. 31, 338–344. doi: 10.13870/j.cnki.stbcxb.2017.06.053
Ma, C. M., Zhang, H. H., Han, Y., Meng, Q. X., Zhang, J. S., and Ma, Y. J. (2021). Error and Correction Formula of Granier’s Original Formula to Calculate the Stem Sap Flux Density of Clone 107 Poplar. Sci. Silvae Sin. 57, 161–169.
Ma, J., Guo, J. B., Liu, Z. B., Wang, Y. H., and Zhang, Z. Y. (2020). Diurnal variations of stand transpiration of Larix principis-rupprechtii forest and its response to environmental factors in Liupan Mountains of northwestern China. J. Beijing For. Univ. 42, 1–11. doi: 10.12171/j.1000-1522.20190468
Ma, Y. J. (2020). Research on applicability of thermal dissipation probe method in sap flow measurement of diffuse-porous wood. Hebei: Hebei Agricultural University.
Martínez-Vilalta, J., Korakaki, E., Vanderklein, D., and Mencuccini, M. (2007). Below-Ground Hydraulic Conductance Is a Function of Environmental Conditions and Tree Size in Scots Pine. Funct. Ecol. 21, 1072–1083. doi: 10.1111/j.1365-2435.2007.01332
Mcdowell, N. G., White, S., and Pockman, W. T. (2010). Transpiration and stomatal conductance across a steep climate gradient in the southern Rocky Mountains. Ecohydrol 1, 193–204. doi: 10.1002/eco.20
Molina, A. J., Aranda, X., Llorens, P., Galindo, A., and Biel, C. (2019). Sap flow of a wild cherry tree plantation growing under Mediterranean conditions: Assessing the role of environmental conditions on canopy conductance and the effect of branch pruning on water productivity. Agric. Water Manag. 218, 222–233. doi: 10.1016/j.agwat.2019.03.019
Nadezhdina, N., Èermák, J., and Ceulemans, R. (2002). Radial patterns of sap flow in woody stems of dominant and understory species: Scaling errors associated with positioning of sensors. Tree Physiol. 22, 907–918. doi: 10.1093/treephys/22.13.907
Pasqualotto, G., Carraro, V., Menardi, R., and Anfodillo, T. (2019). Calibration of Granier-Type (TDP) Sap Flow Probes by a High Precision Electronic Potometer. Sensors 19:2419. doi: 10.3390/s19102419
Qu, B. L., Guo, Y. P., Yang, J. W., Lu, K. L., and Ma, C. M. (2022). Characteristics of Sap Flow in Fast-growing Poplar and Its Response to Driving Factors in the Central Hebei Plain. J. Northeast For. Univ. 48, 18–22. doi: 10.13759/j.cnki.dlxb.2020.12.004
Rana, G., Lorenzi, F. D., Palatella, L., Martinelli, N., and Ferrara, R. M. (2019). Field scale recalibration of the sap flow thermal dissipation method in a Mediterranean vineyard. Agric. For. Meteorol. 269, 169–179. doi: 10.1016/j.agrformet.2019.02.018
Roberts, J. (1977). The Use of the ‘Tree Cutting’ Technique in the study of the water relations of Norway Spruce, Picea abies (L.) Karst. J. Exp. Bot. 29, 456–471. doi: 10.1093/jxb/29.2.465
Rubilar, R. A., Hubbard, R. M., Yañez, M. A., Medina, A. M., and Valenzuela, H. E. (2017). Quantifying differences in thermal dissipation probe calibrations for Eucalyptus globulus species and E. nitens× globulus hybrid. Trees 31, 1263–1270. doi: 10.1007/s00468-017-1545-3
Sánchez-Costa, E., Poyatos, R., and Sabaté, S. (2015). Contrasting growth and water use strategies in four co-occurring Mediterranean tree species revealed by concurrent measurements of sap flow and stem diameter variations. Agric. For. Meteorol. 207, 24–37. doi: 10.1016/j.agrformet.2015.03.012
Schenk, H. J., Espino, S., Mendez, A. N., and Mcelrone, A. J. (2013). Limitations in the hydraulic pathway: Effects of xylem embolisms on sap velocity and flow. Acta Hortic. 991, 323–332. doi: 10.17660/ActaHortic.2013.991.40
Smith, D. M., and Allen, S. J. (1996). Measurement of sap flow in plant stems. J. Exp. Bot. 47, 1833–1844. doi: 10.1093/jxb/47.12.1833
Steppe, K., De Pauw, D. J. W., Doody, T. M., and Teskey, R. O. (2010). A comparison of sap flux density using thermal dissipation, heat pulse velocity and heat field deformation methods. Agric. For. Meteorol. 150, 1046–1056. doi: 10.1016/j.agrformet.2010.04.004
Sun, H., Aubrey, D. P., and Teskey, R. O. (2012). A simple calibration improved the accuracy of the thermal dissipation technique for sap flow measurements in juvenile trees of six species. Trees 26, 631–640. doi: 10.1007/s00468-011-0631-1
Tateishi, M., Kumagai, T., Utsumi, Y., Umebayashi, T., and Shiba, Y. (2008). Spatial variations in xylem sap flux density in evergeen oak trees with radial-porous wood: Comparisons with anatomical observations. Trees 22, 23–30. doi: 10.1007/s00468-007-0165-8
Tfwala, C. M., van Rensburg, L. D., Bello, Z. A., and Green, S. R. (2018). Calibration of compensation heat pulse velocity technique for measuring transpiration of selected indigenous trees using weighing lysimeters. Agric. Water Manag. 200, 27–33. doi: 10.1016/j.agwat.2018.01.005
Tyree, M. T., and Sperry, J. S. (1988). Do woody plants operate near the point of catastrophic xylem dysfunction caused by dynamic water stress?: Answers from a model. Plant Physiol. 88, 574–580. doi: 10.1104/pp.88.3.574
Tyree, M. T., and Zimmermann, M. H. (2013). Xylem Structure and the Ascent of Sap. Berlin: Springer Science & Business Media.
Wang, H. X. (2020). Water Consumption Characteristics and Influencing Factors of Common Conifer and Broad-leaved Tree Species based on Sap Flow. Anhui Agri. Sci. Bull. 26, 51–56. doi: 10.16377/j.cnki.issn1007-7731.2020.z1.022
Wang, W. J., Sun, W., Qiu, L., Zu, Y. G., and Liu, W. (2012). Relations Between Stem Sap Flow Density of Larix gmelinii and Environmental Factors under Different Temporal Scale. Sci. Sylvae Sin. 48, 77–85. doi: 10.11707/j.1001-7488.20120113
Wang, Y., Wei, J. S., Zhou, M., Zhao, P. W., and Liu, P. P. (2020). Response of Sap Flow of Betula platyphylla to Soil Moisture in Southern Greater Xing’an Mountains. Res. Soil Water Conserv. 27, 128–133. doi: 10.13869/j.cnki.rswc.2020.04.017
Wang, Y. X., Xu, L. A., and Huang, M. R. (2018). Research Progress on Salix Genetics. Chin. Bull. Bot. 2, 240–247. doi: 10.3969/j.issn.1674-3466.2008.02.014
Wiedemann, A., Marañón-Jiménez, S., Rebmann, C., and Cuntz, M. (2016). An empirical study of the wound effect on sap flux density measured with thermal dissipation probes. Tree Physiol. 36, 1471–1484. doi: 10.1093/treephys/tpw071
Xie, J., and Wan, X. C. (2018). The accuracy of the thermal dissipation technique for estimating sap flow is affected by the radial distribution of conduit diameter and density. Acta Physiol. Plant. 40, 1–10. doi: 10.1007/s11738-018-2659-y
Yang, G. Y., Zhang, T., Dai, F., Zhao, M. S., and Jiang, W. W. (2013). Characteristics of Stem Sap Flow of Cryptomeria fortune and Relevant Factor Analysis in Spring and Autumn at Mount Tianmu. J. Northwest For. Univ. 28, 8–14. doi: 10.3969/j.issn.1001-7461.2013.02.02
Yang, J., Lv, J. L., He, Q. Y., Yan, M. J., Li, G. Q., and Du, S. (2019). Time lag of stem sap flow and its relationships with transpiration characteristics in Quercus liaotungensis and Robina pseudoacacia in the loess hilly region. Chin. J. Appl. Ecol. 30, 2607–2613. doi: 10.13287/j.1001-9332.201908.013
Yu, Y. (2010). Studies on Water Consumption Characteristics of Main Ecosystem Tree Species in Semi-arid Region on Loess Plateaus of Shanxi. Ph.D thesis, Changsha: Central South University of Forestry and Technology.
Zhao, C. Y., Si, J. H., Feng, Q., Yu, T. F., and Li, P. D. (2017). Comparative study of daytime and nighttime sap flow of Populus euphratica. Plant Growth Regul. 82, 353–362. doi: 10.1007/s10725-017-0263-6
Zhao, W. Q., Xi, B. Y., Liu, J. Q., Liu, Y., Zou, S. Y., and Song, W. Y. (2021). Transpiration process and environmental response of poplar plantation under different irrigation conditions. Chin. J. Plant Ecol. 45, 370–382. doi: 10.17521/cjpe.2020.0343
Zhu, Y., Lv, G. H., Hu, Y. Y., Yang, X. D., and Ran, Q. Y. (2013). The experimental study of Populus euphratica sap flow characteristics in the Ebinur lake basin. J. Arid Land Resour. Environ. 27, 69–73. doi: 10.13448/j.cnki.jalre.2013.11.017
Zweifel, R., and Häsler, R. (2001). Dynamics of water storage in mature subalpine Picea abies: Temporal and spatial patterns of change in stem radius. Tree Physiol. 21, 561–569. doi: 10.1093/treephys/21.9.561
Keywords: Populus tomentosa Carr., Salix babylonica L., sap flow, influencing factors, dissipation probe method, liquid level equilibrium method, Granier calibration
Citation: Liu Y, Zhang H, Ma C, Liu B and Ding C (2022) Verification of sap flow characteristics and measurement errors of Populus tomentosa Carr. and Salix babylonica L. based on the liquid level equilibrium method. Front. Plant Sci. 13:946804. doi: 10.3389/fpls.2022.946804
Received: 18 May 2022; Accepted: 02 August 2022;
Published: 30 August 2022.
Edited by:
Fenghui Yuan, University of Minnesota Twin Cities, United StatesReviewed by:
Pingdong Zhang, Beijing Forestry University, ChinaMuhammad Hayat, Peking University, China
Copyright © 2022 Liu, Zhang, Ma, Liu and Ding. This is an open-access article distributed under the terms of the Creative Commons Attribution License (CC BY). The use, distribution or reproduction in other forums is permitted, provided the original author(s) and the copyright owner(s) are credited and that the original publication in this journal is cited, in accordance with accepted academic practice. No use, distribution or reproduction is permitted which does not comply with these terms.
*Correspondence: Changming Ma, machangming@126.com; Bingxiang Liu, proser211@126.com; Changjun Ding, changjund@126.com