 Lucun Yang
 Jingjing Li3
 Guoying Zhou
- 1Northwest Institute of Plateau Biology, Chinese Academy of Sciences, Xining, China
- 2Key Laboratory of Tibetan Medicine Research, Chinese Academy of Sciences, Xining, China
- 3College of Life Science, Qinghai Normal University, Xining, China
Swertia L. is a large genus in the family Gentianaceae. Different chloroplast gene segments have been used to study systematic evolutionary relationships between species of Swertia L. However, as gene fragment–based phylogenies lack sufficient resolution, the systematic evolutionary relationships between Swertia L. species have remained unclear. We sequenced and annotated the complete chloroplast genomes of four Swertia species, namely, S. bifolia, S. tetraptera, S. franchetian, and S. przewalskii, using next generation sequencing and the plastid genome annotator tool. The chloroplast genome sequences of 19 additional species of Swertia L. were downloaded from the NCBI database and also assessed. We found that all 23 Swertia L. species had a similar genetic structure, that is, a ring tetrad structure, but with some clear differences. The chloroplast genomes of the 23 Swertia L. species were 149036–153691 bp long, averaging 152385 bp; the genomes contained 134 functional genes: 38 tRNA, eight rRNA, and 88 protein-encoding genes. A comparative analysis showed that chloroplasts genome of Swertia was conserved in terms of genome structure, codon preference, and repeat sequences, but it differed in terms of genome sizes, gene contents, and SC/IR boundary. Using Swertia wolfangiana as a reference, we found clear divergences in most of the non-coding and intergenic regions of the complete chloroplast genomes of these species; we also found that rpoC1, ccsA, ndhI, ndhA, and rps15 protein-coding genes had large variations. These highly variable hotspots will be useful for future phylogenetic and population genetic studies. Phylogenetic analysis with high bootstrap support showed that Swertia L. was not monophyletic. The classification of subgen. Swertia and subgen. Ophelia was supported by molecular data, which also partly supported the division of sect. Ophelia, sect. Platynema, sect. Poephila, sect. Swertia, and sect. Macranthos. However, the systematic positions of other groups and species require further exploration. The Swertia L formed at 29.60 Ma. Speciation of 10 species occurred in succession after 12 Ma and 13 species occurred in succession after 2.5 Ma. Our analysis provides insight into the unresolved evolutionary relationships of Swertia L. species.
Introduction
Swertia L. is a large genus in the family Gentianaceae and is widely distributed in Asia, Africa, and North America, with only a few species found in Europe. There are 170 species of Swertia L. plants, divided into 3 subgenera and 11 groups, which include 79 species found in China. These 79 species are most abundant in the Qinghai–Tibetan Plateau (Struwe and Albert, 2002; Von Hagen and Kadereit, 2002; Ho and Liu, 2015). A variety of plants in the Swertia L. genus have a long history of medicinal use in China. These plants and their components (such as oleanolic acid) have liver protective, enzyme lowering, anti-inflammatory, cardiotonic, diuretic, and anticancer effects and currently comprise part of an effective drug strategy for the treatment of hepatitis (Liang and Gao, 1979; Chen et al., 1999; Ma et al., 2008). Recent pharmacological studies have shown that plants from this genus can strengthen the heart, lower blood glucose concentration, promote blood circulation, and inhibit testosterone reductase (Li et al., 2007). Thus, a significant amount of attention has been paid to Swertia L. because of its extensive pharmacological effects. However, the origins of this genus have been disputed, even at the subgenus and species levels (Chassot et al., 2001; Struwe and Albert, 2002; Von Hagen and Kadereit, 2002; Shi, 2004; Favre et al., 2010; Xi et al., 2014; Cao et al., 2021). Different types of molecular data have been used to study the systematic evolutionary relationships between the species of Swertia L. (Chassot et al., 2001; Von Hagen and Kadereit, 2002; Favre et al., 2010; Xi et al., 2014; Cao et al., 2021), all of which have shown that the genus is not monophyletic (Chassot et al., 2001; Von Hagen and Kadereit, 2002; Favre et al., 2010; Xi et al., 2014; Cao et al., 2021). Nevertheless, the systematic relationships within the Swertia L. genus have not been well resolved, and there remains great conflict between many molecular systematics studies and the traditional classification system based on morphological traits (Chassot et al., 2001; Von Hagen and Kadereit, 2002; Favre et al., 2010; Xi et al., 2014; Cao et al., 2021). This conflict has mainly been caused by the low resolution of the chloroplast and its gene fragments. Although there are stark differences in sequence variation between genes, the phylogenetic information provided by one or a few gene segments is limited and phylogenetic trees may reflect only the gene trees of the few segments analyzed. Because gene trees are not always equivalent to species trees, they may not represent the true phylogenetic relationships between species. Molecular fragments are an important source of the traits displayed by specific taxa. Although they can provide significant information for the systematic reconstruction of taxa, they cannot truly reflect the real historical evolution of the taxa. Therefore, new techniques have been needed to evaluate the genetic relationships between Swertia L. species. At present, molecular markers such as nrDNA, chloroplast DNA, mitochondrial DNA, ISSR, and RAPD were widely used in phylogenetic studies (Hakki et al., 2010; Pikunova et al., 2012; Adams and Schwarzbach, 2013; Liu et al., 2020; Kousteni et al., 2021). Also, RAPD and ISSR were used to access the genetic diversity in Swertia L. (Neupane et al., 2017; Chhipi Shrestha et al., 2013). However, as a dominant marker, RAPD and ISSR cannot effectively distinguish heterozygous and homozygous genotypes, so the results are not very reliable when used to study the relationship between species or related genera. In recent years, a comparative analysis of the complete chloroplast genomes of different related species has become a promising method for the study of phylogeny, population dynamics, and species evolution.
Chloroplasts are the descendants of ancient bacteria (early plants and cyanobacteria) and are important organelles for photosynthesis in plants. Thus, they confer on plants the role of producers in the ecological environments of the Earth. Chloroplasts, which are responsible for many metabolic tasks in addition to photosynthesis, are therefore extremely important and energetic organelles in plant cells (Brunkard et al., 2015). Compared with nuclear genomes, chloroplast genomes have the following advantages for a phylogenetic analysis. First, chloroplast genomes have high copy numbers and relatively small complete sequencing sizes, making them suitable for analyzing the evolutionary relationships of plants (McNeal et al., 2006). Second, chloroplasts have a quadripartite structure with 100–130 genes, all of which have highly conserved sequences and competition, making these genomes more conducive to comparison and analysis of evolution and kinship between species (Wicke et al., 2011). Due to its low replacement rate, lack of nucleotide recombination, and uniparental DNA sequence, the chloroplast genome is a key data source for inferring plant phylogeny (Shaw et al., 2005; Chen and Liu, 2008). In recent years, complete chloroplast genomes have been widely used in phylogenetic and genetic relationship analyses of plants, allowing researchers to directly assess the evolutionary relationships between plants (Yang et al., 2016). For example, Yang et al. (2019) reconstructed phylogenetic trees based on whole-genome chloroplast data from 34 Vitis genera and found results consistent with the traditional classification.
In this study, an Illumina HiSeq sequencing platform was used to obtain the whole chloroplast genome sequences of four species in the genus Swertia L: S. tetraptera, S. franchetian, S. przewalskii, and S. bifolia. Based on the statistics listed in the National Center for Biotechnology Information (NCBI) database, we found that the chloroplast genomes of 23 species in Swertia L., including the four used in this study, have been published. However, most studies on Swertia L. have been limited to the publication of single chloroplast genomes, and there have been no systematic analyses of gene structure variations and phylogenetic relationships. Therefore, to obtain a comprehensive and deep understanding of the evolutionary relationships of Swertia L. species, all 23 chloroplast genomes were used in this study. The main scientific questions addressed in this study are as follows: 1) How are chloroplast genomes structured and how do they vary across species of Swertia L.? 2) What is the phylogenetic relationship between species of Swertia L.?
Materials and methods
Plant materials
In total, 23 species of Swertia L. were selected, four of which were sequenced using Illumina sequencing; the remaining 19 sequences were obtained from GenBank. Fresh young leaves of S. tetraptera, S. franchetian, S. przewalskii, and S. bifolia were sampled from Mengyuan county (101.32′ E, 37.62′N, 3,208 m), Huangzhong county (101.63′ E, 36.57′N, 2,510 m), Qilian county (99.61′E, 38.83′N, 3,234 m), and Qilian county (102.22′E, 37.45′N, 3,135 m), respectively, all in the Qinghai province of China. Voucher specimens were deposited in the QTPMB (Qinghai–Tibetan Plateau Museum of Biology) with the voucher numbers QHGC-2011, QHGC20190821, QHGC-2013, and QHGC-2014, respectively. The leaves were dried and preserved in a silica gel.
Genomic DNA extraction and sequencing
The improved cetyltrimethylammonium bromide method was used to extract the total DNA of Swertia L. plants (Doyle, 1991). Agarose gel electrophoresis and a NanoDrop 2000 microspectrophotometer were used to measure the purity and concentration of the DNA. After Illumina PE library was constructed, high-throughput sequencing was completed by Beijing Biomarker Technologies Co., Ltd. Moreover, 150bp paired-end sequencing was performed using Illumina HiSeq (TM) 2000. Raw sequencing data were transformed into sequenced reads (raw data) by performing a base calling analysis of the raw image files. Raw reads data obtained by sequencing were filtered using ngSQCToolkit_v2.3.3 software (Patel and Jain, 2012) to remove low-quality regions and obtain clean reads. The results were then stored in the FASTQ format.
Assembly, annotation, and sequence analyses
Chloroplast genome assembly was performed using the iterative organelle genome assembly pipeline (Bakker et al., 2016). The chloroplast genome of S. mussotii (NC_031155) was used as the reference sequence. SPAdes v3.6.1 software was used for ab novo splicing under default parameters and to generate a series of contigs (Prjibelski et al., 2020). Contigs larger than 1,000 bp were used for chloroplast genome assembly. Complete chloroplast genome sequences were constructed by matching and linking contigs (Kearse et al., 2012) and filling the gaps after assembly using second-generation sequencing technology.
The plastid genome annotator tool was used for the functional annotation of Swertia L. chloroplast genomes; the start codon, stop codon, and other problematic sites in the annotation result were adjusted manually (Qu et al., 2019; Tian et al., 2021). The annotated chloroplast genome data were exported in Gb format, and the chloroplast genome maps of the four Swertia L. species were drawn using OGDRAW (Marc et al., 2013) software. The sequence data and gene annotation information were then uploaded to the NCBI database. The GenBank accession numbers were NC_056357 (S.franchetiana), ON164641 (S.tetraptera), ON017794 (S.przewalskii), and ON018645 (S.bifolia).
We used CodonW1.4.2 software to confirm the relative synonymous codon usage (RSCU) and amino acid usage frequency.
Genome comparison analysis
The chloroplast DNA rearrangement analyses of the 23 Swertia L. species were carried out using Mauve alignment (Darling et al., 2004). To show interspecific variation, after annotating the files using Python 3.10.1, the chloroplast genomes of another 22 species of Swertia L. were compared using the online software mVISTA (Frazer et al., 2004) and S. wolfgangiana as a reference genome. Variations were detected using the Shuffle-LAGAN model. The percentages of variable characters in the coding and non-coding regions were calculated using the method developed by Zhang et al. (2011). IRscope software (Amiryousefi et al., 2018) was used to visually analyze the contraction and expansion of the four boundaries of the 23 species of Swertia L.
Identification of repeat sequences and simple sequence repeats
The online software REPuter (Kurtz et al., 2001) was used to detect repeats in the chloroplast genome, such as forward (F), reverse (R), complementary (C), and palindromic (P). The minimum repetition was set to 30 bp and minimum repetition sequence length distance to 3. In addition, the online program Tandem Repeats Finder was used to detect tandem repeats (Benson, 1999). MISA software (https://pgrc.ipk-gatersleben.de/misa/) was used to predict simple sequence repeat (SSR) in chloroplast genome, and the parameters were set as follows: mononucleotide unit repetition number ≥10; dinucleotide unit repetition number ≥5; trinucleotide unit repetition number ≥4; and tetraconucleotide, pentanucleotide, and hexanucleotide unit repetition number ≥3 (Beier et al., 2017).
Phylogenetic analysis
In this study, 23 species were used to construct a phylogenetic tree based on Bayesian inference (BI) (Ronquist and Huelsenbeck, 2003), using Gentianopsis paludosa (NC_050656) as the outgroup. Mafft v7.205 software was used to compare the sequences and remove irregular sequences at both ends (Kazutaka and Standley, 2013). Before building the BI tree, PAUP and MrModeltest were jointly run through MrMTgui. The Akaike information criterion results showed that the best model for BI analysis was GTR + I + G, with a random tree as the starting tree. Starting with four Markov chains, that is, three hot chains and one cold chain, we saved one tree every 100 generations, calculated 9,000,000 generations, discarded the first 25% preheated (Burn-in) trees, and used the remaining trees to calculate the Bayesian posterior probability (PP) of the consistent tree and each branch.
Estimation of the divergence times of Swertia L. Species
Based on the obtained chloroplast genome sequences, the divergence times of Swertia L. species was estimated using the Markov Monte Carlo algorithm (MCMC) molecular sequence Bayesian analysis in BEAST V1.7 (Drummond et al., 2012). First, BEAUti in the software package of BEAST was used to set the parameters of the sequence file in the Nexus format, and the optimal nucleotide substitution model was GTR + I + G, which was selected by MrModeltest. The uncorrelated relaxed clock method was used for the branch lengths with a Gama distribution. Due to the lack of fossil evidence for Swertia L. plants, the time was set at 15 Ma (million years), which was from the published literature (Chassot et al., 2001; Von Hagen and Kadereit, 2002; Cao et al., 2021), and the standard variance was 1.0. After a burn-in of 10,000,000 steps, all of the parameters were collected once every 1,000 steps up to 1,00,000,000 Markov chain Monte Carlo (MCMC) algorithm steps. Then an XML format file was generated. The XML format file was imported to BEAST software. The convergence of the MCMC results was detected by using the Tracer v 1.5 program to check that the chain was balanced; we then used the Tree Annotator v 1.7.5 program to obtain the best tree merging and Figtree v 1.4.4 (Rambaut, 2018) was used to view the resulting tree.
Results and discussion
Comparison of the chloroplast genomes of 23 Swertia L. Species
The chloroplast genome lengths of the Swertia L. species ranged from 149,036 bp to 153,691 bp, with an average length of 152,385 bp (Table 1). S. bimaculata had the longest chloroplast genome, differing from other species in Swertia L by 0.06–4.715 kb. As can be seen from the comparison of chloroplast sections, such differences mainly occurred in the large single-copy (LSC) and IR regions. The chloroplast genome length of angiosperms is generally 115–165 kb and that of Gentianaceae is 137–154 kb, which is consistent with the length characteristics of angiosperms and Gentianaceae (Li et al., 2018; Dong et al., 2020). Compared with other genera of Gentianaceae, the average chloroplast genome length of Swertia L. was similar to that of Halenia (153 kb), but shorter than that of Paedera (154 kb) (Dong et al., 2020). The chloroplast genomes of the Swertia L. species contained two reverse repeats, IRa and IRb, which divided the whole genome into four parts; the remainder comprised LSC and small single-copy (SSC) regions (Figure 1). The chloroplast genomes of the Swertia L. species had the ring tetrad structure typical of angiosperm chloroplast genomes (Palmer, 1985), which made the chloroplast genome highly conserved. The lengths of the LSC regions varied from 80,432 bp to 84,156 bp, with a total GC content of 32.18%–36.35%. The GC content of the SSC region was 31.25%–33.66%, and the total length ranged from 17,887 bp to 18,395 bp. The pair of IRs had a length range of 25,069–25,890 bp and GC content of 42.16%–44.38% (Table 1).
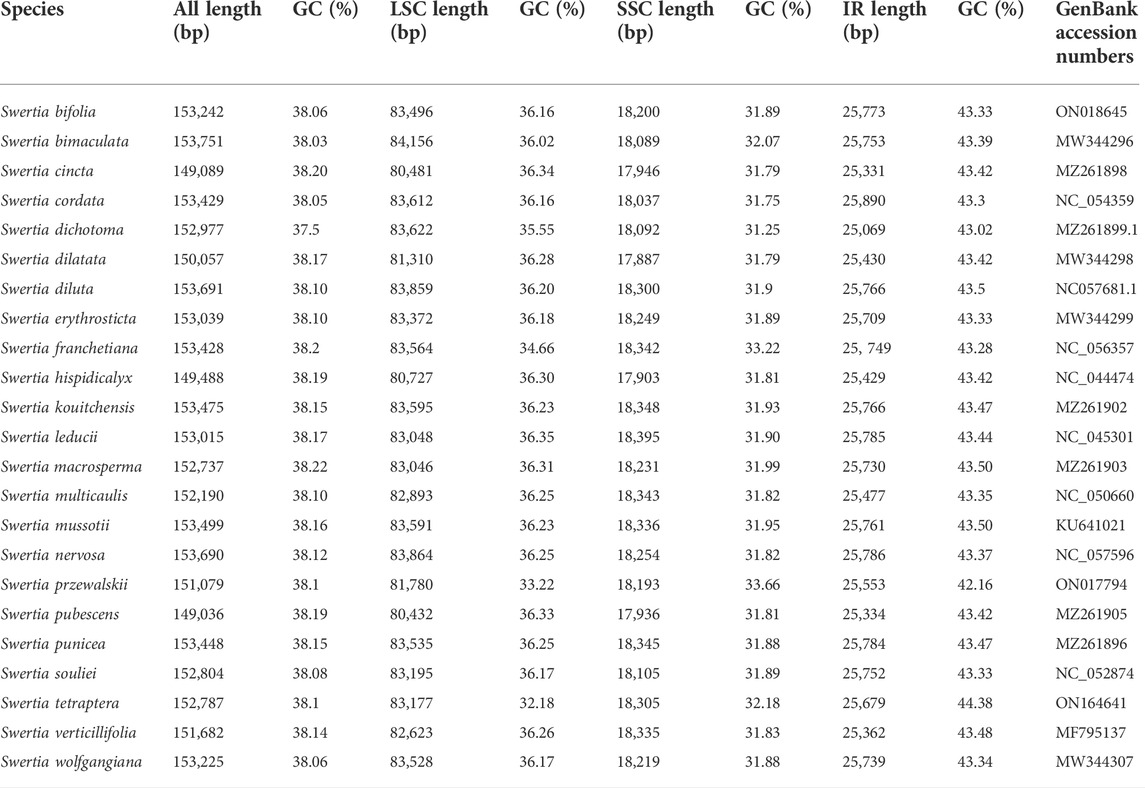
TABLE 1. Complete genome features of Swertia L. species.
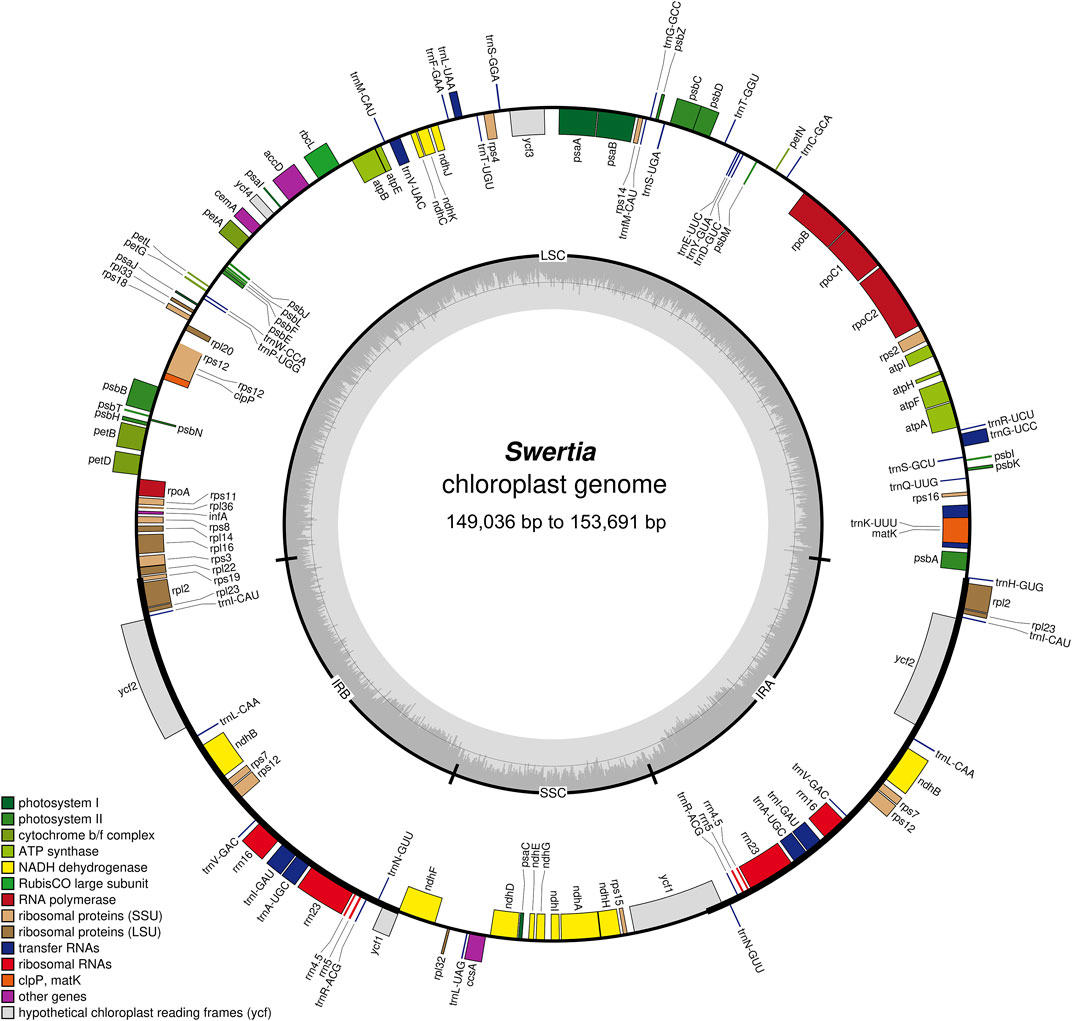
FIGURE 1. Structure and characteristics of the complete chloroplast genomes of 23 Swertia L. species. Genes inside and outside the circle are transcribed clockwise and counterclockwise separately. Darker and lighter grey in the inner circle each represent GC and AT content.
Similar chloroplast DNA GC compositions were found in all of the Swertia L. species (Table 1), demonstrating high species similarity. The IR regions had a higher GC content than the LSC and SSC regions; this has also been reported in other plants (Choi and Park, 2015; Guo et al., 2020). The IR region contained rRNA and tRNA genes, which accounted for the high DNA GC content of this region (Doorduin et al., 2011; Asaf et al., 2017; Shen et al., 2017).
Most of the chloroplast genomes of angiosperms encode 74 proteins, but some genes have been captured, rearranged, and lost across different families, genera, and species (Millen et al., 2001; Kim et al., 2009). The results of our study showed that S. bimaculata, S. cordata, S. diluta, S. erythrosticta, S. franchetian, S. kouitchensis, S. leducii, S. macrosperma, S. mussotii, S. punicea, S. souliei, S. vertickllifolia, and S. wolfgangiana had 133 genes comprising 87 protein-coding genes, 38 tRNA genes, and eight rRNA genes. S. cincta, S. dichotoma, S. nervosa, and S. pubescens lacked the rps16 gene found in the chloroplast genomes of other species of Swertia L. Thus, these four chloroplast genomes consisted of 132 genes. The ycf15 gene in the two reverse repeats was lost in S. przewalskii and S. bifolia, implying that their chloroplast genomes contained 131 genes. Our result was different from the previous result obtained for Gentianaceae (Dong et al., 2020), which showed that the chloroplast genome of Gentianaceae had 67–80 protein-coding genes, 30 tRNA genes, and four rRNA genes. This difference mainly arose due to gene deletion between genera. For example, the loss of ndh genes, including ndhA, ndhC, ndhG, ndhH, ndhI, ndhJ, and ndhK, was common to all Gentianaceae species. In addition, four pseudogenes (ψrps16, ψrps19, ψinfA, and ψycf1) were present in the chloroplast genomes of the Swertia L. species. Previous studies have shown that Gentianaceae plants generally have the same four pseudogenes; our results confirm these previous observations. The ψinfA pseudogene likely appeared due to transfer or loss during species evolution (Millen et al., 2001; Zhou et al., 2016). The appearance of the ψrps19 and ψycf1 pseudogenes is likely due to their location at the boundary of the chloroplast gene region, which experiences a boundary effect (Li et al., 2018). The second missing exon in the ψrps16 pseudogene was first detected in Gentiana macrophyllum (Ni et al., 2016) and in non-parasitic species of the Chrysanthemum branch (APG IV). Since then, the ψrps16 pseudogene has been detected in the chloroplast genomes of several Gentianaceae members, the structures of which are similar across all species.
The functions of the major genes in the chloroplast genomes of Swertia L. were roughly classified into three categories (Table 2): chloroplast self-replication–related genes, photosynthesis-related genes, and other genes (Saski et al., 2005). Genes related to photosynthesis and self-replication accounted for the majority of the chloroplast genome.
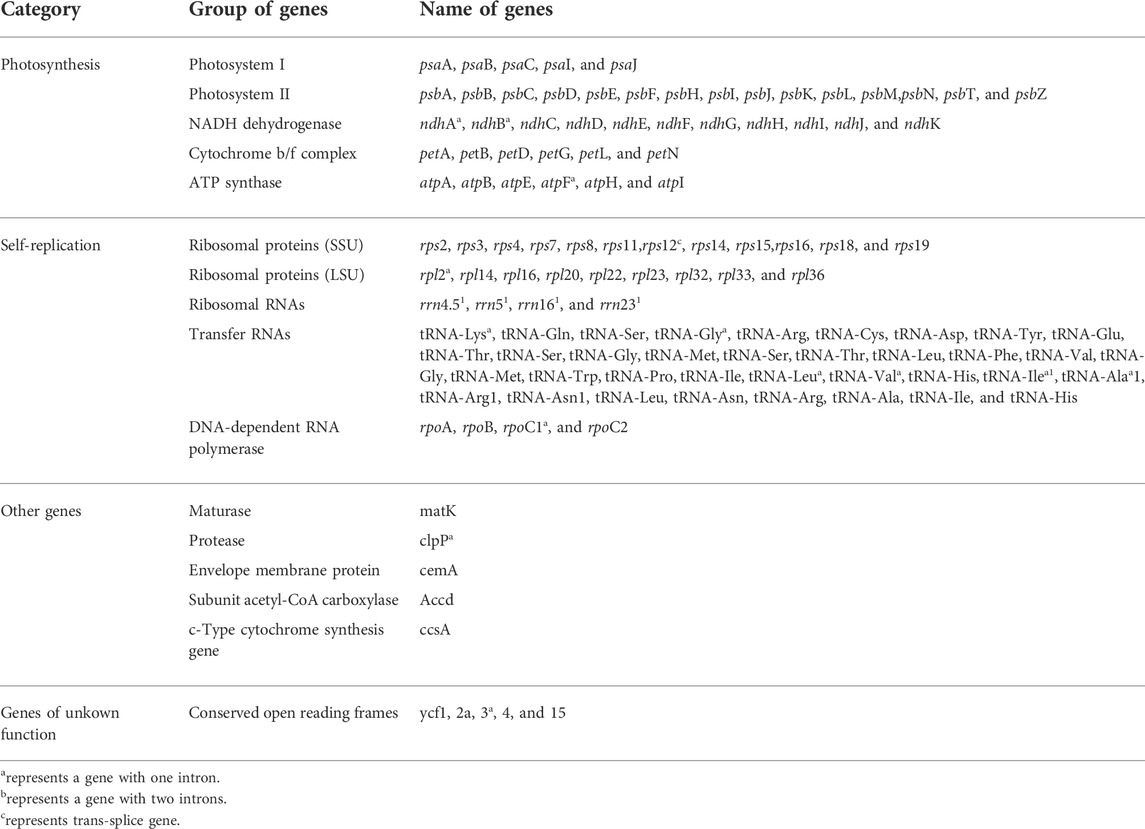
TABLE 2. Gene composition of chloroplast genome of all Swertia L. species.
Further analysis of the chloroplast genes of Swertia L. showed that they were similar to those of other plants and that most did not contain introns (Du et al., 2018; Guo et al., 2020). In this study, only 16 genes (rps12, trnK-UUU, atpF, rpoC1, ycf3, trnL-UAA, trnV-UAC, clpP, petB, petD, rpl16, rpl2, ndhB, trnI-GAU, trnA-UGC, and ndhA) in the chloroplast genomes of Swertia L. contained introns, and all of them contained one intron except for the clpP and ycf3 genes, which had two introns (Table 2). The rps12 gene in the chloroplast genomes of Swertia L. experienced trans-splicing, in which the 3′ end was in the IR region and 5′ end was in the LSC region. This phenomenon has been observed in the majority of other land plants (Du et al., 2018).
The preference of 59 synonymous codons was evaluated using RSCU (Wu et al., 2007). Based on the statistical analysis, the number of codons in the Swertia L. species varied from 49,696 to 512,30. Leucine (Leu; 4,988–5,394 codons), isoleucine (Ile; 3,730–4,277 codons), and phenylalanine (Phe; 3,498–3,641 codons) were the three amino acids with the highest coding rates in the Swertia L. species chloroplast genomes. Only 663–719 codons encoded tryptophan (Trp), which had the lowest coding rate among all of the amino acids (Supplementary Table S1).
Repeat sequences and simple sequence repeats
Repetitive sequences are the main sources of duplication, deletion, and rearrangement in the chloroplast genome (Li and Zheng, 2018). In this study, four kinds of repetitions were counted: forward, palindromic, tandem, and reverse. The results showed that the distributions and numbers of repeats in the 23 chloroplast genomes were similar and conserved (Figure 2; Supplementary Table S2). Tandem units were the most repeated type (605), followed by forward (260), palindromic (209), and reverse repeats (4) (Figure 2C). There were interspecific differences in the tandem repeats, but the ratio of forward to palindromic repeats was about 1:1. Reverse repeats only existed in S. cincta, S. leducii, and S. macrosperma. The lengths of the repeat units were mainly 8–39 bp (Figure 2A). The majority of repetitive sequences were scattered across intergenic or intronic regions, with only a few distributed across gene regions such as ycf3, ycf2, ndhE, psaB, accD, petB, ndhA, psbA, accD, rps18, rps16, psbK, clpP, ycf1, atpH, and rps2 (Supplementary Table S2). S. bimaculata had the most repeat sequences (76) of all the analyzed Swertia L. species, followed by S. leducii (67); S. bifolia had the fewest repeat sequences (34) (Figure 2B).
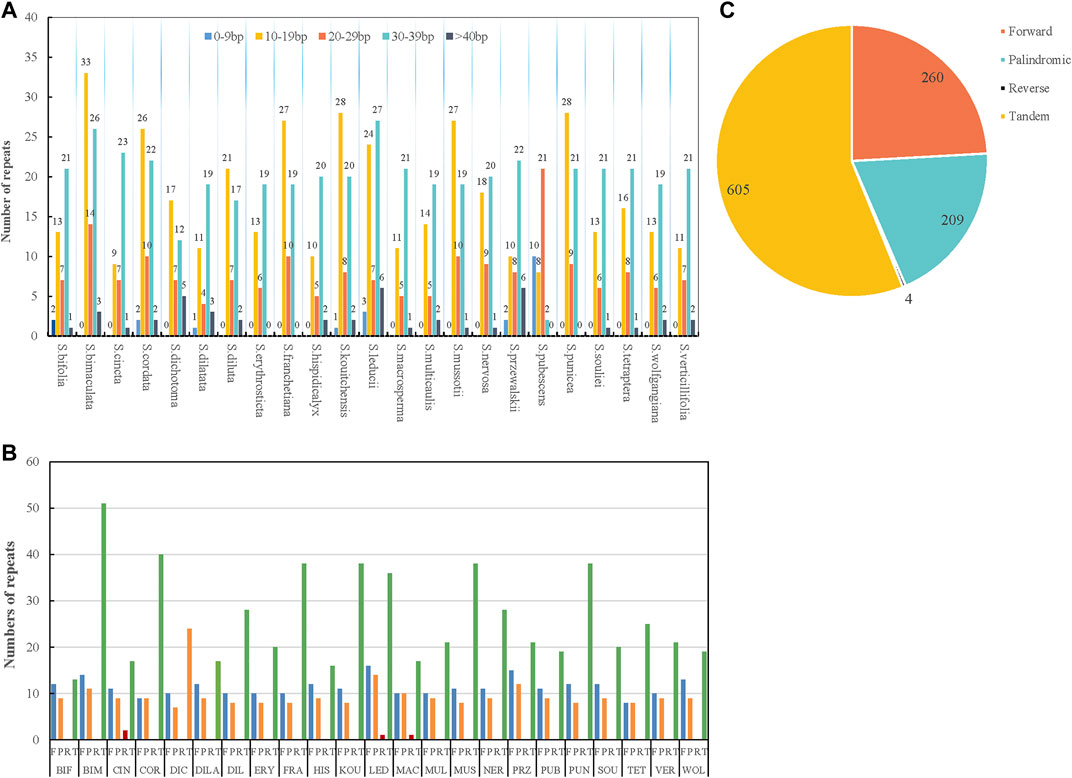
FIGURE 2. Type of repeated sequences in the 23 Swertia L. plastid genomes. (A) Number of repeat sequences by length; (B) number of four repeat types (Note: BIF represents S. bifolia; BIM represents S. bimaculata; CIN represents S. cincta; COR represents S. cordata; DIC represents S. dichotoma; DILA represents S. dilatata; DIL represents S. diluta; ERY represents S. erythrosticta; FRA represents S. franchetiana; HIS represents S. hispidicalyx; KOU represents S. kouitchensis; LED represents S. leducii; MAC represents S. macrosperma; MUL represents S. multicaulis; MUS represents S. mussotii; NER represents S. nervosa; PRZ represents S. przewalskii; PUB represents S. pubescens; PUN represents S. punicea; SOU represents S. souliei; TET represents S. tetraptera; VET represents S. verticillifolia; and WOL represent S. wolfgangiana); (C) pie chart showing the numbers of four repeat types.
As a classical molecular marker, simple repeat sequence (SSR) has been widely used in the analysis of population genetic evolution. We analyzed the simple repeat sequence (SSR) in the chloroplast genomes of 23 species of Swertia L. and the result showed that the numbers of SSR ranged from 35 to 61. S. tetraptera had the most SSRs (61) and S macrosperma had the fewest SSRs (38). Moreover, the numbers and types of mononucleotide, dinucleotide, trinucleotide, tetranucleotide, pentanucleotide, and hexanucleotide repeats were also different in the 23 species of Swertia L. (Figure 3; Supplementary Table S3). Mononucleotides were the most common repeat type. The proportion of mononucleotides in all SSRs ranged from 50.00% to 82.22% in 23 species of Swertia L. This finding is in accordance with the previous observation (Kuang et al., 2011). In total, 70 dinucleotides were detected in 23 species, which were AT/TA, accounting for 3.23%–10.53% of the SSRs. In total, 76 trinucleotides and 133 tetranucleotides were found in the 23 complete cp genomes. A total of 15 pentanucleotides were discovered in chloroplast genes of 23 species in Swertia L. Only S. cordata (2), S. dichotoma (1), S. franchetiana (1), S. mussotii (1), S. nervosa (3), and S. tetraptera (3) had hexanucleotides. In addition, compound SSRs accounted for 2.17%–10.87% of the 23 genomes. The richness of SSRs and the count of SSRs were different within Swertia L. thus these may be helpful molecular marker for species identification. However, adopting SSRs to clarify ecological and evolutionary processes has yet to be fully implemented (Ebert and Peakal, 2009). The results of this study will provide a basis for the study of chloroplast SSR markers in the future and lay a foundation for the study of the genetic relationship and diversity of this genus.
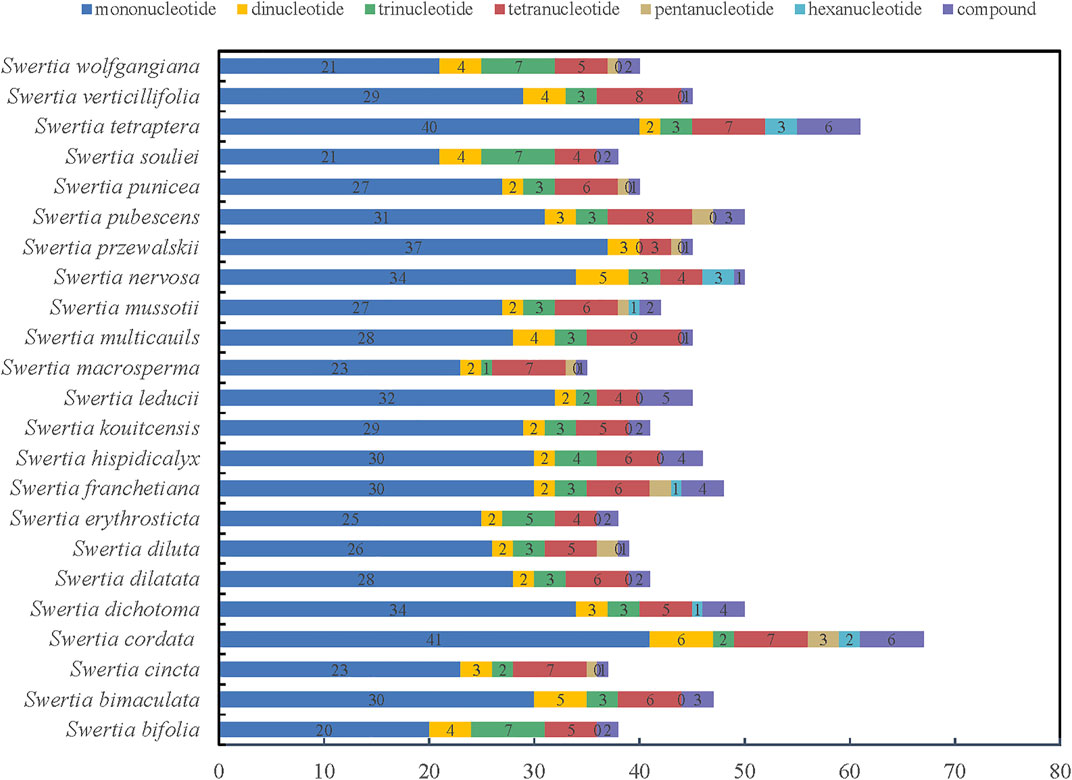
FIGURE 3. Simple sequence repeats (SSRs) in the 23 Swertia L. plastid genomes.
Oligonucleotide repeats are widely found in the plastome (Ahmed et al., 2012, 2013; Abdullah et al., 2021). These repeats have an effect on generating mutations and have been suggested as a proxy for mutational hotspots (Ahmed et al., 2012; Ahmed et al., 2012; Abdullah et al., 2020; Abdullah et al., 2021). Abdullah et al. (2020) proposed that the co-occurrence of repeats with substitutions was up to 90%, whereas 36%–91% co-occurrence was found at the genus level. In the present study, 10 highly polymorphic loci were found. Among these, five loci belong to the regions where repeats are present, including psaA-ycf3 and rps15, which showed the highest incidence of polymorphisms. Here, our findings support the use of repeats as a proxy, and this approach may also be helpful for the identification of suitable polymorphic loci for phylogenetic inference of other taxonomically complex genera. This approach is promising since the plastome of a single species can be used to identify polymorphic regions. Repeated coding regions and IR regions need to be avoided, however, due to the purifying selection pressure of protein-coding genes (Henriquez et al., 2020) and the fact that copy-dependent repair mechanisms (Zhu et al., 2016) lead to low rates of mutation.
Sequence divergence across Swertia L. species
The chloroplast genomes of the 23 Swertia L. species were relatively conserved, with four parts of the genomes being arranged in consistent sequences (Figure 4) and no rearrangement found in gene organization after verification (Figure 5). Moreover, there was a higher degree of variation in non-coding regions than in the coding regions of the chloroplast genome of Swertia L. In the non-coding regions, the percentage of variations ranged from 13.14% to 81.84% (Figure 6B), averaging 49.02%, whereas in coding regions, the percentage of variations ranged from 0.35% to 31.27%, averaging 9.10% (Figure 6A). The SSC region variability of the 23 species in Swertia L. was higher than that of the LSC and IR regions in both coding (7.96%, 2.19%, and 17.16% for LSC, IR, and SSC regions, respectively) and non-coding regions (49.00%, 42.44%, and 54.23% for LSC, IR, and SSC regions, respectively). The degree of variation was lowest in the IR region, indicating a high degree of conservatism. These results were consistent with those obtained for other angiosperms (Dong et al., 2013; Guo et al., 2020). In addition, some genes (rpoC1, ccsA, ndhI, ndhA, and rps15) exhibited higher variability than other genes in the 23 species of Swertia L. Some of the non-coding regions with high sequence divergence were trnH-GUG-psbA, psaA-ycf3, cemA-petA, ycf15-trnL-CAA, and ccsA-ndhD. These genes and hotspot regions can either be used in phylogenetic analyses or serve as potential DNA molecular barcodes (Zhang et al., 2011; Maier et al., 1995; Diekmann et al., 2009).
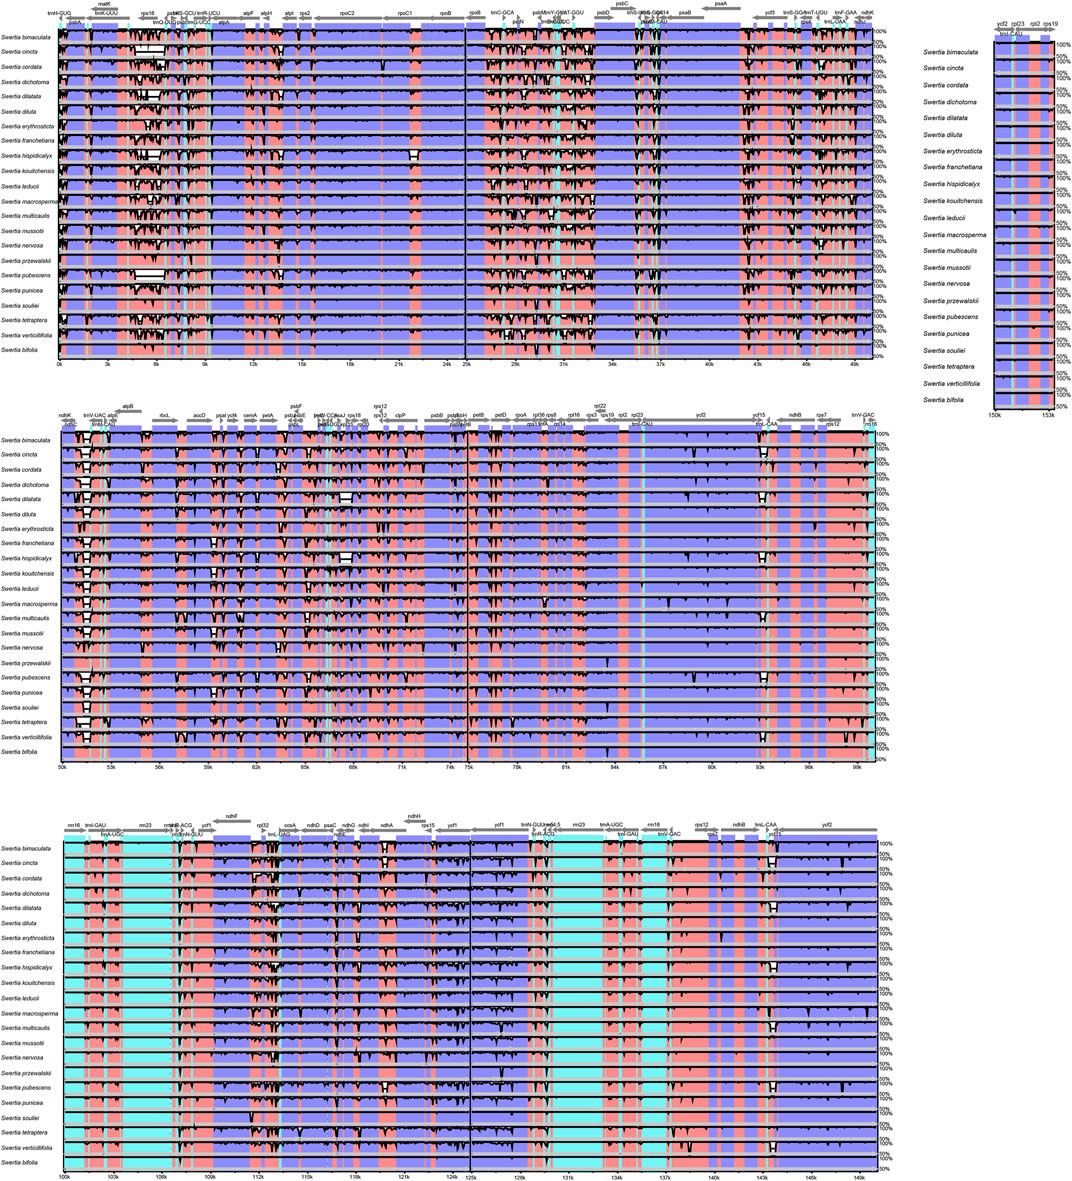
FIGURE 4. Comparison and analysis based on chloroplast genome of 23 Swertia L. species. Orientation of genes was pointed out by arrows up the alignments. Purple, blue, pink, and grey bars correspond to exons, untranslated regions, non-coding sequences, and mRNA, respectively. The Y-axis indicates the genetic similarity percentage. Genetic similarity among 50%–100% were showed in the figure (for interpretation of the references to color in this figure legend, the reader is referred to the web version of this article).
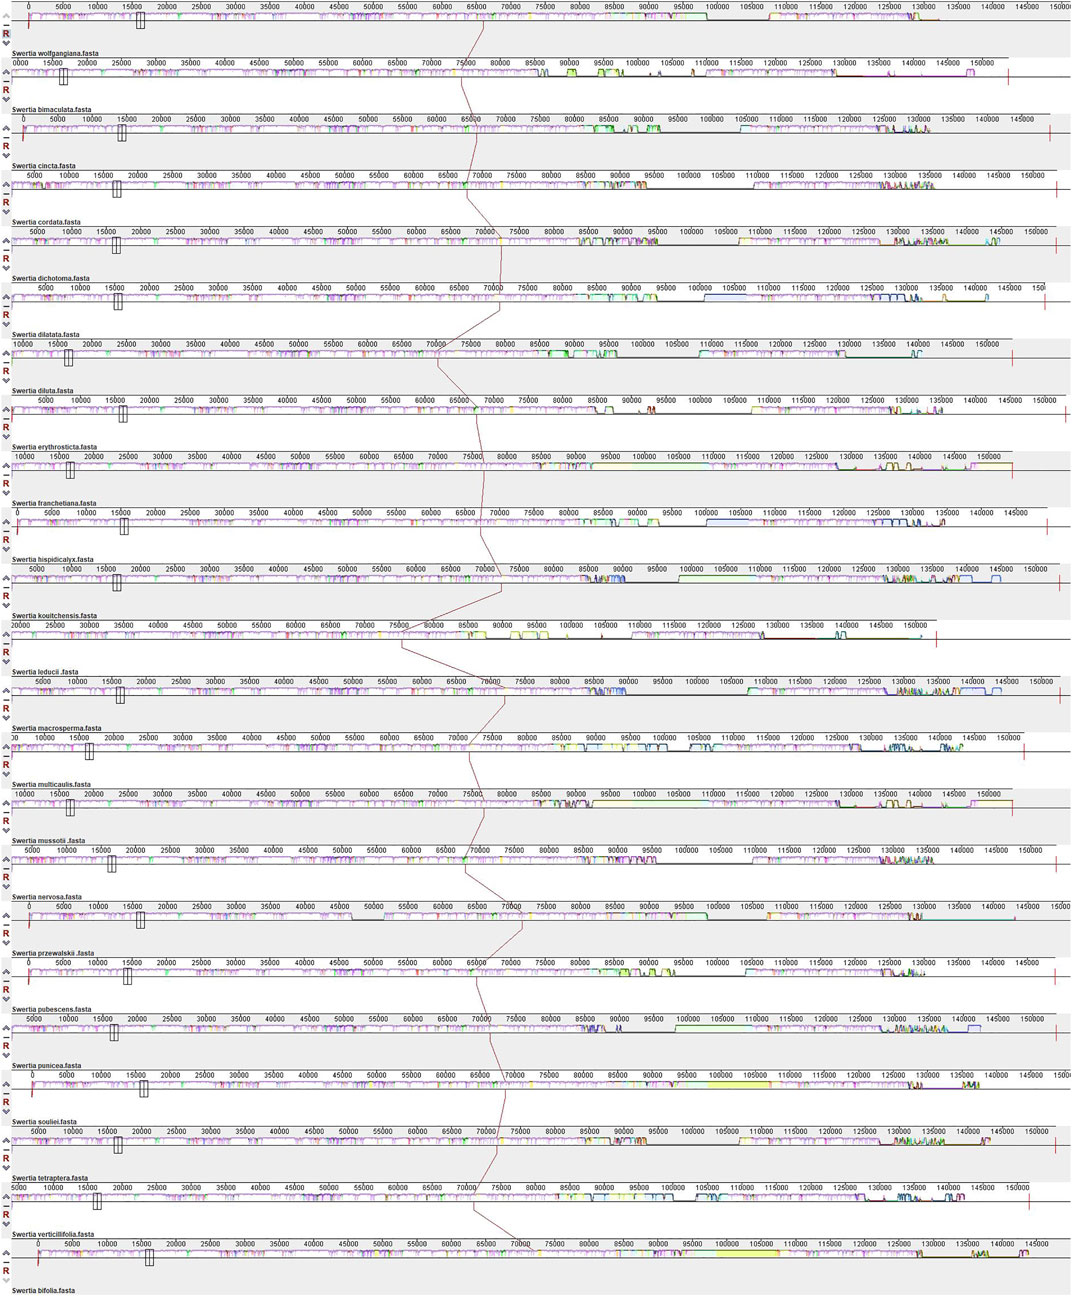
FIGURE 5. MAUVE alignment of 23 Swertia L. species chloroplast genomes. The S. wolfgangiana genome is shown at the top as the reference genome.
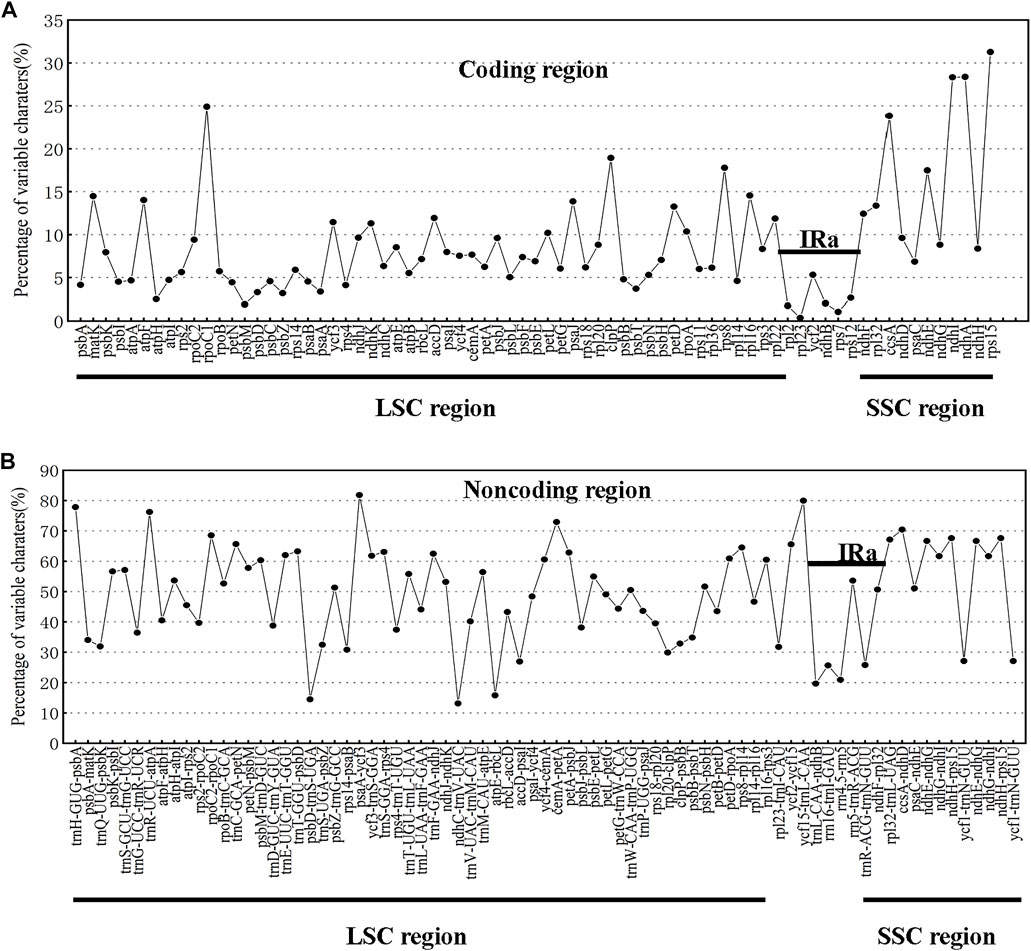
FIGURE 6. Percentages of variable characters in homologous regions among chloroplast genomes of 23 Swertia L. species. (A) Coding region. (B) Non-coding region. The homologous regions are oriented according to their locations in the chloroplast genome.
IR contraction and expansion of the chloroplast genome
The chloroplast genome has two IR regions, which form four boundaries with LSC and SSC regions: IRb-LSC, IRb-SSC, IRa-LSC, and IRa-SSC. When the ancient genome evolved, the IR boundary expanded and contracted, causing some genes to enter IR regions and some to enter the single-copy regions, with different levels of sequence replication at each species boundary. As can be seen from Figure 7, the four boundaries of the chloroplast genomes of the Swertia L. species were relatively well-conserved. The rps19 gene spanning the LSC and IRb regions was present at the IRb-LSC boundary in all 23 Swertia L. chloroplast genomes. This gene was mainly located in the LSC region at the same bases, except in S. cordata (85), S. cinata (118), and S. pubescens (118). The IRa-LSC boundaries in most of the Swertia L. chloroplast genomes occurred between the rps19 pseudogene in the IRa region and the trnH gene in the LSC region; however, the rps19 pseudogene was absent in S. bifolia, S. przewalskii, S. nervosa, and S. multicaulis. The IRb-SSC boundaries in the Swertia L. chloroplast genomes varied greatly. This boundary was located in the overlapping region of the ycf1 pseudogene and ndhF gene in 11 Swertia L. chloroplast genomes, with the IRb-SSC boundary in six Swertia L. chloroplast genomes crossing the overlap region and extending 5–100 bp to the ndhF gene. The ycf1 pseudogene in eight Swertia L. chloroplast genomes was present in the IRb region, along with a terminal from the IRa-SSC border. In addition, the ycf1 pseudogene was lost in the IRb-SSC boundaries of the chloroplast genomes in S. tetraptera, S. nervosa, and S. multicaulis (Figure 6). The IRa-SSC boundary was located in the ycf1 gene in all of the species, but the length of the ycf1 gene fragment in the IRa region differed to some extent and ranged from 988 bp to 1,004 bp. The length of this fragment was about 5,400 bp in most Swertia L. species, except for S. nervosa and S. souliei. The ycf1 gene in the S. nervosa chloroplast genome was present in the SSC region, with a terminal 126 bp from the IRa-SSC border. The total length of the ycf1 gene in the S. souliei chloroplast genome was 1,013 bp, with only 10 bp located in the SSC region. The sliding of the IRa-SSC and IRb-LSC boundaries in the chloroplast genomes of vascular plants generally occurs in different genera or even within the same genus, resulting in large variations in chloroplast genome length across different plants. The IRb-LSC boundaries of the Swertia L. species were largely located within the rps19 gene and, as mentioned earlier, the IRa-LSC boundary was located between the rps19 gene of the IRa region and the trnH gene of the LSC region. However, in monocotyledon plants such as those in the Orchidaceae and Poaceae families, the boundaries are extended and the rps19 and trnH genes are located in the IR regions (Tang et al., 2011; Hu, 2020). Both genes changed from one to two copies, whereas in barley and sorghum, boundary shrinkage occurred, resulting in two copies of the rps19 and trnH gene in the LSC region (Tang et al., 2011). The IRb-SSC boundary was located in the ycf1-ndhF overlap region in 11 Swertia L. species, which is consistent with the observations from many species of cruciferous plants (Li et al., 2017), for example, Aethionema grandiflorum, Arabidopsis thaliana, Barbarea verna, Brassica napus, Cakile arabica and so on. The extension of the IRb-SSC boundary to the ndhF gene due to boundary expansion has also been detected in Arabidopsis thaliana (Tang et al., 2011), in which the IRa-SSC boundary is located in the ycf1 gene. In A. thaliana, the fragment lengths of the ycf1 gene in the SSC and IRa regions are different due to either contraction or expansion of the boundary. In rice, wheat, maize, and other plants, this boundary is located on the ndhH gene, further indicating that the boundary between dicotyledons and monocotyledons is quite different (Melodelima et al., 2013).
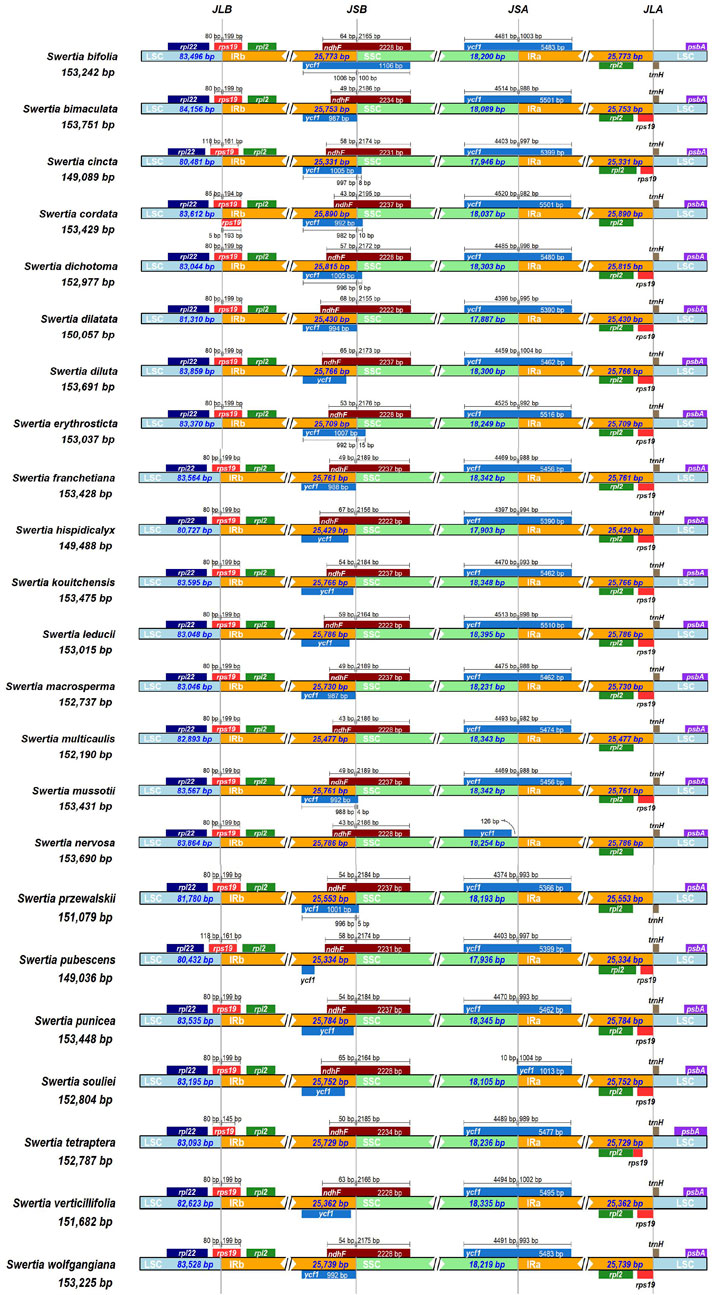
FIGURE 7. Comparative analysis of chloroplast genomic boundaries of the 23 Swertia L. plastid genomes.
People have different views on the mechanism of contraction and expansion of the IR region (Guo et al., 2020). DNA double-strand breaks (DSBs) are currently considered the main molecular mechanism underlying IR expansion. As large contractions in the IR region are rare, the DSB theory may also underlie IR region contraction.
Phylogenetic analysis
The maximum likelihood and Bayesian methods were used to construct phylogenetic trees for the chloroplast genomes of the 23 Swertia L. species. The topological structures of the phylogenetic trees obtained using the two methods were similar (Figure 8). Phylogenetic analysis showed that all 23 species of Swertia L. in conjunction with those of G. paludosa, formed a well-supported clade, indicating that the genus Swertia L. was not monophyletic. This result is supported by previous studies (Chassot et al., 2001; Struwe and Albert, 2002; Von Hagen and Kadereit, 2002; Favre et al., 2010; Xi et al., 2014; Cao et al., 2021). In addition, the well-supported clade was divided into two major clades (A and B), corresponding to the subgen. Swertia (A) and subgen. Ophelia (B).
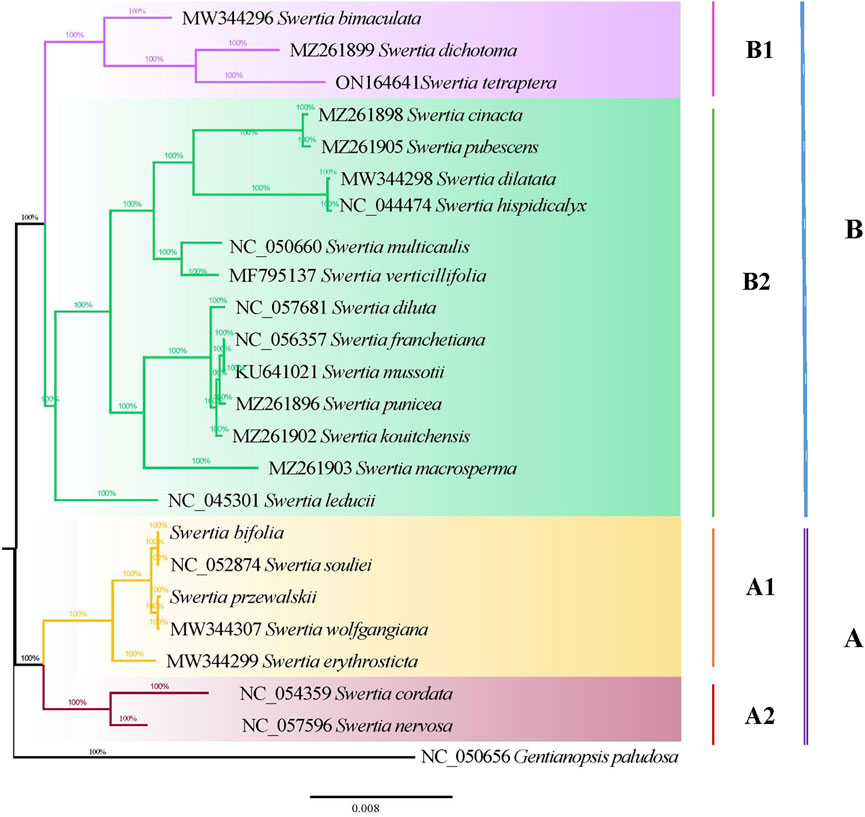
FIGURE 8. Phylogenetic tree of 23 Swertia L. species using Bayesian inference (BI) analyses based on whole chloroplast genomes.
Seven species in Swertia L. were clustered into a subgen. Swertia phylogenetic tree at the base, which showed a close genetic relationship. Ho et al. (1994) believed that this subgenus was a relatively primitive group of Swertia L. consisting of a perennial herb with ancestral traits such as a single stem and unbranched large flowers. Within the same clade, the four species of sect. Swertia (S. souliei, S. bifolia, S. wolfgangiana, and S. erythrosticta) formed a single clade (A1) and two species (S. cordata and S. nervosa) of sect. Ophelia formed another clade (A2). These two were sister branches, further supporting the division of these groups by Ho et al. (1994). Clade B had two branches: B1 and B2 subclades. The B1 subclade contained S. bimaculata, which belonged to sect. Ophelia. This clade also included an S. dichotomy–S. tetraptera branch. S. bimaculata and S. dichotomy–S. tetraptera were sisters. The plants in these two branches were closely related (100 bootstrap), indicating a common ancestor. The B2 subclade contained sect. Ophelia, sect. Platynema, sect. Poephila, and sect. Macranthos. In this subclade, S. leducii was differentiated first and located at the base. Furthermore, two parallel branches were then isolated: sect. Ophelia and sect. Platynema; sect. Poephila and sect. Macranthos. S. multicaulis, from subgen. Poephila, and S. verticillifolia, from sect. Macranthos, were first clustered into a small clade and then into a large clade with the three species of sect. Platynema and one species of sect. Ophelia. This differed from the morphological classification. Sect. Platynema was at the top of the B2 subclade, indicating that it was located in a comparable evolutionary position of the phylogenetic tree of Swertia L. The clustering results partially validated the results obtained by Ho et al. (1994), who showed that sect. Platynema and sect. Kingdon-Wardia (Marq.) were the most evolved groups of the genus and characterized by extremely enlarged filaments at the base, a single glandula in each corolla lobe, and diminished tassels. In the present study, sect. Kingdon-Wardia (Marq.) was not included in the phylogenetic tree, making it impossible to show its systematic position. However, sect. Platynema and sect. Kingdon-Wardia (Marq.) were clustered together and located in the same relative evolutionary branch of Swertia L. in a study by Xi et al. (2014). From what has been discussed before, the division of the two subgenera (subgen. Swertia and subgen. Ophelia) and five sections (sect. Ophelia, sect. Platynema, sect. Poephila, sect. Swertia, and sect. Macranthos) is partially supported by molecular data. However, the systematic positions of other sections and species in Swertia L. derived from molecular data differed from the morphological classification. Inconsistencies between different data types, specifically between morphological and molecular data, remain a major problem of systematics (Lee, 2001). Such inconsistencies have been reported and discussed for many plant and animal groups, such as Rubiaceae, Loganiaceae, Isothecium, and Dendrocolaptinae (Bremer and Struwe, 1992; Irestedt et al., 2004; Draper et al., 2007). Pisani et al. (2007) argued that despite the widespread inconsistencies between morphological and molecular data, both data types were equally important in estimating phylogenetic relationships and that molecular data could not be considered more reliable. The results of this study were roughly equivalent to those of previous studies that used different gene fragments and species to examine the phylogeny of Swertia L. indicating a conflict between the morphological classification system and molecular data, which can be explained from the perspective of evolution. The formation of new species is a slow process, usually occurring over thousands of years. Variations due to natural selection and genetic drift become fixed in a group, driving the formation of new species that eventually differ from two recent common ancestors, that is, species derived from two recent common ancestors, both morphologically discontinuous and reproductively isolated, are monophyletic (Liu, 2016). Driven by the drastic changes in the geology and climate of the Qinghai–Tibetan Plateau, the ancestors of Swertia L. evolved rapidly and showed abundant morphological diversity, such as in the shape and length of the corolla and number and location of nectaries, nectary appendages, and corolla throat appendages. However, this taxon has not accumulated enough sequence variation for a molecular phylogenetic analysis over a relatively short period of time. Moreover, mutations in gene sequences have not been fixed in the population by genetic drift. In addition, the uniparental inheritance of the plastome may also confound phylogenetic inference. Previous studies have shown that the phylogeny based on plastome and mitochondria sequences contradicted with nuclear due to uniparental inheritance of these genomes (Vargas et al., 2017; Abdullah et al., 2021). Therefore, more genetic markers (nuclear) and more taxa of Swertia L will be needed to further explore the phylogenetic relationships in this genus.
Divergence time of Swertia L. Species
Tracer v 1.5 was used to check the analysis values of each parameter, and it was shown that the number of MCMC iterations calculated by BEAST had met the effective sample size (ESS), which was greater than 200. The BEAST analysis was based on the phylogenetic trees of chloroplast genomes of 23 species of Swertia L.(Figure 9), and the numbers at each branch node of the phylogenetic tree were the divergence times (Ma) of the corresponding groups. The result showed that the estimated divergence between Swertia L. and Gentianopsis occurred at 29.60 Ma. We therefore inferred that Swertia L formed at 29.60 Ma, corresponding to the early Miocene of the Tertiary. Meanwhile, the divergence between subgen. Swertia and subgen. Ophelia appeared at 14.69 Ma. In addition, the estimated divergence time in 23 species of Swertia L. was between 12.40 and −0.05 Ma. The formation of S. franchetiana, S. mussotii, S. punicea, S. kouitchensis, S. diluta, S. pubescens, S. cincta, S. dilatata, S. hispidicalyx, S. souliei, S. bifolia, S. wolfgangiana, and S. przewalskii were at 0.05–1.33 Ma (the Quaternary), and S. macrosperma, S. erythrosticta, S. nervosa, S. cordata, S. tetraptera, S. dichotoma, S. bimaculata, S. verticillifolia, S. multicaulis, and S. leducii were formed at 2.72–12.40 Ma (end of Tertiary).
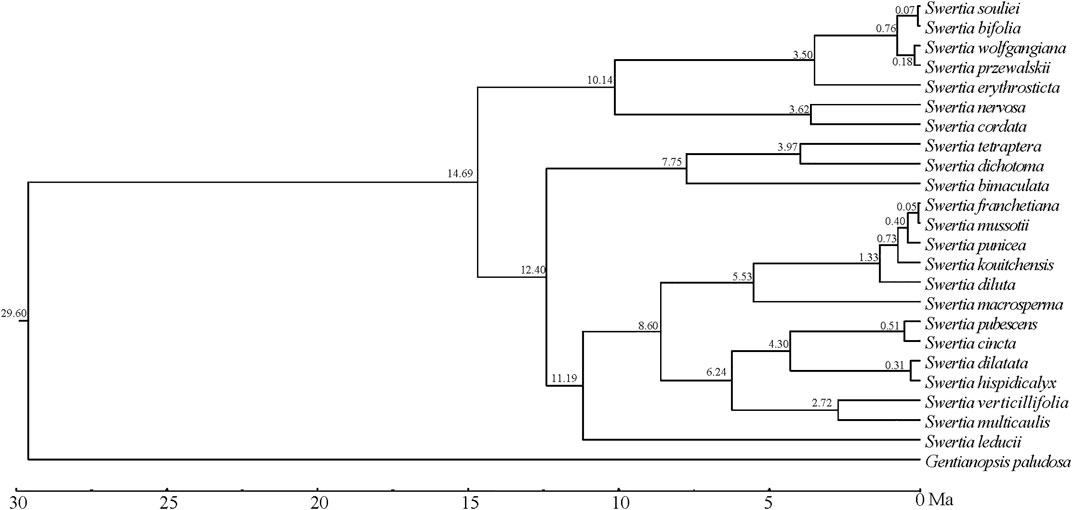
FIGURE 9. Divergence time estimated using BEAST.
In the present study, the formation of Swertia L. was dated back to 29.60 Ma, which was slightly earlier than other studies (Chassot et al., 2001; Von Hagen and Kadereit, 2002; Cao et al., 2021). Geologic evidence demonstrated that the turn of the Oligocene and Miocene was a crucial period of the tectonic evolution of the Qinghai–Tibetan Plateau(QTP), the central part of the QTP rose to a height of nearly 3,000 m in the Early Miocene, the cooling effect made by QTP uplift resulted in the transition of QTP from tropical and subtropical environment to a warm and cool environment consistent with the temperate climate, and the further development of herbaceous plants began in the Early Miocene (Deng et al., 2019). During this period, a primitive group of Swertia L. plants appeared, represented by subgen. Swertia L., which was characterized by perennial herbs, single stems, unbranched, and large but few flowers (Cao et al., 2021).
During the following 20 Ma to 10 Ma period, the QTP was further uplifted, and the Himalayan mountains and Tianshan Mountains were significantly elevated, which strongly changed the atmospheric circulation. Meanwhile, the global temperature decreased from the optimum temperature in the middle Miocene of the third century, resulting in a cool and dry climate (Miao et al., 2012). During this period, Swertia L. plants appeared as annual herbs with strongly branched stems and many small flowers, represented by subgen. Ophelia. The new taxa produced a large number of seeds during their life cycle and thus were better adapted to changing environments (Cao et al., 2021). When the climate was suitable, the new species gave rise to a large number of offspring, which has the potential for a great deal of variation.
Since 10 Ma, the QTP has been further uplifted in the late Miocene and Pliocene periods, and the Himalayas have blocked almost all the warm and wet air masses from the Indian Ocean, and the QTP has become cold and arid. Since 4 Ma, the QTP has been affected by Quaternary glaciation (Li et al., 1999; Mulch et al., 2006). The complex landform and rapidly changing climate resulted in many isolated small populations of Swertia L. which underwent radiation differentiation due to differentiated selection and random factors, forming new species adapted to local environment in a relatively short period of time. This process of radiation differentiation eventually led to the diversity of Swertia L. plants today. In this study, 13 species of the 23 Swertia L. species were formed at Quaternary. This group is the most richly differentiated and most widely adapted in Swertia L. with distribution in both plateau and plain.
Conclusion
The chloroplast genome lengths of 23 species of Swertia L. were between 149,036 bp and 153,691 bp. The chloroplast genomes of Swertia L. contained 134 genes: eight rRNA, 38 tRNA, and 88 protein-coding genes. Introns were found in five tRNA and 11 protein-encoding genes. The chloroplast genomes of the 23 species of Swertia L. contained interspersed repeat sequences and tandem repeat sequences. The IR region variability was significantly inferior to that of the LSC and SSC regions. The majority of the protein-coding genes were comparatively well-conserved, expect for rpoC1, ccsA, ndhI, ndhA, and rps15, which had high variation and could potentially serve as DNA molecular barcodes. The highly differentiated regions were generally located in intergenic regions. Swertia L. was found to not be monophyletic, and the division of subgen. Swertia and subgen. Ophelia was supported by molecular data. However, the molecular data only partly supported the division of sect. Ophelia, sect. Platynema, sect. Poephila, sect. Swertia, and sect. Macranthos. The systematic positions of other groups and species require further investigation. The Swertia L. formed at 29.60 Ma. Speciation of 10 species occurred in succession after 12 Ma and 13 species occurred in succession after 2.5 Ma.
Data availability statement
The datasets presented in this study can be found in online repositories. The names of the repository/repositories and accession number(s) can be found in the article/Supplementary Material.
Author contributions
LY collected the plant materials, did the analysis, and wrote the first manuscript. JL designed the experiment and performed data analysis. GZ contributed to the manuscript revision. All authors read and agreed to the published version of the manuscript.
Funding
This research was funded by the Second Tibetan Plateau Scientific Expedition and Research Program (No. 2019QZKK1003) and Key deployment project of Chinese Academy of Sciences (No. ZDRW-ZS-2020).
Conflict of interest
The authors declare that the research was conducted in the absence of any commercial or financial relationships that could be construed as a potential conflict of interest.
Publisher’s note
All claims expressed in this article are solely those of the authors and do not necessarily represent those of their affiliated organizations, or those of the publisher, the editors, and the reviewers. Any product that may be evaluated in this article, or claim that may be made by its manufacturer, is not guaranteed or endorsed by the publisher.
Supplementary material
The Supplementary Material for this article can be found online at: https://www.frontiersin.org/articles/10.3389/fgene.2022.895146/full#supplementary-material
References
Abdullah, , , Henriquez, C. L., Mehmood, F., Shahzadi, I., Ali, Z., Waheed, M. T., et al. (2020). Comparison of chloroplast genomes among Species of Unisexual and Bisexual clades of the monocot family Araceae. Plants 9, 737. doi:10.3390/plants9060737
Abdullah, , , Mehmood, F., Shahzadi, I., Ali, Z., Islam, M., Naeem, M., et al. (2021). Correlations among oligonucleotide repeats, nucleotide substitutions and insertion-deletion mutations in chloroplast genomes of plant family Malvaceae. J. Syst. Evol. 59, 388–402. doi:10.1111/jse.12585
Adams, R. P., and Schwarzbach, A. E. (2013). Phylogeny of Juniperus using nrDNA and four cpDNA regions. Phytologia 95 (2), 179–187.
Ahmed, I., Biggs, P. J., Matthews, P. J., Collins, L. J., Hendy, M. D., Lockhart, P. J., et al. (2012). Mutational dynamics of aroid chloroplast genomes. Genome Biol. Evol. 4, 1316–1323. doi:10.1093/gbe/evs110
Ahmed, I., Matthews, P. J., Biggs, P. J., Naeem, M., Mclenachan, P. A., Lockhart, P. J., et al. (2013). Identification of chloroplast genome loci suitable for high-resolution phylogeographic studies of Colocasia esculenta (L.) Schott (Araceae) and closely related taxa. Mol. Ecol. Resour. 13, 929–937. doi:10.1111/1755-0998.12128
Amiryousefi, A., Hyvönen, J., and Poczai, P. (2018). IRscope: An online program to visualize the junction sites of chloroplast genomes. Bioinformatics 34 (17), 3030–3031. doi:10.1093/bioinformatics/bty220
Asaf, S., Khan, A. L., Khan, M. A., Waqas, M., Kang, S. M., Yun, B.-W., et al. (2017). Chloroplast genomes of Arabidopsis halleri ssp. gemmifera and Arabidopsis lyrata ssp. petraea: Structures and comparative analysis. Sci. Rep. 7, 7556. doi:10.1038/s41598-017-07891-5
Bakker, F. T., Lei, D., Yu, J. Y., Mohammadin, S., Wei, Z., van de Kerke, S., et al. (2016). Herbarium genomics: Plastome sequence assembly from a range of herbarium specimens using an iterative organelle genome assembly pipeline. Biol. J. Linn. Soc. 117, 33–43. doi:10.1111/bij.12642
Benson, G. (1999). Tandem repeats finder: A program to analyze DNA sequences. Nucleic Acids Res. 27, 573–580. doi:10.1093/nar/27.2.573
Bremer, B., and Struwe, L. (1992). Phylogeny of the Rubiaceae and the Loganiaceae: Congruence of conflict between morphological and molecular data? Am. J. Bot. 79 (10), 1171–1184. doi:10.1002/j.1537-2197.1992.tb13714.x
Brunkard, J. O., Runkel, A. M., and Zambryski, P. C. (2015). Chloroplasts extend stromules independently and in response to internal redox signals. Proc. Natl. Acad. Sci. U. S. A. 112, 10044–10049. doi:10.1073/pnas.1511570112
Cao, Q., Xu, L. H., Wang, J. L., Zhang, F. Q., and Chen, S. L. (2021). Molecular phylogeny of subtribe swertiinae. Bull. Bot. Res. 41 (3), 408–418.
Chassot, P., Nemomissa, S., Yuan, Y. M., and Kupfer, P. (2001). High paraphyly of Swertia L. (Gentianaceae) in the Gentianella-lineage as revealed by nuclear and chloroplast DNA sequence variation. Plant Syst. Evol. 229 (1-2), 1–21. doi:10.1007/s006060170015
Chen, J. C., Wan, D. R., and Nanbo, H. X. (1999). Ethnic and folk medicine arrangement of Swertia. Chin. J. Ethnomed. Ethnopharm. 2, 98–101.
Chen, X., and Liu, C. (2008). Progress in chloroplast genome analysis. Adv. Biochem. Biophysics 35, 21–28.
Choi, K. S., and Park, S. (2015). The complete chloroplast genome sequence of Aster spathulifolius (Asteraceae) genomic features and relationship with Asteraceae. Gene 572 (2), 214–221. doi:10.1016/j.gene.2015.07.020
Darling, A. C., Mau, B., Blattner, F. R., and Perna, N. T. (2004). Mauve: Multiple alignment of conserved genomic sequence with rearrangements. Genome Res. 14, 1394–1403. doi:10.1101/gr.2289704
Deng, T., Wu, F. X., Wang, S. Q., Su, T., and Zhou, Z. K. (2019). Significant shift in the terrestrial ecosystem at the Paleogene/Neogene boundary in the Tibetan Plateau. Chin. Sci. Bull. 64 (27), 2894–2906. doi:10.1360/tb-2019-0053
Dong, B. R., Zhao, Z. L., Ni, L. H., Wu, J. R., and Danzhen, Z. G. (2020). Comparative analysis of complete chloroplast genome sequences within Gentianaceae and significance of identifying species. Chin. Tradit. Herb. Drugs. 51 (6), 1641–1649.
Dong, W. P., Xu, C., Cheng, T., Lin, K., and Zhou, S. L. (2013). Sequencing angiosperm plastid genomes made easy: A complete set of universal primers and a case study on the phylogeny of saxifragales. Genome Biol. Evol. 5, 989–997. doi:10.1093/gbe/evt063
Doorduin, L., Gravendeel, B., Lammers, Y., Ariyurek, Y., Chinawoeng, T., Vrieling, K., et al. (2011). The complete chloroplast genome of 17 individuals of pest species jacobaea vulgaris: SNPs, microsatellites and barcoding markers for population and phylogenetic studies. DNA Res. 18 (2), 93–105. doi:10.1093/dnares/dsr002
Doyle, J. (1991). “DNA protocols for plants-CTAB total DNA isolation,” in Molecular techniques in taxonomy. Editors G. M. Hewitt, and A. Johnston (Berlin: Springer).
Draper, I., Hedenäs, L., and Grimm, G. W. (2007). Molecular and morphological incongruence in European species of Isothecium (Bryophyta). Mol. Phylogenet. Evol. 42 (3), 700–716. doi:10.1016/j.ympev.2006.09.021
Drummond, A. J., Suchard, M. A., Xie, D., and Rambaut, A. (2012). Bayesian phylogenetics with BEAUti and the BEAST 1.7. Mol. Biol. Evol. 29 (8), 1969–1973. doi:10.1093/molbev/mss075
Du, J. J., Zuo, L. H., Liu, Y. C., Yu, X. Y., Dong, Y., Wang, J. M., et al. (2018). Chloroplast genome and CP-SSR site analyses of Ulmus laciniata. J. Plant Genet. Res. 19 (6), 1187–1196.
Ebert, D., and Peakal, R. (2009). Chloroplast simple sequence repeats (cpSSRs): Technical resources and recommendations for expanding cpSSR discovery and applications to a wide array of plant species. Mol. Ecol. Resour. 9, 673–690. doi:10.1111/j.1755-0998.2008.02319.x
Favre, A., Yuan, Y. M., Küpfer, P., and Alvarez, N. (2010). Phylogeny of subtribe Gentianinae (Gentianaceae): Biogeographic inferences despite limitations in temporal calibration points. Taxon 59 (6), 1701–1711. doi:10.1002/tax.596005
Frazer, K. A., Pachter, L., Poliakov, A., Rubin, E. M., and Dubchak, I. (2004). Vista: Computational tools for comparative genomics. Nucleic Acids Res. 32 (Suppl. 2), W273–W279. doi:10.1093/nar/gkh458
Guo, L. L., Guo, S., Xu, J., He, L. X., Carlsond, J. E., Hou, X. G., et al. (2020). Phylogenetic analysis based on chloroplast genome uncover evolutionary relationship of all the nine species and six cultivars of tree peony. Ind. Crops Prod. 153, 112567. doi:10.1016/j.indcrop.2020.112567
Hakki, E. E., Dogan, B., Duran, A., Martin, E., and Dinc, M. (2010). Phylogenetic relationship analysis of Genista L. (Fabaceae) species from Turkey as revealed by inter-simple sequence repeat amplification. Afr. J. Biotechnol. 9 (18), 2627–2632.
Henriquez, C. L., Abdullah, , , Ahmed, I., Carlsen, M. M., Zuluaga, A., Croat, T. B., et al. (2020). Molecular evolution of chloroplast genomes in Monsteroideae (Araceae). Planta 251, 72. doi:10.1007/s00425-020-03365-7
Ho, T. N., and Liu, S. W. (2015). A worldwide monograph of Swertia and its allies. Beijing: Science Press, 1–4.
Ho, T. N., Xue, C. Y., and Wang, W. (1994). The origin, dispersal and formation of the distribution pattern of Swertia L. (Gentianaceae). Acta Phytotaxon. Sin. 32 (6), 525–537.
Hu, G. J. (2020). The complete chloroplast genomes of paphiopedilum and cymbidium (Orchidaceae) species: Comparative genomic and phylogenetic analyses. Master´s Dissertation (Xian, Shanxi, China: Northwest university).
Irestedt, M., Fjeldsa, J., and Ericson, P. G. P. (2004). Phylogenetic relationships of woodcreepers (Aves: Dendrocolaptinae)-/incongruence between molecular and morphological data. J. Avian Biol. 35 (3), 280–288. doi:10.1111/j.0908-8857.2004.03234.x
Kazutaka, K., and Standley, D. M. (2013). MAFFT multiple sequence alignment software version 7: Improvements in performance and usability. Mol. Biol. Evol. 30 (4), 772–780. doi:10.1093/molbev/mst010
Kearse, M., Moir, R., Wilson, A., Stones-Havas, S., Cheung, M., Sturrock, S., et al. (2012). Geneious Basic: An integrated and extendable desktop software platform for the organization and analysis of sequence data. Bioinformatics 28 (12), 1647–1649. doi:10.1093/bioinformatics/bts199
Kim, Y. K., Park, C. W., and Kim, K. J. (2009). Complete chloroplast DNA sequence from a Korean endemic genus, Megaleranthis saniculifolia, and its evolutionary implications. Mol. Cells 27, 365–381. doi:10.1007/s10059-009-0047-6
Kousteni, V., Mazzoleni, S., Vasileiadou, K., and Rovatsos, M. (2021). Complete mitochondrial DNA genome of nine species of sharks and rays and their phylogenetic placement among modern elasmobranchs. Genes. 12 (3), 324. doi:10.3390/genes12030324
Kuang, D. Y., Wu, H., Wang, Y. L., Gao, L. M., Zhang, S. Z., Lu, L., et al. (2011). Complete chloroplast genome sequence of Magnolia kwangsiensis (magnoliaceae): Implication for DNA barcoding and population genetics. Genome 54 (8), 663–673. doi:10.1139/g11-026
Kurtz, S., Choudhuri, J. V., Ohlebusch, E., Schleiermacher, C., Stoye, J., Giegerich, R., et al. (2001). REPuter: The manifold applications of repeat analysis on a genomic scale. Nucleic Acids Res. 29, 4633–4642. doi:10.1093/nar/29.22.4633
Lee, M. S. Y. (2001). Uninformative characters and apparent conflict between molecules and morphology. Mol. Biol. Evol. 18 (4), 676–680. doi:10.1093/oxfordjournals.molbev.a003848
Li, D. M., Xiao, H., and Liu, G. M. (2007). Advances in studies on chemical compositions and their pharmacological effect in the plants of Swertia. J. Dali Univ. 6 (2), 77–80.
Li, J. J., and Fang, X. M. (1999). Uplift of the Tibetan Plateau and environmental changes. Chin. Sci. Bull. 44 (3), 2117–2124. doi:10.1007/bf03182692
Li, X., Li, Y., Zang, M. Y., Li, M. Z., and Fang, Y. M. (2018). Complete chloroplast genome sequence and phylogenetic analysis of Quercus acutissia. Int. J. Mol. Sci. 19 (8), 1–17.
Li, Y., Lü, G. H., Zhang, X. N., and He, X. M. (2017). Chloroplast genome structure and variation analysis of Brassicaceae species. Acta Bot. boreal.-occident. Sin. 37 (6), 1090–1101.
Liang, Q. S., and Gao, X. Y. (1979). Study on anti-hepatitis flavone constituents of Swertia mileensis. Chin. Herb. Med. 9, 1–4.
Liu, J. Q. (2016). The integrative species concept” and “specieson the speciation way”. Biodivers. Sci. 24 (9), 1004–1008. doi:10.17520/biods.2016222
Liu, Q., Li, X. Y., Li, M. Z., Xu, W. K., Schwarzacher, T., Heslop-Harrison, J. S., et al. (2020). Comparative chloroplast genome analyses of avena: Insights into evolutionary dynamics and phylogeny. BMC Plant Biol. 20, 406. doi:10.1186/s12870-020-02621-y
Ma, L. N., Tian, C. W., and Zhang, T. J. (2008). Advances in study on iridoids in plant of Swertia L. and their pharmacological activity. Chin. Tradit. Herb. Drugs. 39, 790–795.
Maier, R. M., Neckermann, K., Igloi, G. L., and Kössel, H. (1995). Complete sequence of the maize chloroplast genome: Gene content, hotspots of divergence and fine tuning of genetic information by transcript editing. J. Mol. Biol. 251, 614–628. doi:10.1006/jmbi.1995.0460
Marc, L., Oliver, D., Sabine, K., and Ralph, B. (2013). OrganellarGenomeDRAW-a suite of tools for generating physical maps of plastid and mitochondrial genomes and visualizing expression data sets. Nucleic Acids Res. 41, 575–581. doi:10.1093/nar/gkt289
Melodelima, C., and Lobreaux, S. (2013). Complete Arabis alpina chloroplast genome sequence and insight into its polymorphism. Meta Gene 1, 65–75. doi:10.1016/j.mgene.2013.10.004
Miao, Y. F., Herrmann, M., Wu, F. L., Xian, X. L., and Yang, S. L. (2012). What controlled mid-late Miocene long-term aridification in central Asia? Global cooling or Tibetan plateau uplift: A review. Earth. Sci. Rev. 112 (3-4), 155–172. doi:10.1016/j.earscirev.2012.02.003
Millen, R. S., Olmstead, R. G., Adams, K. L., Palmer, J. D., Lao, N. T., Heggie, L., et al. (2001). Many parallel losses of infA from chloroplast DNA during angiosperm evolution with multiple independent transfers to the nucleus. Plant Cell. 13, 645–658. doi:10.1105/tpc.13.3.645
Mulch, A., and Chamberlain, C. P. (2006). Earth science: The rise and growth of tibet. Nature 439 (7077), 670–671. doi:10.1038/439670a
Ni, L. H., Zhao, Z. L., Xu, H. X., Chen, S. L., and Dorje, G. (2016). Chloroplast genome structures in Gentiana (Gentianaceae), based on three medicinal alpine plants used in Tibetan herbal medicine. Curr. Genet. 63 (2), 241–252. doi:10.1007/s00294-016-0631-1
Palmer, J. D. (1985). Comparative organization of chloroplast genomes. Annu. Rev. Genet. 19, 325–354. doi:10.1146/annurev.ge.19.120185.001545
Patel, R. K., and Jain, M. (2012). NGS qc toolkit: A toolkit for quality control of next generation sequencing data. PLoS One 7, e30619. doi:10.1371/journal.pone.0030619
Pikunova, A. V., Martirosian, E. V., Kniazev, S. D., and Ryzhova, N. N. (2012). Application of the RAPD-analysis for the study of genetic polymorphism and phylogenetic relationships in the Ribes L. genus. Russ. J. Genet. Appl. Res. 2, 141–151. doi:10.1134/s2079059712020098
Pisani, D., Benton, M. J., and Wilkinson, M. (2007). Congruence of morphological and molecular phylogenies. Acta Biotheor. 55 (3), 269–281. doi:10.1007/s10441-007-9015-8
Prjibelski, A., Antipov, D., Meleshko, D., Lapidus, A., and Korobeynikov, A. (2020). Using SPAdes de novo assembler. Curr. Protoc. Bioinforma. 70 (1), e102. doi:10.1002/cpbi.102
Qu, X. J., Moore, M. J., Li, D. Z., and Yi, T. S. (2019). PGA: A software package for rapid, accurate, and flexible batch annotation of plastomes. Plant Methods 15, 50. doi:10.1186/s13007-019-0435-7
Rambaut, A. (2018). FigTree v.1.4.4. Available at: http://tree.bio.ed.ac.uk/software/figtree/(Accessed October 25, 2020).
Ronquist, F., and Huelsenbeck, J. P. (2003). MRBAYES 3: Bayesian phylogeneticinference under mixed models. Bioinformatics 19, 1572–1574. doi:10.1093/bioinformatics/btg180
Saski, C., Lee, S., Daniell, H., Wood, T., Tomkins, J., Kim, H. G., et al. (2005). Complete chloroplast genome sequence of Gycine max and comparative analyses with other legume genomes. Plant Mol. Biol. 59 (2), 309–322. doi:10.1007/s11103-005-8882-0
Shaw, J., Lickey, E. B., Beck, J. T., Farmer, S. B., Liu, W. S., Miller, J., et al. (2005). The tortoise and the hare II: Relative utility of 21 noncoding chloroplast DNA sequences for phylogenetic analysis. Am. J. Bot. 92, 142–166. doi:10.3732/ajb.92.1.142
Shen, X., Wu, M., Liao, B., Liu, Z., Bai, R., Xiao, S., et al. (2017). Complete chloroplast genome sequence and phylogenetic analysis of the medicinal plant artemisia annua. Molecules 22, 1330. doi:10.3390/molecules22081330
Shi, G. R. (2004). Cluster analysis for embryological characters of 12 species in Gentianaceae. J. Huaibei Coal Indus. Teach. Colle. 25 (2), 51–55.
Struwe, L., and Albert, V. A. (2002). Gentianaceae: Systematics and natural history. New York: Cambridge University Press, 242.
Tang, P., Ruan, Q. Y., and Peng, C. (2011). Phylogeny in structure alterations of Poaceae cpDNA. Chin. Agric. Sci. Bull. 27 (30), 171–176.
Tian, C. Y., Li, X. S., Wu, Z. N., Li, Z. Y., Hou, X. Y., Li, R. Y. H., et al. (2021). Characterization and comparative analysis of complete chloroplast genomes of three species from the genus Astragalus (Leguminosae). Front. Genet. 12, 705482. doi:10.3389/fgene.2021.705482
Von Hagen, K. B., and Kadereit, J. W. (2002). Phylogeny and flower evolution of the Swertiinae (Gentianaceae-Gentianeae): Homoplasy and the principle of variable proportions. Syst. Bot. 27, 548–572.
Wicke, S., Schneeweiss, G. M., Pamphilis, C. W., Kai, F. M., and Quandt, D. (2011). The evolution of the plastid chromosome in land plants: Gene content, gene order, gene function. Plant Mol. Biol. 51, 273–297. doi:10.1007/s11103-011-9762-4
Wu, X. M., Wu, S. F., Ren, D. M., Zhu, Y. P., and He, F. C. (2007). The analysis method and progress in the study of codon bias. Yi Chuan Hered. 29 (4), 420–426. doi:10.1360/yc-007-0420
Xi, H. C., Sun, Y., and Xue, C. Y. (2014). Molecular phylogeny of Swertiinae (Gentianaceae-Gentianeae) based on sequence data of ITS and matK. Plant Divers Res. 36 (2), 145–156.
Yang, Y. M., Jiao, J., Fan, X. C., Zhang, Y., Jiang, J. F., Li, M., et al. (2019). Complete chloroplast genome sequence and characteristics analysis of Vitis ficifolia. Acta. Hort. .Sin. 46 (4), 635–648.
Yang, Y., Tao, Z., Dong, D., Yang, J., Feng, L., Zhao, G. F., et al. (2016). Comparative analysis of the complete chloroplast genomes of five quercus species. Front. Plant Sci. 7, 959. doi:10.3389/fpls.2016.00959
Zhang, Y. J., Ma, P. F., and Li, D. Z. (2011). High-throughput sequencing of six bamboo chloroplast genomes: Phylogenetic implications for temperate woody bamboos (Poaceae: Bambusoideae). PLoS One 6, e20596. doi:10.1371/journal.pone.0020596
Zhou, H., Jin, S. L., Li, G., Zhang, L., Qin, R., and Liu, H. (2014). The applications of chloroplast genome analysis in plant system development. Botanical Res. 3, 1–9. doi:10.12677/br.2014.31001
Zhou, T., Chen, C., Wei, Y., Chang, Y. X., Bai, G. Q., Li, Z, H., et al. (2016). Comparative transcriptome and chloroplast genome analyses of two related Dipteronia species. Front. Plant Sci. 7, 1512. doi:10.3389/fpls.2016.01512
Keywords: Swertia, chloroplast genome, comparative analysis, phylogenetic analysis, repeat sequences
Citation: Yang L, Li J and Zhou G (2022) Comparative chloroplast genome analyses of 23 species in Swertia L. (Gentianaceae) with implications for its phylogeny. Front. Genet. 13:895146. doi: 10.3389/fgene.2022.895146
Received: 13 March 2022; Accepted: 06 July 2022;
Published: 31 August 2022.
Edited by:
Madhav P. Nepal, South Dakota State University, United StatesReviewed by:
Abdullah, Quaid-i-Azam University, PakistanSurendra Neupane, University of Florida, United States
Jia-Yu Xue, Nanjing Agricultural University, China
Copyright © 2022 Yang, Li and Zhou. This is an open-access article distributed under the terms of the Creative Commons Attribution License (CC BY). The use, distribution or reproduction in other forums is permitted, provided the original author(s) and the copyright owner(s) are credited and that the original publication in this journal is cited, in accordance with accepted academic practice. No use, distribution or reproduction is permitted which does not comply with these terms.
*Correspondence: Guoying Zhou, zhougy@nwipb.cas.cn