Human activities dominant the distribution of Kobresia pygmaea community in alpine meadow grassland in the east source region of Yellow River, China
 Yanyan Lv
 Yi Sun
 Shuhua Yi
 Baoping Meng
- 1Institute of Fragile Eco-Environment, Nantong University, Nantong, Jiangsu, China
- 2School of Geographic Science, Nantong University, Nantong, Jiangsu, China
Kobresia pygmaea is the endemic and one of the most important species in the alpine meadow in the Qinghai-Tibet Plateau. It is the key stage in the management of degraded grassland, and irreversible degradation will take place after the degradation succession phases of the Kobresia pygmaea community. However, knowledge about the spatial distribution and driving factors were still unknown. In this study, the potential distribution of the Kobresia pygmaea community was determined using the BIOMOD niche model. Combine with the reality distribution based on remote sensing classification, the driving factors of climate and human activities were identified. The findings revealed that: (1) among all environmental factors, the maximum radiation, monthly temperature difference, driest period precipitation were the main climate influencing factors for the Kobresia pygmaea community distribution, and random forest model achieved the highest prediction accuracy and best stability of any niche model. (2) The potential distribution area of Kobresia pygmaea community was 653.25 km2 (account for 3.28% of the study area), and mostly located in northern and central of Zeku County, northeast of Henan County, and northeast, central, and eastern parts of Maqu County. (3) Climate factors driven 21.12% of Kobresia pygmaea community reality distribution, while human activities driven for 79.98%. Our results revealed that human activities dominant the reality distribution of Kobresia pygmaea community in alpine meadow grassland in the east source region of Yellow River, China.
1. Introduction
Kobresia pygmaea is an endemic and one of the most prominent plants on the Qinghai-Tibet Plateau’s (QTP) alpine meadow (Zhang and Noltie, 2010; Miehe et al., 2011). Since the 1980s, alpine meadow grassland has degraded to varying degrees owing to the cumulative impacts of climate change and human activity, particularly in the Yellow River’s source region (Wang et al., 2015). This might limit the sustainable growth of animal husbandry and endanger local ecological security (Liu et al., 2018). The degradation succession phases of the alpine meadow grassland community are (I) Stipa silena + Festuca ovina + Kobresia humilis, (II) Kobresia humilis, (III) Kobresia pygmaea, and (IV) black soil type. The Kobresia pygmaea community, in particular, is a critical stage in the management of degraded grassland (Cao and Long, 2009). The original community structure may be swiftly restored in the first two stages by removing any disruption or artificial measures (Lin, 2017). Generally, the Kobresia pygmaea community builds almost closed, non-specific, golf-course like the lawn with a felty root mat (Miehe et al., 2019). This characteristic of mat is benefit for against external disturbance, increasing nutrient storage and grassland productivity (Miehe et al., 2008). However, with the fragmentation of Kobresia pygmaea community turf, the water budget, carbon cycle, and soil nutrition have been significantly lost (Miehe et al., 2019). Further degradation of the Kobresia pygmaea community will result in permanent degradation till the severest stage of black soil type (Li et al., 2013). Hence, mapping the existing distribution and driving factors of Kobresia pygmaea meadow, are crucial for taking mitigation and adaptation measures.
Currently, however, the majority of Kobresia pygmaea community researches are conducted at the plot scale using manipulative studies (Ma et al., 2017; Li et al., 2018). The geographical distribution and driving factors in the QTP are largely unknown (Zhang and Noltie, 2010; Miehe et al., 2011, 2019). With the development of remote sensing classification methods, satellite images and machine learning were successfully applied at the community level (Chen et al., 2018; Su et al., 2020; Wen et al., 2010). Meng et al. (2021) mapped the Kobresia pygmaea community through the random forest (RF) method based on the combination of remote sensing, texture and topographic indices (Meng et al., 2021). However, the driving factors of climate and human activities for its reality distribution are not distinguished. Similar to the Residuals-Trend model (Wessels et al., 2004, 2007), the potential distribution of vegetation community is only controlled by climate factors. Thus, the human-induced vegetation variation could be detected after removing the climate factors (Li et al., 2018).
The niche model is also known as the species distribution model or the habitat model. The model associates species with information on environmental factors and geographical attributes of sites where the species was present or absent (Elith and Leathwick, 2009). These models can be used to forecast or better understand species distribution (Halvorsen, 2012; Xu et al., 2015; Petitpierre et al., 2017; Citores et al., 2020). In the last 20 to 30 years, niche models have grown fast due to the development of empirical models based on statistics or theoretical derivation. There are now about 20 species distribution models in use (Zhu et al., 2013; Xu et al., 2015). Most specialized models are supported by software, such as GARP and Maxent (Stockwell and Peters, 1999; Phillips et al., 2006). Furthermore, various multi-model integrated systems, such as openModeller, BIOMOD, dismo, and others, have been created in recent years (Thuiller et al., 2009; Muoz et al., 2011). The advancement considerably encourages the use of this model in ecology and geography. BIOMOD (BIOdiversity MODeling) has been merged with hundreds of empirical statistical models, including the maximum entropy model (ME), generalized linear model (GLM), and generalized additive model (GAM), and its influence on species niche prediction has been successfully studied (Thuiller et al., 2009).
To evaluate the species’ prospective range, a large number of observation samples of fundamental niche are required (Li and Guo, 2013). With the advancement of airborne remote sensing technology in recent years, unmanned aerial vehicle (UAV) technology has provided a novel and practical method for grassland resource monitoring. This approach compensates for the shortcomings of satellite remote sensing and other traditional monitoring techniques (Yi, 2017). UAVs have been widely used in the treatment and analysis of vegetation coverage, patches, gravel, pika holes, and grassland plant species and communities in a large area of the QTP due to their advantages of efficient mobility, ease of operation, and high photo resolution (Yi et al., 2016; Meng et al., 2018; Sun et al., 2018). At the same time, Yi (2017) created a series of UAV aerial photography systems based on the climatic and environment features of the QTP. The repeated observation of a large number of working sites may be accomplished, providing assistance for the Kobresia pygmaea community’s field observation in the research region.
In this study, a UAV is utilized to observe the Kobresia pygmaea community, and a portion of alpine meadow in the Yellow River’s source region is employed to conduct the following investigations: (1) The main climate driving factors and potential distribution of Kobresia pygmaea community; (2) Identify the driving factors of climate and human activities for Kobresia pygmaea community reality distribution.
2. Data and methods
2.1. Study area
The research area is located on the eastern side of the QTP, east of the Yellow River’s source region, and includes Zeku County and Henan County in Qinghai Province, as well as Maqu County in Gansu Province (Figure 1). It is one of the most significant animal husbandry bases in the QTP, as well as an important water supply conservation region in China. The coordinates are 33°03′35°33’ N, 100°33′102°33′ E, with elevations ranging from 2,871 to 4,850 m. The average annual precipitation is 400 ~ 600 mm, the average annual temperature is −2.4°C ~ 2.1°C, and it belongs to the continental plateau temperate monsoon. The major grassland type in this area is alpine meadow, which accounts for 79.67% of the total study area, followed by mountain meadow, marsh meadow, and alpine grassland, which account for 13.22, 1.78, and 1.69%, respectively (Figure 2). The main grassland vegetation is Poaceae community and kobresia humilis community in the study area, with the dominant species Elymus nutans, Stipa silena, Festuca ovina, and Kobresia humilis. The Kobresia pygmaea is the dominant species in Kobresia pygmaea community, with a lower species richness than other vegetation communities in alpine meadow grassland. Weeds are the dominant species in the black soil type vegetation community. Grassland plants have a relatively short growing season, lasting just around 150 days from May to September. Grazing is the most common technique of grassland usage, while yak and sheep are the most common animals.
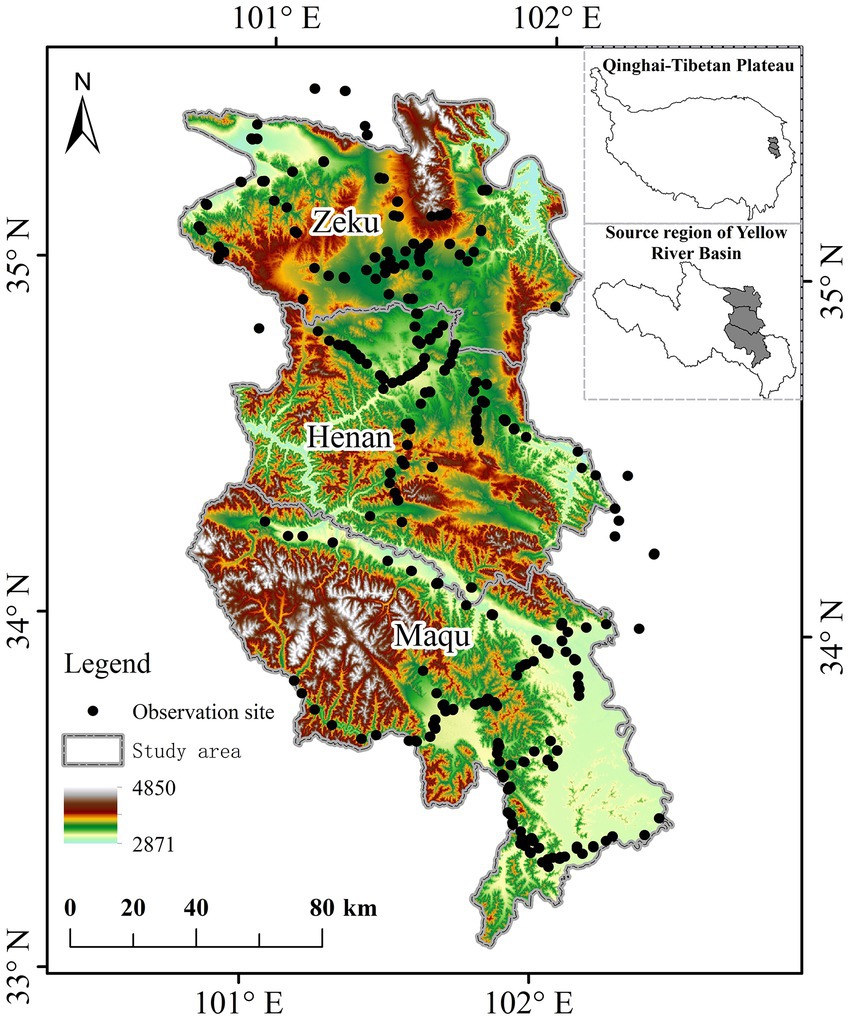
Figure 1. Location of study area.
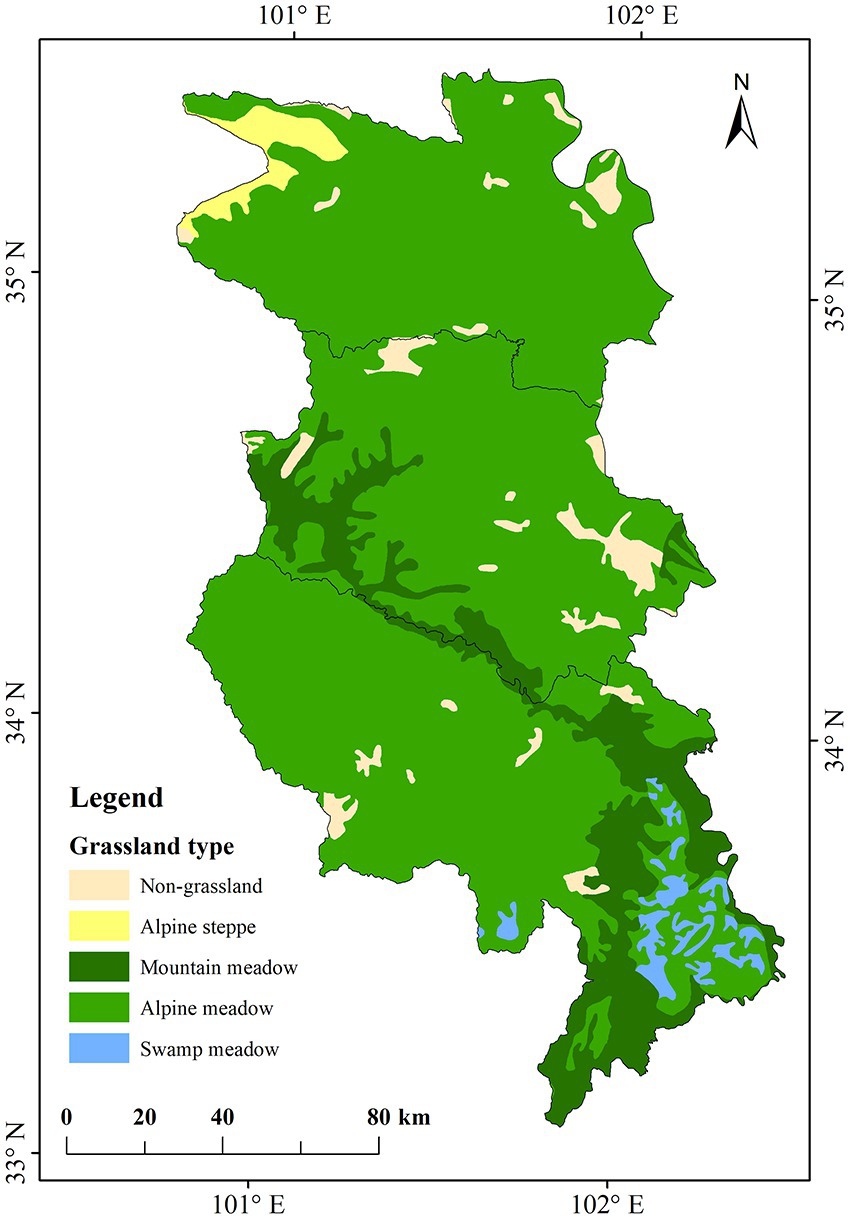
Figure 2. Grassland types of study area.
2.2. Materials and methods
2.2.1. Field observation and preprocess of aerial photos
The field observations of the Kobresia pygmaea community in this study were obtained from photographs collected by UAVs (Phantom 3 professional and Mavic 2 zoom Quad-Rotor intelligent UAVs). The observation sites were selected based on grassland growth state and spatial representativeness, and the flight path was developed with four paths in each site. One Grid flight mode and three Belt types are included (Figure 3A). The flight paths of UAVs were designed using FragMAP (Yi et al., 2016). A Phantom 3 professional was used to perform the Grid mode (within the 200 m × 200 m area) at a height of 20 m (red dot in Figures 3A,B), and a Mavic 2 zoom was used to perform the Belt mode (within the 40 m × 40 m area) at a height of 2 m (yellow dot in Figures 3A,C). Sixteen grassland images were then shot vertically downhill in each mode; the photograph resolution of Grid and Belt is 1 cm and 0.09 cm, respectively, and their coverage is 26 m × 35 m and 3.43 m × 2.57 m.
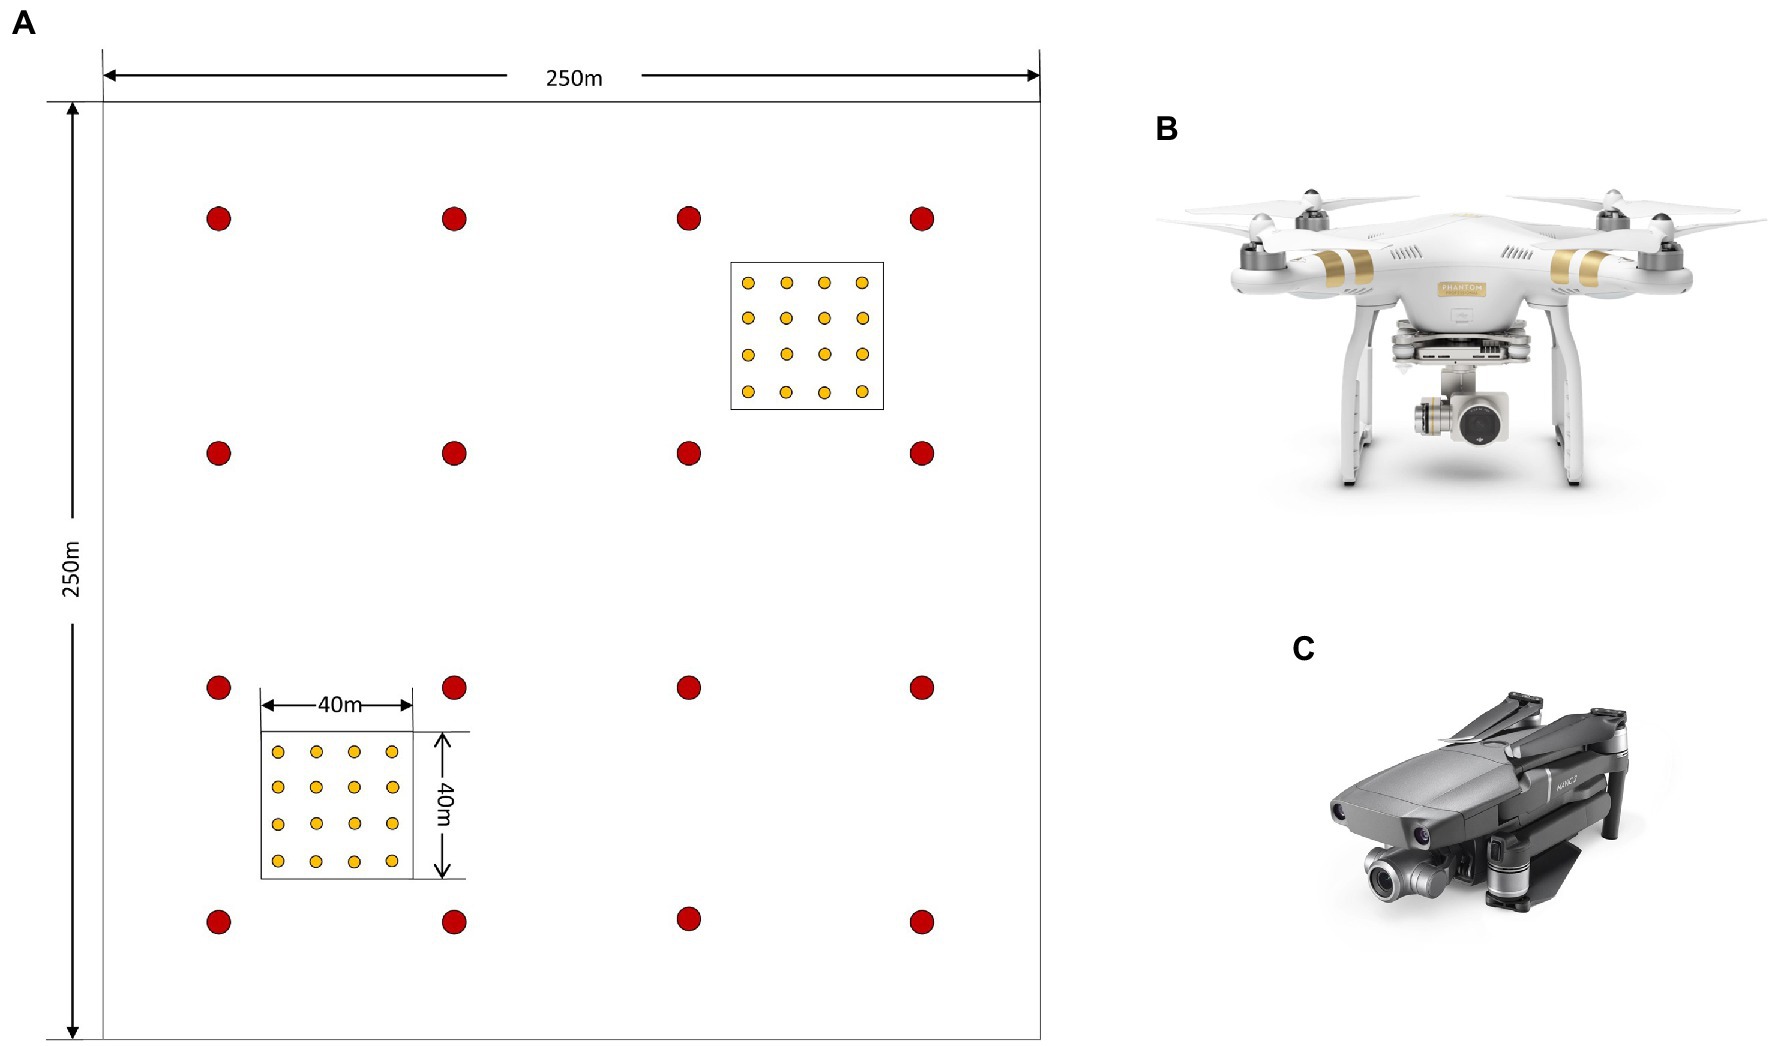
Figure 3. Strategy of field observation and data collection, (A) is the strategy of observation sites, (B) and (C) are Phantom 3 professional and Mavic 2 zoom Quad-Rotor intelligent UAVs.
The photographs were verified individually and assigned to the presence or absence of Kobresia pygmaea community sites based on the primary species of grass flora, grassland coverage, textural aspects of plant development, and plateau pika activity (Figure 4). In comparison to other grass communities, the Kobresia pygmaea community displays distinct morphological and textural features, including closed and monospecific structures (Figure 4A), polygonal crack patterns (Figure 4B), and a felty root mat (Figure 4C; Cao and Long, 2009). Furthermore, when cracking and collapse intensified, pika and noxious plants proliferate. From 2015 to 2019, 751 sample plots were observed in the pinnacle of grassland expansion (Figure 1). All observation locations were labeled as having or not having a Kobresia pygmaea community, which was subsequently utilized in the BIOMOD prediction input.
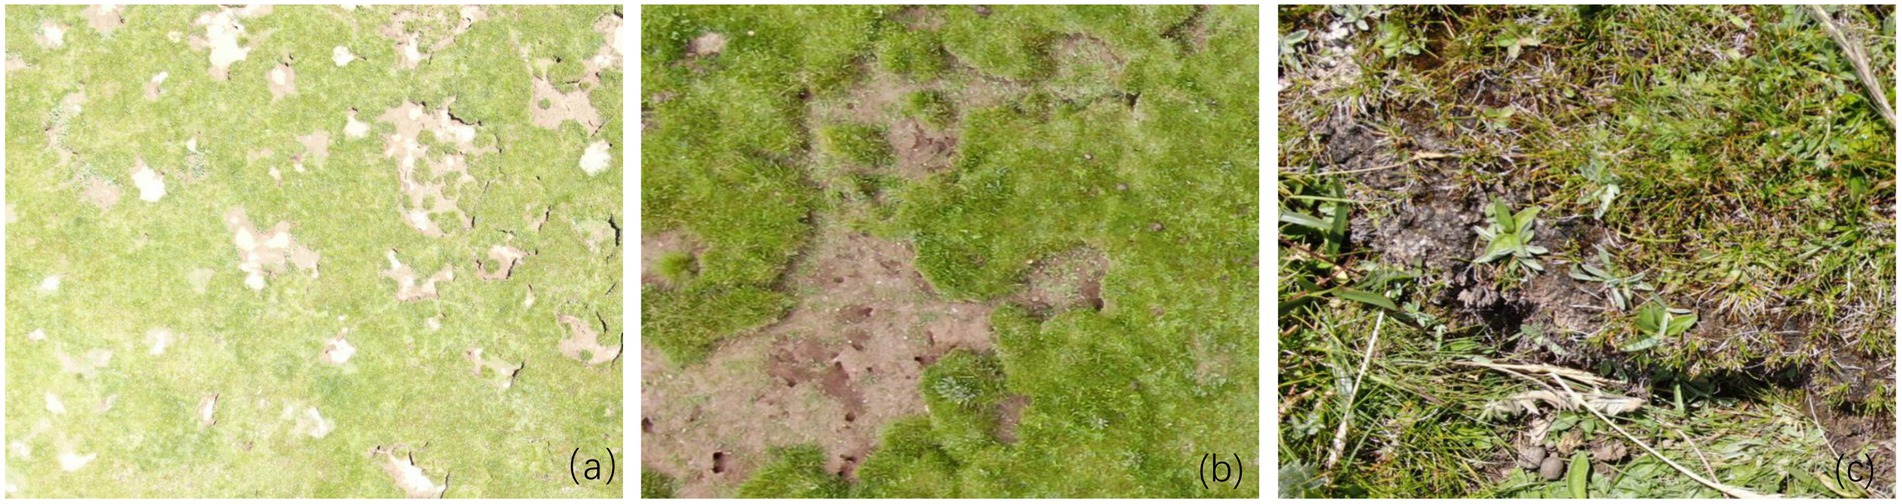
Figure 4. Aerial photographs of Kobresia pygmaea community, (A) the patch characteristics of Kobresia pygmaea community observed at height of 20 m, (B) the phenomenon of cracking and collapse in Kobresia pygmaea community observed at height of 2 m, and (C) the felty root mat of Kobresia pygmaea community observed at height of 2 m with double wide-angle zoom lenses.
2.2.2. Acquisition and processing of remote sensing and environmental data
The MOD13Q1 NDVI remote sensing data utilized in this investigation was obtained from the National Aeronautics and Space Administration in the United States (USGS). The total number of photos downloaded was 23, the spatial resolution is 250 m, and the orbit number is H26V05. The primary preprocessing steps are: (1) picture projection was changed using MODIS Projection Tool (MRT) and defined as WGS1984; (2) resampling of the image resolution into 250 m in ArcMap and defined projection as Albers; (3) cell statistics tool was used to determine the maximum, minimum, average, and variation range of NDVI in 2019. Climate, soil, and terrain are the three most critical environmental factors. Climate data were obtained from the Institute of Tibetan Plateau, Chinese Academy of Sciences (Yang et al., 2010; Chen et al., 2011). These datasets include yearly average temperatures, precipitation, and humidity, as well as seasonal indices such as wettest season, driest season, hottest season, and coldest season, with a total of 33 grid layers. The soil dataset was obtained from the cold and dry regions science data center, Northwest institute of ecological environment and resources, Chinese Academy of Science.1 Including the sand and clay concentrations of the surface soil (0–30 cm; represented as clay1 and sand1) and the bottom soil (30–60 cm; represented as clay2 and sand2); The DEM data used in this study were 90 m shuttle radar topography mission (SRTM) images (version V004) in Geo-TIFF format2 resampled to 250 m. Based on the DEM, the slope, topographic position index (TPI), and aspect were determined. All of the above environmental parameters were evenly projected as Albers with a spatial resolution of 250 m and utilized as input to BIOMOD.
2.3. Biodiversity modeling niche model simulation
2.3.1. Biodiversity modeling contrustion
In this study, BIOMOD2 was utilized to simulate the possible distribution of the Kobresia pygmaea community, which was then used to reflect the prospective dispersion of the community (Thuiller et al., 2009). There are 10 niche models available, including the generalized linear model (GLM), generalized enhanced regression model (GBM), generalized additive model (GAM), classification tree analysis (CAT), artificial neural network (ANN), surface range envelope (SRE), flexible discriminant analysis (FDA), multiple Adaptive regression Splines (MARS), random forest (RF), and maximum entropy model (MaxEnt). The presence and absence of Kobresia pygmaea community data, as well as the corresponding environmental parameters, are fed into the niche model, and the output is the likelihood of Kobresia pygmaea community presence in space. To limit the impact of information redundancy on niche model performance, the “Importance index” and cumulative contribution were utilized to select the primary impacting elements. To examine the importance of each environmental factor, the leave-one-out cross-validation (LOOCV) approach (Meng et al., 2020) was utilized. The correlation coefficient (CV) between the predicted results based on variables of total environment factors and one deleted environment factor was determined for each occasion. The Importance values are then derived by subtracting 1 from this correlation coefficient. The Importance Index formula is as follows:
where all gathered environmental factors are defined as the reference dataset, and elements deleted from all are defined as the shuffled dataset. Prediction results based on all environmental factors are represented by pred ref., whereas prediction results based on factors removed from all are represented by pred shuffled. The results are used to compute the correlation (cor). Then, using equation (2), the primary influencing elements were chosen based on the cumulative contribution (more than 85%), determined according to Importance value from high to low. The contribution formula is:
represent contribution for i-th factor, represent Importance for i-th factor, and represent total of all factors Importance value.
2.3.2. The accuracy evaluation of niche model
True skill statistics (TSS) and AUC [area under the operating characteristic curve (ROC)] were employed in this study to assess the accuracy of niche model prediction. The TSS considers the likelihood of success of the random conjecture by taking omission average error into account. TSS has a value between 0 and 1, and the closer the number is to 1, the better the model’s performance. The ROC curve is a composite indicator that measures the sensitivity and specificity of continuous variables, with each point on the curve representing the sensitivity to signal stimuli. AUC values vary from 0.5 to 1. The closer to one, the better the model forecast; conversely, the closer to 0.5, the closer the model prediction is to a random guess.
where TPR represent true positive rate, FPR represent false positive rate.
2.4. The driving factors of Kobresia pygmaea community
In this study, the reality distribution of Kobresia pygmaea community was obtained from remote sensing classification, produced by Meng et al. (2021) at the same space and time range (Meng et al., 2021). We predicted these potential distribution by transforming the probabilities of presence into binary data (suitable/unsuitable; Liu et al., 2013; Ma et al., 2021). The potential distribution of Kobresia pygmaea community was calculated by the optimal niche model (region with existence probability higher than 50%). The spatial overlay analysis was used to distinguish the driving factors of Kobresia pygmaea community distribution in ArcMap 10.2 software. For example, the overlap between potential and reality distribution is believed to be driven by climate factors, otherwise, driven by human activities.
3. Results
3.1. Spatial heterogeneity of observed Kobresia pygmaea community
The spatial distribution of observation sites for Kobresia pygmaea community presence/absence was shown in Figure 5. Maqu County has the largest percentage of Kobresia pygmaea community presence sites among the 751 observed sites, with 68 observed sites accounting for 19.82% of total observed sites. Zeku and Henan County come next, with 37 and 22 presence observation sites, respectively, accounting for 16.74 and 11.76% of total observed sites. Overall, the number of Kobresia pygmaea community presence sites among all observed sites is limited, representing only 16.91% of total observed sites.
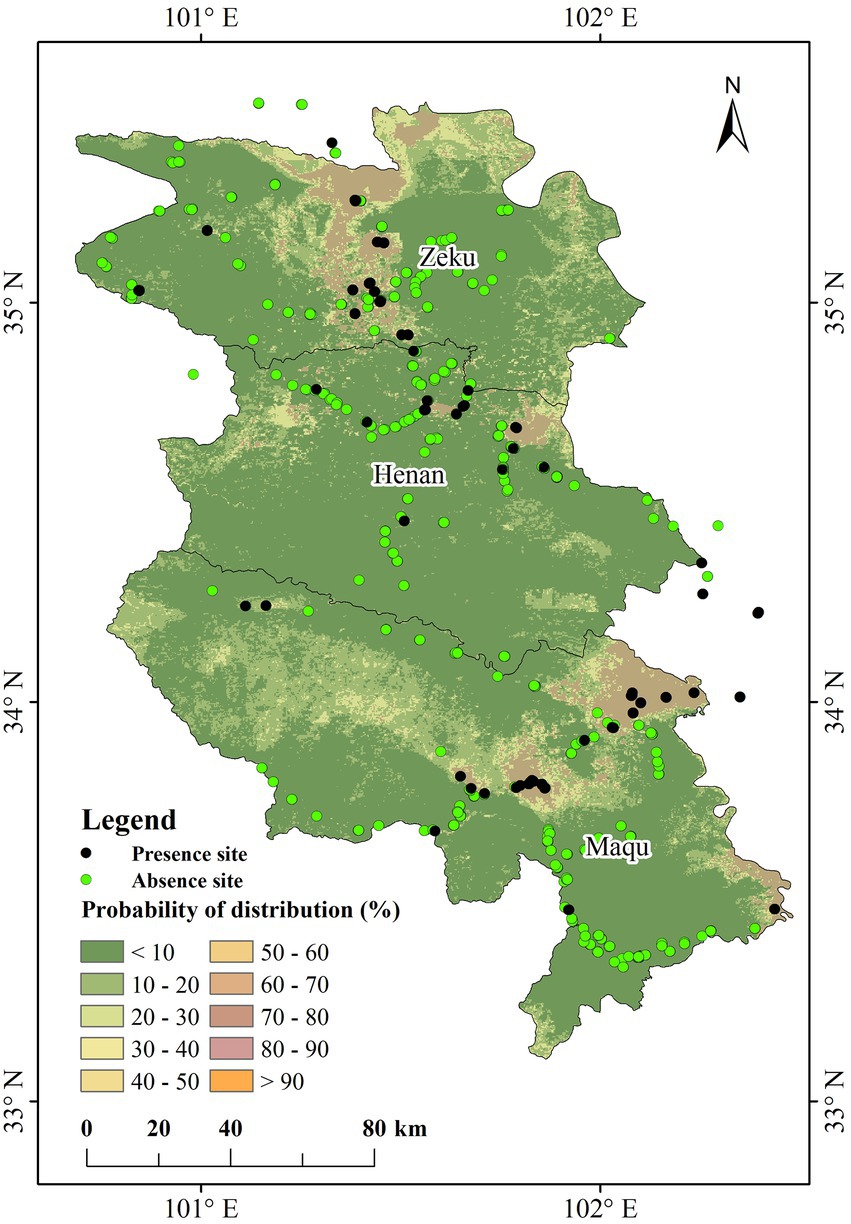
Figure 5. Distribution of presence probability of Kobresia pygmaea community.
3.2. Model construction and accuracy evaluation
Table 1 showed the Importance and Contribution value results based on LOOCV and 9 specialized models (except for GAM, test run failed). The maximum radiation, monthly temperature range, precipitation in the driest period, warmest season radiation, precipitation in the driest season, maximum NDVI in the growing season, and annual mean radiation all had higher Importance values than others, with values more than 0.20. Furthermore, the maximal radiation had the greatest Importance, with a value of 0.30. Temperature seasonality, average humidity, maximum humidity, humidity in the wettest, driest, warmest and coolest season had a poor influence on the Kobresia pygmaea community, with Importance values close to zero. There are 22 environmental factors with a cumulative contribution of more than 85% (Table 1).
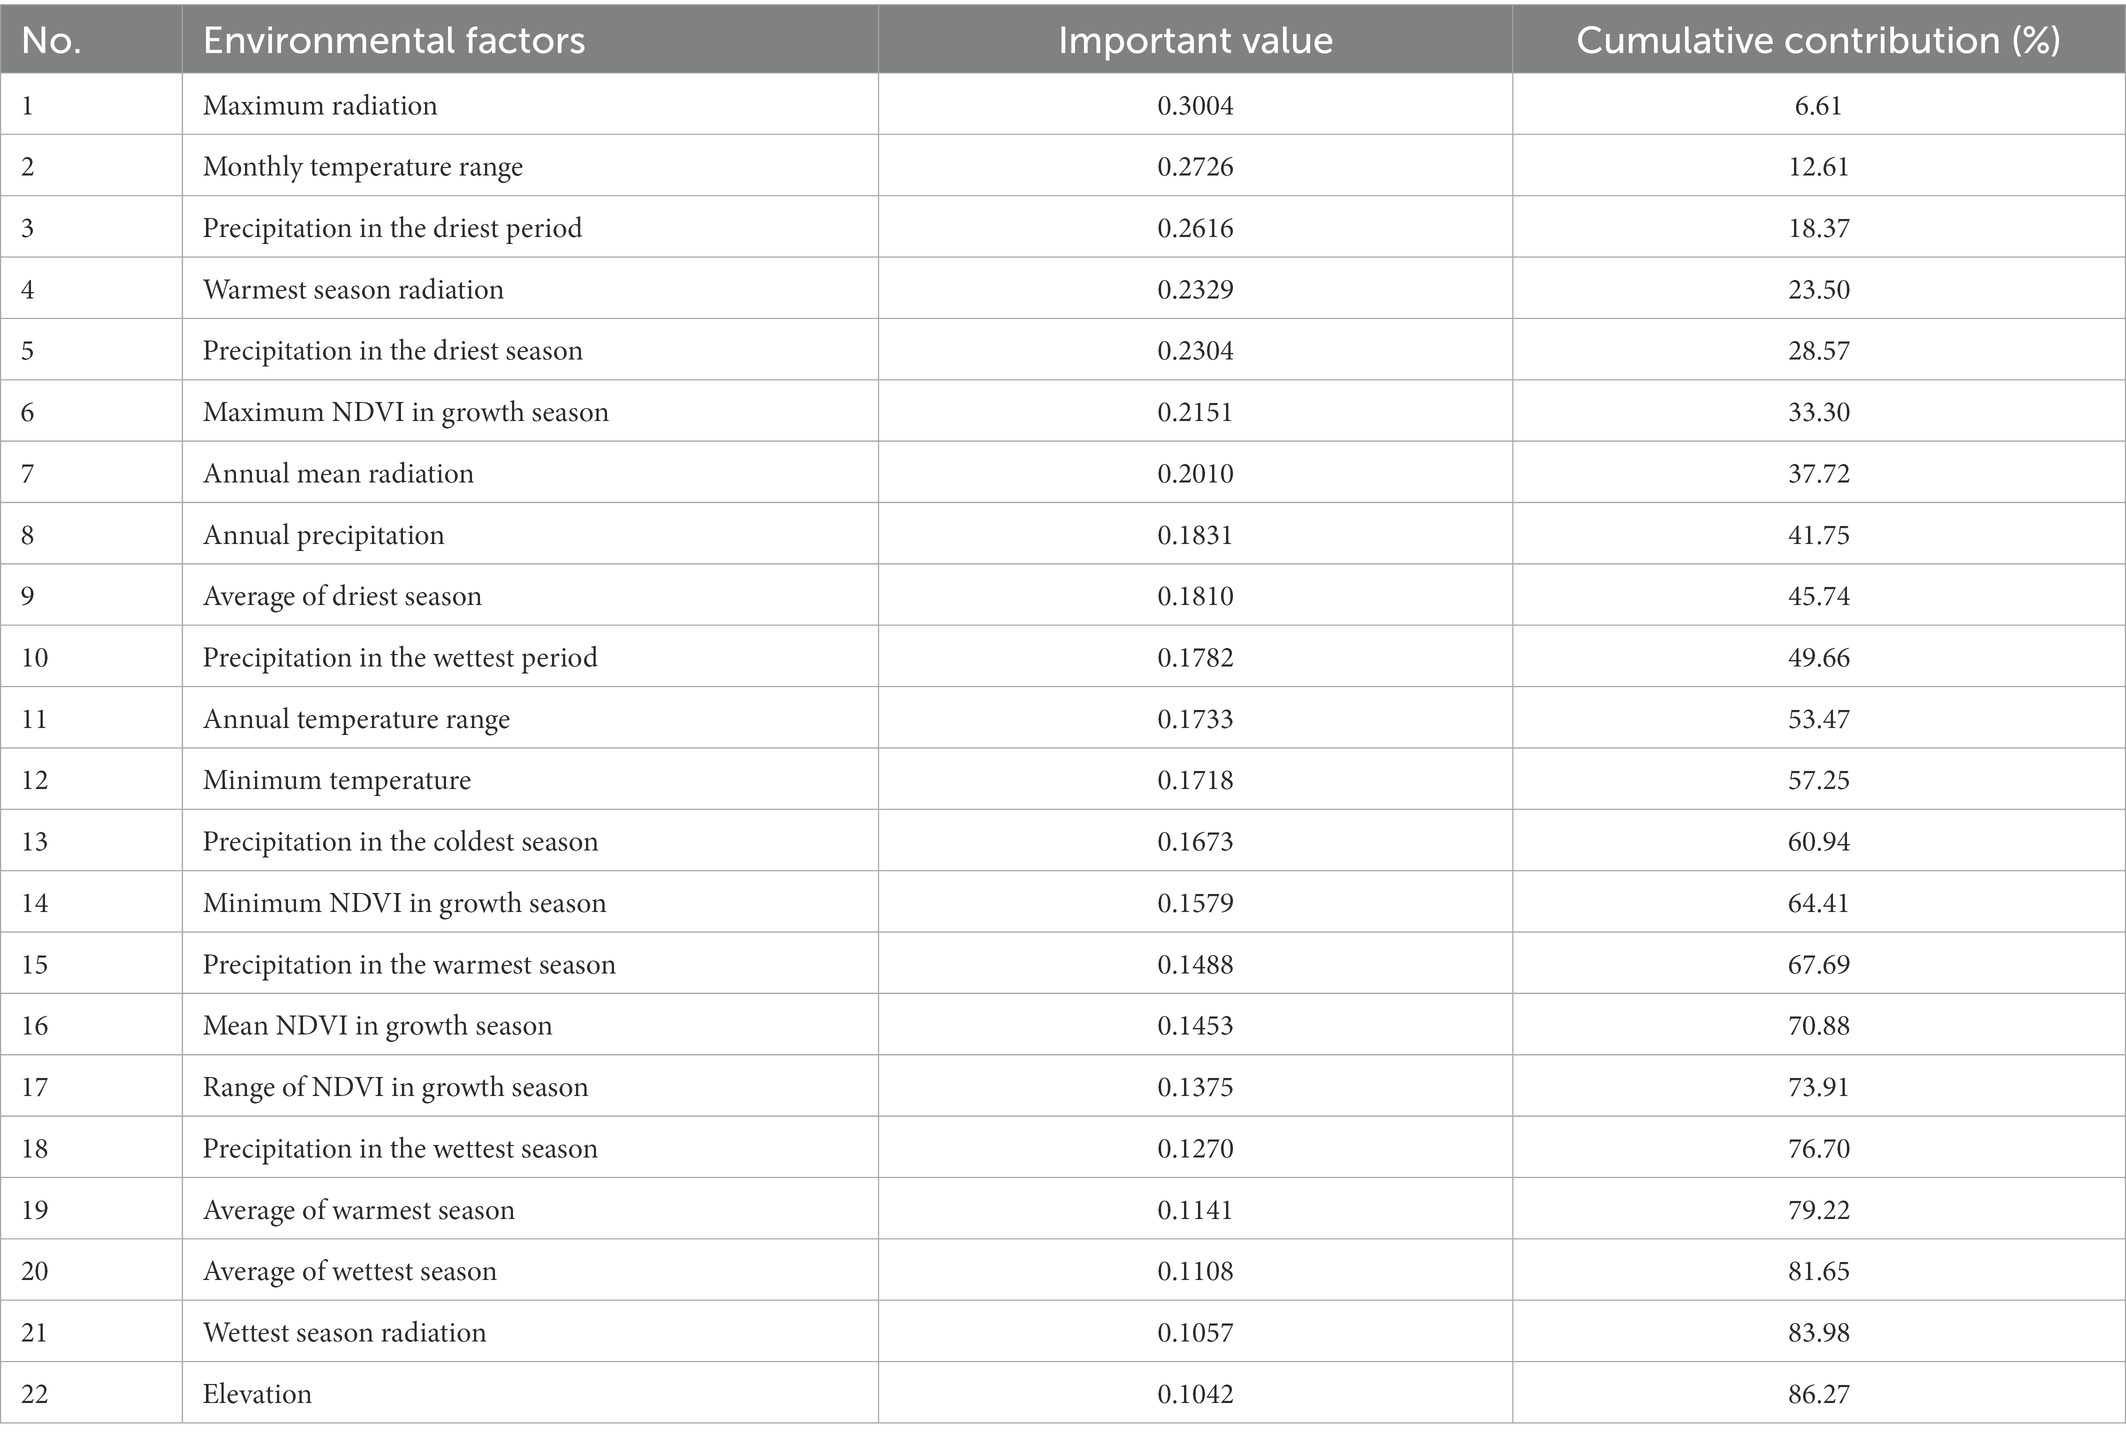
Table 1. Influencing factors for Kobresia pygmaea community.
Table 2 displays the TSS and AUC of nine models obtained by taking the average of multiple runs. Among all models, the RF model had the best predictive performance, with an average TSS and AUC of 0.74 and 0.92, respectively. Because the model’s SD and CV values for TSS and AUC are minimal (TSS, 0.09 and 0.12; AUC, 0.03 and 0.03), it had excellent prediction accuracy and stability. The GBM model came in second place, with average TSS and AUC values of 0.72 and 0.90, respectively. SD and CV of TSS are 0.08 and 0.12, respectively, whereas the SD and CV of the AUC are 0.03 and 0.04, respectively. The SRE and MAENT models performed poorly in terms of accuracy and stability, with average TSS of 0.25 and 0.29, and AUC of 0.63 and 0.68, respectively. The models’ prediction results were closest to random (AUC = 0.5). As a result, it could be stated that the prediction accuracy of these two models for the presence of the Kobresia pygmaea population in the studied region is poor.
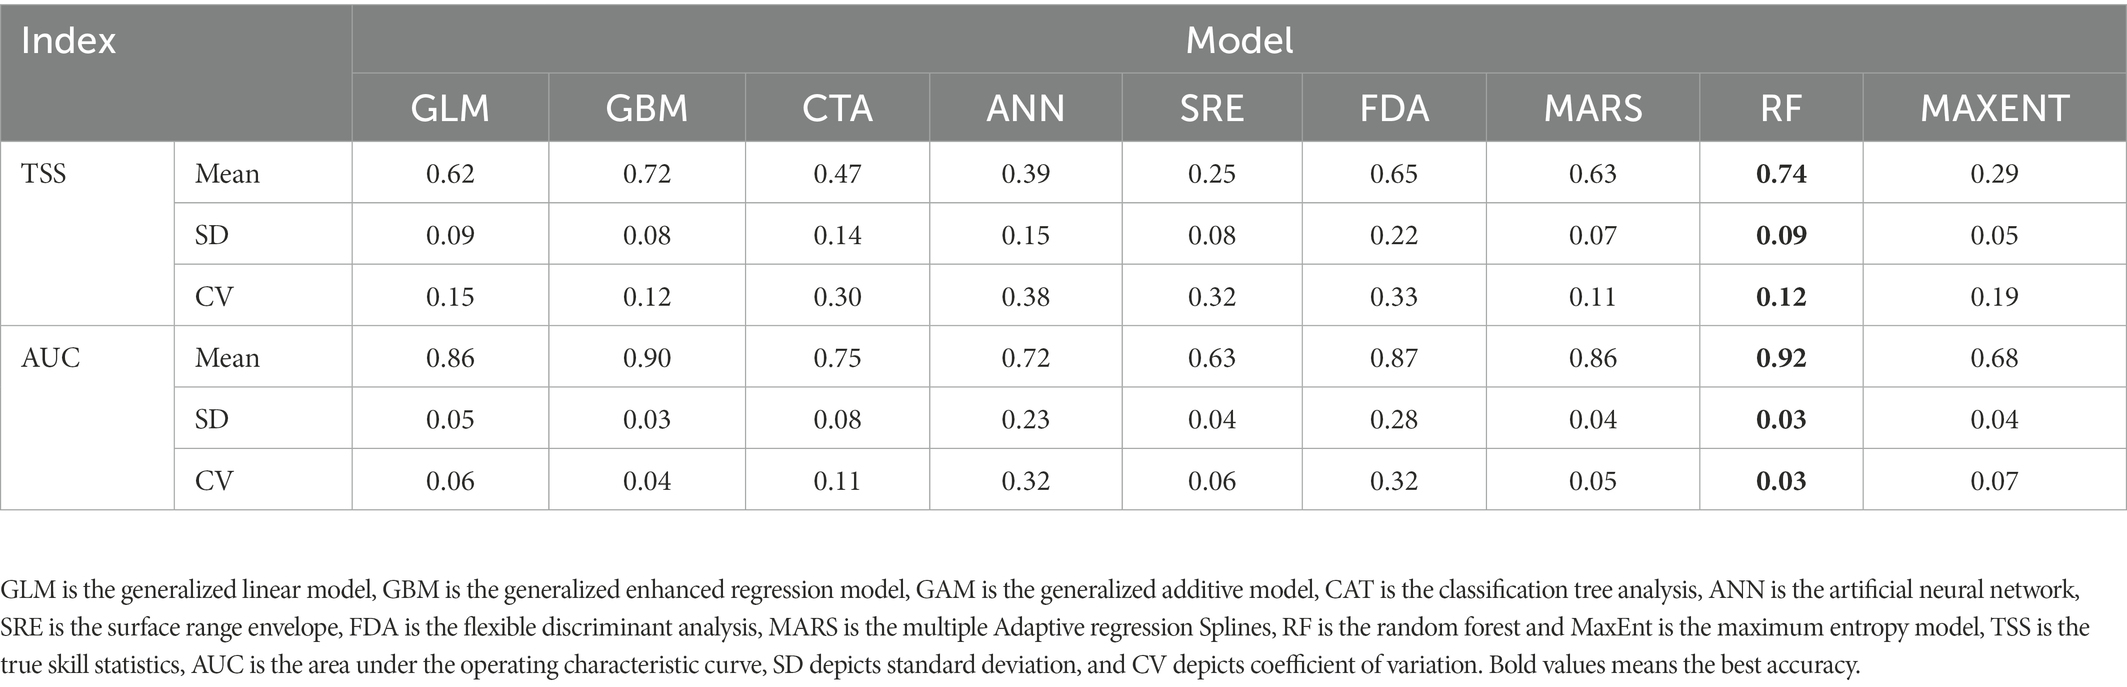
Table 2. Performance of each niche model.
3.3. The presence probability of Kobresia pygmaea community in the study area
The RF model with the best accuracy in numerous runs (TSS and AUC are 0.86 and 0.97, respectively) was selected to estimate the possible geographical distribution of the Kobresia pygmaea community in the research region, based on the results of the niche model accuracy evaluation in 2.3. The results revealed that the probability of Kobresia pygmaea community existence in most of the research region is less than 10% (accounting for 72.45% of the whole study area). The probability range of 10% ~ 50% accounted for 24.28% of the whole study area. Only 3.07% of the total research area had a probability of more than 50%, whereas 0.75% had a probability greater than 80%. The regions with a high probability of Kobresia pygmaea community existence are mostly located in Zeku County’s northern and central regions, Henan County’s northeast, and Maqu County’s northeast, central, and eastern parts (Figure 5).
3.4. Driving factors of Kobresia pygmaea community
According to the reality distribution of Kobresia pygmaea community acquired by remote sensing classification (Meng et al., 2021), the driving force of climate and human activities was identified. As Figure 6 shows, The potential distribution of Kobresia pygmaea community was mainly located in the north and around the county urban area of Zeku County (around the town of Zequ and Qiakeri), with an area of 262.44 km2 (2.78% of Zeku County); the northeast of Henan County (east of county urban area and towns of Tuoyema), with an area of 62 km2 (0.95% Henan County); the part of county urban area, towns of Awancang, and east of Manrima in Maqu County, with an area of 328.81 km2 (8.33% of Maqu County). As a whole, the potential distribution of Kobresia pygmaea community reached 653.25 km2, and accounted for 3.28% of the study area.
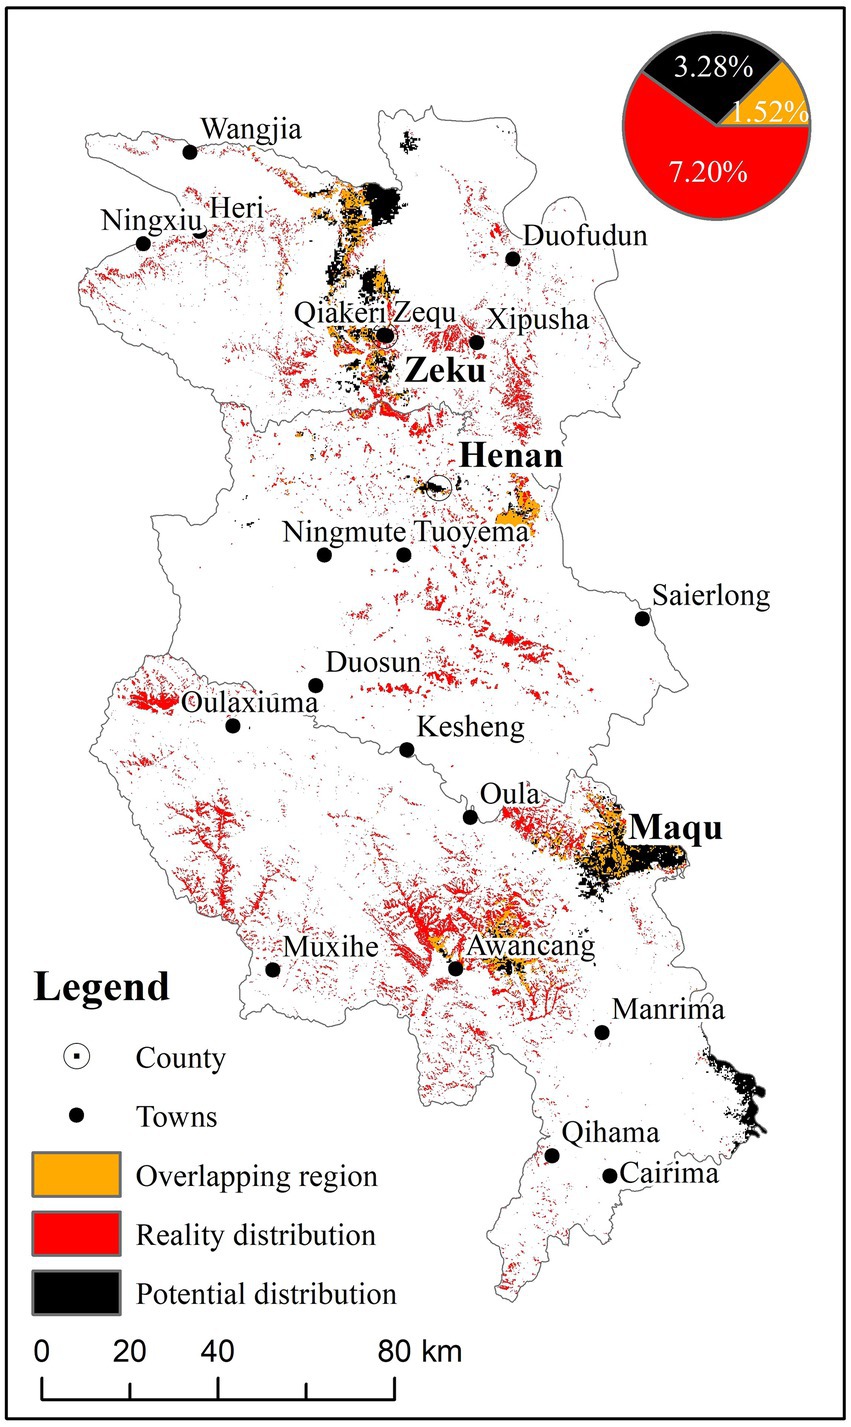
Figure 6. Reality and potential spatial distribution of Kobresia pygmaea community.
The results of driving factors were shown in Figure 6. The region where the Kobresia pygmaea community potential distribution and reality distribution overlapped, was located in the north and around the county urban area in Zeku County, east of county urban area in Henna, and the part of county urban area, towns of Awancang in Maqu. The area of overlapping region was 302.94 km2 (1.52% of the study area), accounting for 45.55% of potential distribution and 21.12% of reality distribution. In other words, about 21.12% of Kobresia pygmaea community was derived by climate factors, and human activities are the main factor leading to the formation of Kobresia pygmaea community in the study area.
4. Discussion
4.1. The influencing factors on the distribution of Kobresia pygmaea community
In general, grassland Kobresia pygmaea communities could be found in the northwest of the QTP at altitudes ranging from 4,400–4,800 m. The primary limiting factors for their growth are precipitation and nutrition (the soil quality is poor, and the annual precipitation is less than 450 mm with frequent seasonal drought; Li J. M. et al., 2016; Li R. et al., 2016). During the long process of natural selection, the Kobresia pygmaea community formed a compact and well-developed root system that not only protects soils from grazer trampling but also helps to cope with nutrient limitations by enabling medium-term nutrient storage and increasing productivity and competitive ability of roots against leaching and other losses (Miehe et al., 2019). Aside from climatic conditions, human activities have an impact on the Kobresia pygmaea community. Although the intensity of human activity on the Tibetan Plateau is low, the growth during the last two decades has been significantly greater than in other parts of the world (Li et al., 2017, 2018). Since 1960, with the shift of management strategies such as pastures, destocking, sedentarization, privatization, and fencing, overgrazing has been the key factor influencing the spatial distribution of the Kobresia pygmaea community (Gao and Li, 2016; Qiu, 2016). Overgrazing is another major cause of grassland deterioration in the QTP (Bai et al., 2002; Zhou et al., 2005; Li et al., 2010; Wang et al., 2012; Zhang et al., 2015).
In this study, precipitation in the driest period was discovered to be critically important in the east of the Yellow River’s source region, in addition to the hottest season, the yearly average and maximum radiation, and the monthly temperature range (Table 1, with Importance values greater than 0.20). The growth season for alpine grassland in the Yellow River’s source region is from May to September, with rain and high-temperature dominating (Meng et al., 2018). Extreme weather conditions (such as drought and high temperatures) hinder plant development during this time period (Miehe and Miehe, 2005). However, the distinctive structure of the Kobresia pygmaea community root may successfully withstand these occurrences (Li J. M. et al., 2016; Li R. et al., 2016; Miehe et al., 2019), which is also consistent with the results of environmental variables in our study.
The mean elevation of eastern edge of this study area is lower than 4,000 m, and mean annual precipitation is ≥450 mm. Poaceae community (Elymus nutans + Stipa silena + Festuca ovina) is widely distributed, overgrazing is the main inducing factor for grassland vegetation community variation (Zhou et al., 2005; Cao and Long, 2009; Miehe et al., 2019). Our result showed that the area of Kobresia pygmaea community potential distribution was 302.94 km2, accounting for 21.12% of reality distribution in study area. Results of this study have shown that nearly 80% of the reality Kobresia pygmaea community is without climate driving (Figure 6). In other words, we demonstrate that the existence of Kobresia pygmaea community is mainly generated by human activities (for example, grazing) in the east source region of Yellow River. The Kobresia pygmaea community is the key stage in the management of degraded grassland. Further degradation of Kobresia pygmaea community will cause irreversible degradation (Cao and Long, 2009; Li et al., 2013). Our study might offer a scientific foundation for managing alpine meadow erosion in the Yellow River’s source region.
4.2. Limitation for optimal niche model
Ten niche models were evaluated and examined in this study for their application to predict the spatial distribution of the Kobresia pygmaea community. GLM, GBM, GAM, CTA, MARS, MaxEnt, SRE, and FDA were statistically or rules-based models, whereas ANN and RF were machine-learning algorithm-based models (Breiman, 1996; Phillips et al., 2006; Zhu et al., 2013). In this study, the RF model had superior prediction accuracy (with TSS and AUC of 0.74 and 0.92) and stability (CV of TSS and AUC of 0.12 and 0.03). There are, however, inevitable variables that impact model accuracy. Firstly, as compared to other models, the RF model is data-driven, which can automatically obtain and understand data, and has a flexible methodology. Expectedly, as the size of the input data set grows, so the model’s estimation will be improved correspondingly (Han, 2001; He, 2008; Verrelst et al., 2015). It is made up of a big sample decision tree that is developed using high-dimensional data and has a high tolerance for data inaccuracy (Breiman, 1996, 2001). However, training an RF model with a limited sample size is complex, as it needs a substantial amount of tagged data and ground observed data (Verrelst et al., 2015; Ali et al., 2016). Furthermore, this type of model contains numerous elements, some of which (such as the climate) have high spatial quantization errors. As a result, the model continues to have some limits and uncertainties (Lehnert et al., 2015; Gao et al., 2013; Meng et al., 2020).
4.3. Unmanned aerial vehicle technology enables large-scale monitoring on the Kobresia pygmaea community
Kobresia pygmaea community distribution has received increasing attention in recent years as a key species of alpine meadow grassland on the QTP. However, its geographical distribution on the plateau is unknown (Zhang and Noltie, 2010; Miehe et al., 2011), and only a few scattered investigations at the sample plot level have been conducted (Dickore, 1995; Zhang and Noltie, 2010; Cao and Long, 2009). A large number of observation sites should be supplied before predicting the possible geographical distribution of the Kobresia pygmaea community (Li and Guo, 2013). However, utilizing the standard artificial observation approach makes large-scale observation impossible (Miehe et al., 2019).
In this work, the UAV aerial photography system FragMap was employed to acquire grass community observations, resulting in large-scale, fixed point, and repetitive observation of the Kobresia pygmaea community (Yi, 2017; Meng et al., 2018). The images taken by the UAV’s Grid and Belt modes have a high resolution (1 cm and 0.09 cm for Grid and Belt mode, respectively) and a vast spatial representative range (1 photograph can represent a traditional observation site). And the resolution is sufficient to discern the Kobresia pygmaea community in the alpine meadow (Figure 4; Sun et al., 2018).
As a result, it is a remarkable novelty for this study to successfully employ a UAV aerial photography system to acquire observation sites for the existence or absence of the Kobresia pygmaea community in the Yellow River’s source region. On the one hand, it saves a significant amount of people and material resources as well as economic input; on the other hand, it improves observation efficiency and enables large-scale fixed repetitive observation (Yi et al., 2016). However, the vegetation pieces and grassland communities were acquired by visual interpretation, and it requires good knowledge of plant taxonomy and time-consuming. Hence, the automatic identification of vegetation pieces and grassland communities based on aerial photographs and the deep-learning algorithm requires further exploration (Lv et al., 2022).
5. Conclusion
The forecast accuracy of 10 niche models was assessed in BIOMOD based on UAV observations of the Kobresia pygmaea community and its associated environmental parameters in the eastern section of the Yellow River’s Source basin. The preliminary distribution of the Kobresia pygmaea community was predicted, and the following findings were reached: (1) Six of the 44 tested environmental factors (maximum radiation, monthly temperature difference, precipitation in the driest period, radiation in the warmest season, precipitation in the driest season, and annual average radiation) have high Importance values (>0.20), and there are 22 influencing factors in the study area with a cumulative contribution of more than 85%. (2) The RF model had the highest accuracy and stability in predicting the spatial distribution of the Kobresia pygmaea community, with TSS, AUC of 0.74 and 0.92, respectively; (3) the regions with a probability of Kobresia pygmaea community presence greater than 50% are primarily located in northern and central areas of Zeku County, northeastern and central areas of Henan County, and northeast, central, and eastern areas of Maqu County; (4) About 21.12% of Kobresia pygmaea community was derived by climate factors, and nearly 80% was derived by human activities. Human activities are the main factor leading to the formation of Kobresia pygmaea community in the east source region of Yellow River.
Data availability statement
The original contributions presented in the study are included in the article/supplementary material, further inquiries can be directed to the corresponding author.
Author contributions
YL and YS collected the data and write the manuscript. SY revised the manuscript. BM collected the data and revised the manuscript. All authors contributed to the article and approved the submitted version.
Funding
This study was supported by National Natural Science Foundation (nos. 42071056 and 31901393).
Acknowledgments
We thank the National Park of Qilian Mountain for helping in the field observation.
Conflict of interest
The authors declare that the research was conducted in the absence of any commercial or financial relationships that could be construed as a potential conflict of interest.
Publisher’s note
All claims expressed in this article are solely those of the authors and do not necessarily represent those of their affiliated organizations, or those of the publisher, the editors and the reviewers. Any product that may be evaluated in this article, or claim that may be made by its manufacturer, is not guaranteed or endorsed by the publisher.
Footnotes
References
Ali, I., Cawkwell, F., Dwyer, E., Barrett, B., and Green, S. (2016). Satellite remote sensing of grasslands: from observation to management-a review. J. Plant Ecol. 9, 649–671. doi: 10.1093/jpe/rtw005
Bai, W., Zhang, Y., Xie, G., and Shen, Z. (2002). Analysis of formation causes of grassland degradation in maduo county in the source region of yellow river. J. Appl. Ecol. 13, 823–826.
Cao, G. M., and Long, R. J. (2009). System stability and its self-maintaining mechanism by grazing in alpine Kobresia meadow. Chin. J. Agrometeorol. 30, 553–559.
Chen, Y. Y., Yang, K., He, J., Qin, J., Jshi, J. C., Du, J. Y., et al. (2011). Improving land surface temperature modeling for dry land of China. J. Geophys. Res. 116:D20104. doi: 10.1029/2011JD015921
Chen, Q., Yu, R., Hao, Y., Wu, L., Zhang, W., Zhang, Q., et al. (2018). A new method for mapping aquatic vegetation especially un-derwater vegetation in lake ulansuhai using GF-1 satellite data. Remote Sens. 10:1279. doi: 10.3390/rs10081279
Citores, L., Ibaibarriaga, L., Lee, D. J., Brewer, M. J., Santo, M., and Chust, G. (2020). Modelling species presence - absence in the ecological niche theory framework using shape-constrained generalized additive models. Ecol. Model. 418:108926. doi: 10.1016/j.ecolmodel.2019.108926
Dickore, B. W. (1995). Revision and chorology of monocotyledonae of the Karakorum. Flora Karakorumensis I. Angiospermac, Monocotyledonae. Stapfia (Linz) 39:298. b App. (in German).
Elith, J., and Leathwick, J. R. (2009). Species distribution models: ecological explanation and prediction across space and time. Ann. Rev. Ecol. Evol. Syst. 40, 677–697. doi: 10.1146/annurev.ecolsys.110308.120159
Gao, S., Liu, Z. G., Xu, J. F., Mutz, S. G., He, S. Y., and Gao, S. B. (2013). Research on fault diagnosis for traction transformer on the basis of model-based diagnosis and expert system. J. China Railw. Soc. 35, 42–49.
Gao, J., and Li, X. (2016). Degradation of frigid swampy meadows on the Qinghai-Tibet plateau: current status and future directions of research. Prog. Phys. Geogr. 40, 794–810. doi: 10.1177/0309133316659283
Halvorsen, K., Arndt, A., Rosdahl, H., and Thorstensson, A. (2012). Evaluation of three different models of the shoulder kinematics: application to kayak paddling.
Han, L. C. A. (2001). Method of modifying error for non-synchronicity of grass yield remote sensing estimation and measurement. Int. J. Remote Sens. 22, 3363–3372. doi: 10.1080/01431160010006421
He, Q. (2008). Neural Network and Its Application in IR. Graduate School of Library and Information Science. Champaign, IL, USA: University of Illinois at Urbana-Champaign Spring.
Lehnert, L. W., Meyer, H., Wang, Y., Miehe, G., Thies, B., Reudenbach, C., et al. (2015). Retrieval of grassland plant coverage on the Tibetan plateau based on a multi-scale, multi-sensor and multi-method approach. Remote Sens. Environ. 164, 197–207. doi: 10.1016/j.rse.2015.04.020
Li, J. M., Ehlers, T. A., Werner, M., Mutz, S. G., Steger, C., and Paeth, H. (2016). Late quaternary climate, precipitation δ18O, and Indian monsoon variations over the Tibetan plateau. Earth Planet. Sci. Lett. 457, 412–422. doi: 10.1016/j.epsl.2016.09.031
Li, X., Gao, J., Brierley, G., Qiao, Y., Zhang, J., and Yang, Y. (2013). Rangeland degradation on the Qinghai-Tibet plateau: implications for rehabilitation. Land Degrad. Dev. 24, 72–80. doi: 10.1002/ldr.1108
Li, W. K., and Guo, Q. H. (2013). How to assess the prediction accuracy of species presence-absence models without absence data? Ecography 6, 788–799. doi: 10.1111/j.1600-0587.2013.07585.x
Li, L., Hang, Y., Liu, L., Wu, J., Li, S., Zhang, H., et al. (2018). Current challenges in distinguishing climatic and anthropogenic contributions to alpine grassland variation on the Tibetan plateau. Ecol. Evol. 8, 5949–5963. doi: 10.1002/ece3.4099
Li, R., Luo, T., Mölg, T., Zhao, J., Li, X., Cui, X., et al. (2016). Leaf unfolding of Tibetan alpine meadows captures the arrival of monsoon rainfall. Sci. Rep. 6:20985. doi: 10.1038/srep20985
Li, S., Wu, J., Gong, J., and Li, S. (2017). Human footprint in Tibet: assessing the spatial layout and effectiveness of nature reserves. Sci. Total Environ. 621, 18–29. doi: 10.1016/j.scitotenv.2017.11.216
Li, W., Xue, Z., Guo, S., Xu, D., Fan, C., and Zhang, J. (2010). Vegetation coverage changes and analysis of the driving forces in Maqu county based on 3S technology. J. Lanzhou Univ. 46, 85–95.
Lin, L. (2017). Response and Adaptation of Plant-Soil System of Alpine Meadows in Different Successional Stages to Grazing Intensity. PHD thesis, Gansu Agricultural University, Lanzhou, China
Liu, C., White, M., and Newell, G. (2013). Selecting thresholds for the prediction of species occurrence with presence-only data. J. Biogeogr. 40, 778–789. doi: 10.1111/jbi.12058
Liu, S., Zamanian, K., Schleuss, P., Zarebanadkouki, M., and Kuzyakov, Y. (2018). Degradation of Tibetan grasslands: consequences for carbon and nutrient cycles. Agric. Ecosyst. Environ. 252, 93–104. doi: 10.1016/j.agee.2017.10.011
Lv, Y., Zhao, X. Q., Zhang, S. R., Zhang, J. G., Yue, K. T., Meng, B. P., et al. (2022). Herbaceous dominant the changes of normalized difference vegetation index in the transition zone between desert and typical steppe in Inner Mongolia, China. Front. Plant Sci. 12:2044. doi: 10.3389/fpls.2021.832044
Ma, Z., Liu, H., Mi, Z., Zhang, Z., Wang, Y., Xu, W., et al. (2017). Climate warming reduces the temporal stability of plant community biomass production. Nat. Commun. 8:15378. doi: 10.1038/ncomms15378
Ma, L., Mi, C., Qu, J., Ge, D., Yang, Q., and Wilcove, D. S. (2021). Predicting range shifts of pikas (Mammalia, Ochotonidae) in China under scenarios incorporating land use change, climate change and dispersal limitations. Divers. Distrib. 27, 2384–2396. doi: 10.1111/ddi.13408
Meng, B. P., Gao, J. L., Liang, T. G., Cui, X., Yin, J. P., Feng, Q. S., et al. (2018). Modeling of alpine grassland cover based on unmanned aerial vehicle technology and multi-factor methods: a case study in the east of Tibetan plateau. China. Remote Sens. 10:320. doi: 10.3390/rs10020320
Meng, B. P., Liang, T. G., Yi, S. H., Yin, J. P., Cui, X., Ge, J., et al. (2020). Modeling alpine grassland above ground biomass based on remote sensing data and machine learning algorithm: a case study in the east of Tibetan plateau, China. IEEE J. Sel. Top. Appl. Earth Observ. 13, 2986–2995. doi: 10.1109/JSTARS.2020.2999348
Meng, B., Yang, Z., Yu, H., Qin, Y., Sun, Y., Zhang, J., et al. (2021). Mapping of Kobresia pygmaea community based on unmanned aerial vehicle technology and gaofen remote sensing data in alpine meadow grassland: a case study in eastern of Qinghai-Tibetan plateau. Remote Sens. 13:2483. doi: 10.3390/rs13132483
Miehe, G., Miehe, S., Kaiser, K., Jianquan, L., and Zhao, X. (2008). Status and dynamics of the Kobresia pygmaea ecosystem on the Tibetan plateau. Ambio: J. Hum. Environ. 4:37.
Miehe, G., Bach, K., Miehe, S., Kluge, J., Yang, Y., Duo, L., et al. (2011). Alpine steppe plant communities of the Tibetan highlands. Appl. Veg. Sci. 14, 547–560. doi: 10.1111/j.1654-109X.2011.01147.x
Miehe, G., and Miehe, S. (2005). Environmental changes in the pastures of Xizang. Marburger Geographische Schriften. 135, 282–311.
Miehe, G., Schleuss, P., Seeber, E., Babel, W., Biermann, T., Braendle, M., et al. (2019). The Kobresia pygmaea ecosystem of the Tibetan highlands - origin, functioning and degradation of the world's largest pastoral alpine ecosystem Kobresia pastures of Tibet. Sci. Total Environ. 648, 754–771. doi: 10.1016/j.scitotenv.2018.08.164
Muoz, M. E. D. S., Giovanni, R. D., Siqueira, M. F. D., Sutton, T., Brewer, P., Pereira, R. S., et al. (2011). Open Modeller: a generic approach to species' potential distribution modelling. Geo Informatica. 15, 111–135.
Petitpierre, B., Broennimann, O., Kueffer, C., Daehler, C., and Guisan, A. (2017). Selecting predictors to maximize the transferability of species distribution models: lessons from cross-continental plant invasions. Glob. Ecol. Biogeogr. 26, 275–287. doi: 10.1111/geb.12530
Phillips, S., Anderson, R., and Schapire, R. (2006). Maximum entropy modeling of species geographic distribution. Ecol. Model. 190, 231–259. doi: 10.1016/j.ecolmodel.2005.03.026
Stockwell, D., and Peters, D. (1999). The GARP modelling system: problem and solution to automated spatial prediction. Int. J. Geogr. Inf. Sci. 13, 143–158. doi: 10.1080/136588199241391
Su, Y., Guo, Q., Hu, T., Guan, H., Jin, S., An, S., et al. (2020). An updated vegetation map of China (1:1000000). Sci. Bull. 65, 1125–1136. doi: 10.1016/j.scib.2020.04.004
Sun, Y., Yi, S., and Hou, F. (2018). Unmanned aerial vehicle methods makes species composition monitoring easier in grasslands. Ecol. Indic. 95, 825–830. doi: 10.1016/j.ecolind.2018.08.042
Thuiller, W., Lafourcade, B., Engler, R., and Araújo, M. B. (2009). BIOMOD – a platform for ensemble forecasting of species distributions. Ecography 32, 369–373. doi: 10.1111/j.1600-0587.2008.05742.x
Verrelst, J., Camps-Valls, G., Muñoz-Marí, J., Rivera, J. P., Veroustraete, F., Clevers, J. G. P. W., et al. (2015). Optical remote sensing and the retrieval of terrestrial vegetation bio-geophysical properties – a review. ISPRS J. Photogramm. Remote Sens. 108, 273–290. doi: 10.1016/j.isprsjprs.2015.05.005
Wang, S., Duan, J., Xu, G., Wang, Y., Zhang, Z., Rui, Y., et al. (2012). Effects of warming and grazing on soil n availability, species composition, and ANPP in an alpine meadow. Ecology 93, 2365–2376. doi: 10.1890/11-1408.1
Wang, P., Lassoie, J., Morreale, S., and Dong, S. (2015). A critical review of socioeconomic and natural factors in ecological degradation on the Qinghai-Tibetan plateau, China. Rangeland J. 37:1. doi: 10.1071/RJ14094
Wen, Q., Zhang, Z., Liu, S., Wang, X., and Wang, C. (2010). Classification of grassland types by modis time-series images in Tibet, China. IEEE J. Sel. Top. Appl. Earth Observ. Remote Sens. 3, 404–409. doi: 10.1109/JSTARS.2010.2049001
Wessels, K. J., Prince, S. D., Frost, P. E., and van Zyl, D. (2004). Assessing the effects of human-induced land degradation in the former homelands of northern South Africa with a 1 km AVHRR NDVI time-series. Remote Sens. Environ. 91, 47–67. doi: 10.1016/j.rse.2004.02.005
Wessels, K. J., Prince, S. D., Malherbe, J., Small, J., Frost, P. E., and Van Zyl, D. (2007). Can human-induced land degradation be distinguished from the effects of rainfall variability? A case study in South Africa. J. Arid Environ. 68, 271–297. doi: 10.1016/j.jaridenv.2006.05.015
Xu, Z. L., Peng, H. H., and Peng, S. Z. (2015). The development and evaluation of species distribution models. Acta Ecol. Sin. 35:5846. doi: 10.5846/stxb201304030600
Yang, K., He, J., Tang, W. J., Qin, J., and Cheng, C. C. (2010). On downward shortwave and longwave radiations over high altitude regions: observation and modeling in the Tibetan plateau. Agric. For. Meteorol. 150, 38–46. doi: 10.1016/j.agrformet.2009.08.004
Yi, S. (2017). Frag MAP: a tool for long-term and cooperative monitoring and analysis of small-scale habitat fragmentation using an unmanned aerial vehicle. Int. J. Remote Sens. 38, 1–12. doi: 10.1080/01431161.2016.1253898
Yi, S., Chen, J., Qin, Y., and Xu, G. W. (2016). The burying and grazing effects of plateau pika on alpine grassland are small: a pilot study in a semiarid basin on the Qinghai-Tibet plateau. Biogeosciences 13, 6273–6284. doi: 10.5194/bg-13-6273-2016
Zhang, Y., Gao, Q., Dong, S., Liu, S., Wang, X., Su, X., et al. (2015). Effects of grazing and climate warming on plant diversity, productivity and living state in the alpine rangelands and cultivated grasslands of the Qinghai-Tibetan plateau. Rangel. J. 37, 57–65. doi: 10.1071/RJ14080
Zhang, S. R., and Noltie, H. J. (2010). “Kobresia Willd,” in Flora of China. eds. Z. Y. Wu, P. H. Raven and D. Y. Hong (St. Louis: Science Press, Beijing, and Missouri Botanical Garden Press), 23, 269–285.
Zhou, H., Zhao, X., Zhou, L., Tang, Y., Liu, W., and Shi, Y. (2005). Application of analytic hierarchy process on the alpine grassland degradation in the source region of the Yangtze and yellow rivers. Resour. Sci. 27, 63–70.
Keywords: Kobresia pygmaea community, BIOMOD, potential distribution, alpine meadow, driving factors
Citation: Lv Y, Sun Y, Yi S and Meng B (2023) Human activities dominant the distribution of Kobresia pygmaea community in alpine meadow grassland in the east source region of Yellow River, China. Front. Ecol. Evol. 11:1127973. doi: 10.3389/fevo.2023.1127973
Edited by:
Ben Niu, Institute of Geographic Sciences and Natural Resources Research (CAS), ChinaReviewed by:
Gang Fu, Institute of Geographic Sciences and Natural Resources Research (CAS), ChinaYanan Cao, Hebei University of Engineering, China
Copyright © 2023 Lv, Sun, Yi and Meng. This is an open-access article distributed under the terms of the Creative Commons Attribution License (CC BY). The use, distribution or reproduction in other forums is permitted, provided the original author(s) and the copyright owner(s) are credited and that the original publication in this journal is cited, in accordance with accepted academic practice. No use, distribution or reproduction is permitted which does not comply with these terms.
*Correspondence: Baoping Meng, ✉ mengbp18@ntu.edu.cn