Genetic structure of wild rice Zizania latifolia in an expansive heterogeneous landscape along a latitudinal gradient
 Godfrey Kinyori Wagutu1,2,3
  Xiangrong Fan1,4,5
  Wenlong Fu1,2 Miriam Chepkwemoi Tengwer1,2,3
  Wei Li1
  Yuanyuan Chen1*
- 1Key Laboratory of Aquatic Botany and Watershed Ecology, Wuhan Botanical Garden, Chinese Academy of Sciences, Wuhan, China
- 2University of Chinese Academy of Sciences, Beijing, China
- 3Sino-Africa Joint Research Center, Chinese Academy of Sciences, Wuhan, China
- 4College of Science, Tibet University, Lhasa, China
- 5Research Center for Ecology and Environment of Qinghai-Tibetan Plateau, Tibet University, Lhasa, China
Global aquatic habitats are undergoing rapid degradation and fragmentation as a result of climate change and changes in land use. Understanding the genetic variability and adaptive potential of aquatic plant species is thus important for conservation purposes. In this study, we investigated the genetic diversity and structure of the extant natural populations of Zizania latifolia from five river basins in China based on 46 microsatellite markers. We tested isolation by environment (IBE), isolation by resistance (IBR), and isolation by distance (IBD) patterns using a reciprocal causal model (RCM). Furthermore, we elucidated the impact of the environment on Z. latifolia genetic diversity using generalized linear models (GLMs) and spatially explicit mixed models. Low genetic diversity (HE = 0.125–0.433) and high genetic differentiation (FST = 0.641, Øpt = 0.654) were found. Higher historical gene flow (MH = 0.212–2.354) than contemporary gene flow (MC = 0.0112–0.0247) and significant bottlenecks in almost all populations were identified, highlighting the negative impact of wetland fragmentation. The IBE model was exclusively supported for all populations and in three river basins. The IBD and IBR models were supported in one river basin each. The maximum temperature of the warmest month and precipitation seasonality were the plausible environmental parameters responsible for the observed pattern of genetic diversity. Local adaptation signatures were found, with nine loci identified as outliers, four of which were gene-linked and associated with environmental variables. Based on these findings, IBE is more important than IBD and IBR in shaping the genetic structure of Z. latifolia.
Introduction
Migration and adaptation are two main strategies that plants use to resist unfavorable climate alterations. The knowledge about genetic structure and dispersal modes are of important implications for the fate of plants after migration. The higher genetic homogeneity among populations, due to frequent gene exchange, may indicate that individuals are less dependent on local conditions and may be able to survive in different areas. On the other hand, some species show obvious genetic differentiation and develop local adaptations due to selective pressures associated with particular local habitats (Bischoff et al., 2006). In this case, plant fitness will be greatly impacted when environmental changes occur rapidly. Additionally, the adverse effects of climate change on plant diversity will be exacerbated by habitat fragmentation from land-use change and excessive exploitation. Aquatic habitats are often discontinuous and sandwiched between terrestrial habitats. Furthermore, given that most aquatic plants persist as meta-populations, their long-term survival depends on continuous gene flow among populations (Barrett et al., 1993; Santamaría, 2002). It is conceivable that the survival of aquatic plants will face more severe tests with increasing climate warming and habitat fragmentation. Therefore, investigating the dispersal and adaptability of aquatic plants will help predict their response to future climatic changes and formulate reasonable management strategies.
It is important to examine the factors affecting genetic patterns, especially when the natural environments are changing at an alarming rate. In discontinuous habitats, the gene flow is usually not enough to offset the alleles lost through genetic drift and inbreeding associated with habitat fragmentation. This situation leads to “isolation by distance,” (IBD) where geographical distance limits gene flow (Wright, 1943). Migration involves the physical dispersal of propagules and successful establishment. However, significant genetic differentiation has occasionally been found among adjacent populations with different climates or soil conditions (Zhao et al., 2013). Due to long-term growth in special habitats, native plants have developed specific genotypes to adapt to local environments, which results in unsuccessful colonization for migrant plants. Thus, the IBD model sometimes underestimates the effects of environmental variables, and researchers propose the “isolation by environment” (IBE) model, which considers the contribution of environmental heterogeneity in shaping the distributions of spatial genetic variation (Wang and Bradburd, 2014). Widespread species are often distributed in habitats with distinct climatic conditions. Selective pressures can lead to strong differentiation of allele frequencies in some loci which will deviate from the equilibrium model and are considered to be potentially adaptive. Outlier loci detection and environmental association tests allow for the identification of such alleles, providing further evidence for IBE. The development of landscape genetics and map theory has made it easier to obtain landscape features (topographic and environmental characteristics) of habitats which are used to evaluate dispersal difficulties through different habitats. Based on this, McRae (2006) described isolation by resistance (IBR) as where resistance reflects the difficulty exerted by landscape features on gene flow.
Although these models (IBD, IBE, and IBR) often work together in forming genetic differentiation of species, especially for widespread species, most empirical research on population genetics has focused on geographical distance and topographical features as the main drivers, ignoring the contribution of environmental factors (Orsini et al., 2013).
To identify the most probable models for observed genetic structure, Cushman and Landguth (2010) introduced an analytical framework, the reciprocal causal model (RCM), for competing the three hypotheses simultaneously. The framework is based on Mantel tests (Mantel, 1967), where partial Mantels are first performed, and the resultant values are used to build the RCM. This approach reduces the simple Mantels' spurious correlations and false-positive errors. For the identification of the contribution of specific environmental variables to genetic diversity, especially in a spatial auto-correlation scenario, Rousset and Ferdy (2014) proposed an improved spatially explicit generalized linear mixed modeling (spatial GLMMs) method, implemented in R package spaMM. This allows for the accurate comparison of a null model (spatial as the random effect) vs. a full model (spatial and environmental variable as random effects), unlike the conventional methods, such as glmmPQL that do not fit a null model (Rousset and Ferdy, 2014).
For widespread species, genetic differentiation is prevalent and local adaptation is probable. While IBD is expected in such populations, the role of unique environment niches could be overlooked. The inclusion of environmental factors can improve ecological studies of different organisms and ecosystems while monitoring their biological implications has application in the development of environmental-conscious policies (Wu et al., 2022). Ecological niche models (ENMs) have been used to explore the role of ecology on the current and future distribution of aquatic species (Nzei et al., 2021; Ngarega et al., 2022). Traditional ENMs assumed that populations of a species are genetically uniform and share the same niche, ignoring the possibility of local adaptation, especially for widespread species (Wiens et al., 2009). Evidence for environment-associated gene-linked loci in a widespread species could be an indication of local adaptation. When an IBE pattern is also found, genetically-informed ENMs (gENMs) can be used to supplement this evidence through the investigation of niche differentiation (divergence or conservatism) (Ikeda et al., 2017; Bothwell et al., 2021).
Zizania latifolia (Griseb.) Turcz. Ex Stapf, a perennial aquatic grass commonly known as the Chinese wild rice, belongs to the family Poaceae, tribe Oryzeae. It is a partially clonal species that is an important ecological and genetic resource in China (Liu et al., 1999, 2007; Yu et al., 2006; Zhou et al., 2007; Shen et al., 2011; Peng et al., 2013; Wang et al., 2013). Natural populations of Z. latifolia are distributed in the East of China along a wide stretch of latitudinal zones (21°-50°N). This region spans five major eco-geographic regions with varying biotic and abiotic factors that could influence species gene flow and local adaptation (Wu et al., 2003). To date, the genetic differentiation of wild rice across China has been attributed to IBD (Chen et al., 2017a; Zhao et al., 2018, 2019). This is despite the fact that the distribution of wetlands in China is characterized by heterogeneous landscapes and environments, besides being expansive and patchy. Therefore, such a wetland distribution pattern presents an opportunity to study the landscape genetics of a widespread species.
Based on the distribution of Z. latifolia in China, we hypothesized that IBE would best explain its genetic structure and that genetic variability is influenced by the environment. The objective was to test three gene flow models, IBE, IBD, and IBR using RCM, and the contribution of environmental variables to genetic diversity patterns using spatial GLMMs. This study would aid in delineating the impact of human- and climate-change-induced habitat degradation on the genetic structure of riparian plants at different spatial and environmental gradients. Furthermore, the environmental gradient provides a perfect model for space-for-time substitution in assessing the long-term aquatic ecosystem response to the changing environment.
Materials and methods
Study design
Twenty-eight natural populations of Z. latifolia, covering above 30 latitudes (N 20°21′ - 50°54′), were collected across China from five river basins: Heilongjiang River Basin, Liaohe River Basin, Huanghe River Basin, Yangtze River Basin, and Pearl River Basin (Table 1) in the autumn of 2015. For each population, young and healthy leaves of 20–23 individuals were collected at intervals of at least 10 m to avoid sampling the same clone. The leaves were dried with silica gel and taken back to the laboratory for DNA extraction.
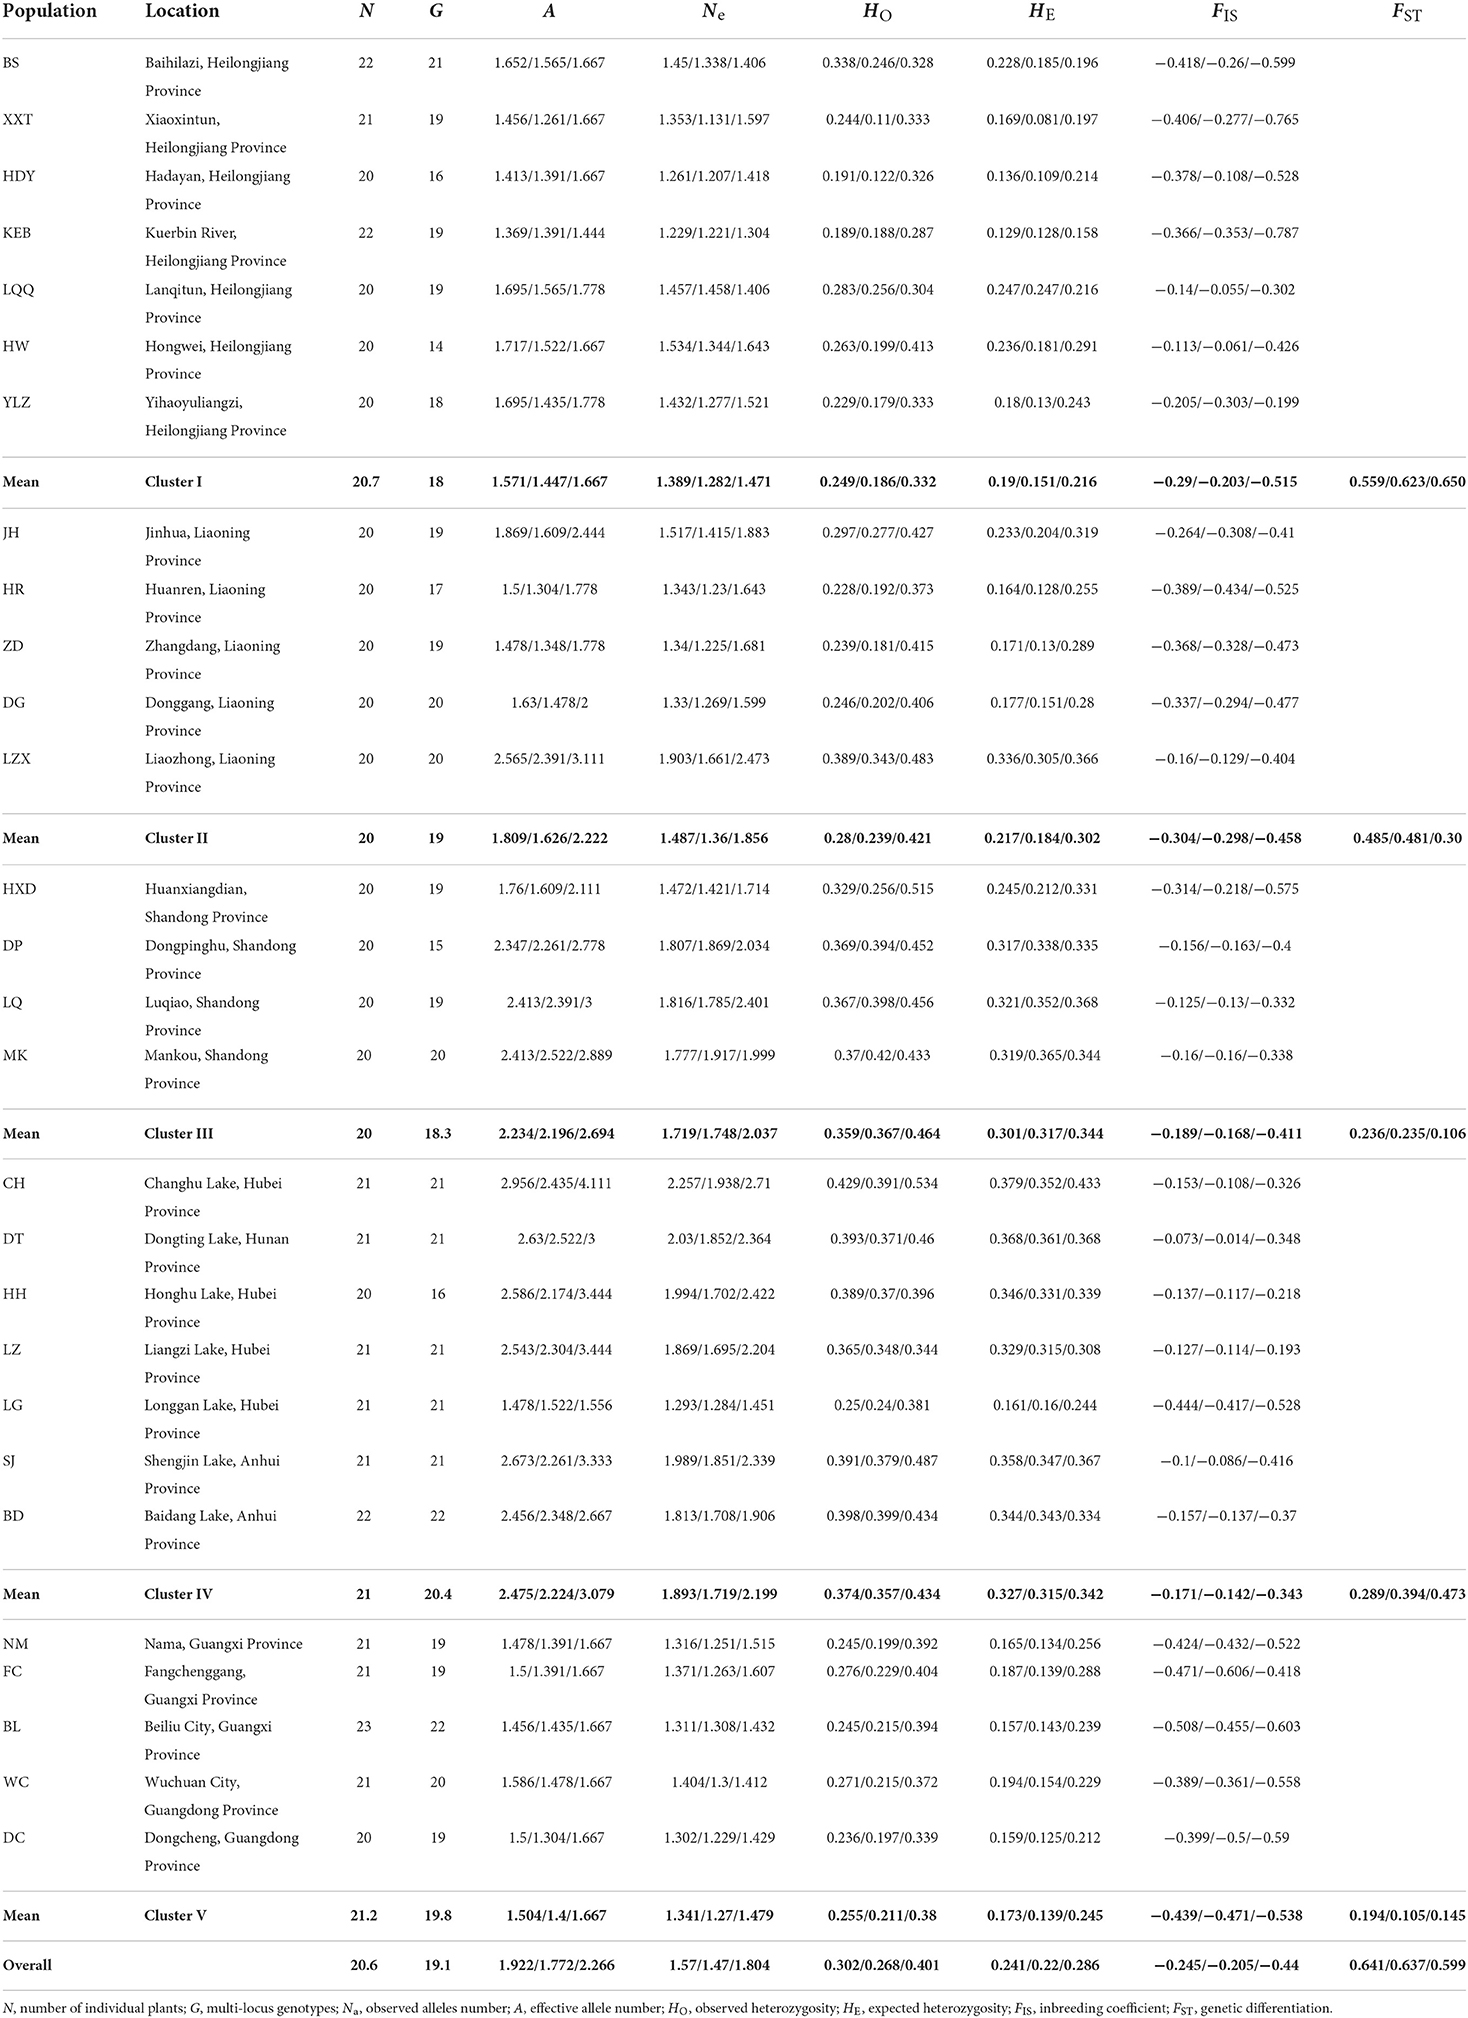
Table 1. Geographical information and summary of genetic diversity measures for 28 Zizania latifolia populations based on 46 simple-sequence repeat (SSR) loci/23 neutral loci/9 outlier loci.
Total genomic DNA was extracted from 0.5 g of dried leaves using a modified cetyltrimethylammonium bromide (CTAB) protocol with a 3 × CTAB buffer (Doyle and Doyle, 1987). After screening, 46 simple-sequence repeat (SSR) markers with polymorphic and clear bands were used in this study, including 26 genomic SSR (gSSR) (Richards et al., 2007; Quan et al., 2009; Wang et al., 2015; Wagutu et al., 2020a) and 20 expressed sequence tag SSR (EST-SRR) developed from Z. latifolia transcriptome data available at NCBI (SRX796501) following our previous approach (Wagutu et al., 2020b) (Supplementary Table 1). PCR amplification was performed following the protocol by Quan et al. (2009), and PCR products were separated on a 6% denaturing polyacrylamide gel. Fragments were visualized by silver staining and alleles were scored in reference to a 25 bp DNA ladder (Promega, Madison, WI, USA).
GenoDive 2.0 (Meirmans and Van Tienderen, 2004) was used to identify the clonal structure. To identify multi-locus genotypes, we tested the commonly used thresholds for microsatellites (0–4%) (Lo et al., 2010; Gross et al., 2012; Meirmans, 2020). No significant difference (P < 0.05) was found between the diversity indices (N/G; where N is the population sample size, G is the number of clones for each population) for the thresholds tested. Additionally, considering the facts (1) we sampled each individual at a 10 m radius to avoid collecting clone mates, (2) we excluded individuals with missing data, and (3) that a non-zero threshold could lead to the assignment of individuals with different genotypes into the same clone (James and McDougall, 2014), threshold 0 was used. At threshold zero, samples were assigned to their respective clones. The number of genotypes (G) was calculated, and repeating genotypes were excluded from further analysis. FreeNA software (Chapuis and Estoup, 2007) was used to estimate the frequency of putative null alleles. R package genepop v1.1.7 (Rousset et al., 2020) was used to calculate the inbreeding coefficient (FIS), deviation from Hardy-Weinberg equilibrium, and linkage disequilibrium.
Outlier loci test
Different approaches for outlier detection have their advantages and disadvantages. To minimize the false positive, three approaches were used to detect outlier loci among all the 28 populations: (i) hierarchical Bayesian method implemented in BAYESCAN (http://cmpg.unibe.ch/software/bayescan/) with the parameters set to 10 pilot runs of 5,000 iterations each and a burn-in of 50,000 iterations. Outliers were identified based on 99% posterior probabilities. (ii) LOSITAN (Antao et al., 2008) was used to implement the method developed by Beaumont and Nichols (1996), where FST distribution was evaluated based on the observed and expected values at a 99% confidence interval. Here, an initial run with 60,000 simulations was conducted, followed by a computation of FST distribution based on putative neutral loci derived from the simulations. (iii) A coalescent simulation was implemented in DETSEL 1.0 (Vitalis et al., 2003) with the following parameters: mutation rate (infinite allele model, IAM) 0.005, 0.001, and 0.0001; ancestral population size Na = 500, 1,000, and 10,000; population size before split N0 = 100 and 500; time since an assumed bottleneck t0 = 50, 100, and 1,000 generations; and time since population split t = 100 generations. Loci outside the 99% confidence level and present in at least five combinations in the pairwise comparisons among populations were considered outliers.
Following the analysis method described by Richter-Boix et al. (2011), the locus positive in more than one test was considered a robust outlier candidate. Furthermore, the loci not significant in all approaches were considered to be neutral. We obtained three data sets, including all loci (46), loci under selection (9), and neutral loci (23). The genetic variation and population divergence were calculated based on all three data sets. Simulated demographical process and gene flow were estimated for the neutral loci only.
Environmental association analysis
Simple-sequence repeat markers that were detected as outliers in more than one of the three methods used (Bayescan, Lositan, and Detsel) were used to perform genetic-environment association using the SAM approach implemented in samβada (Joost et al., 2007; Stucki et al., 2017). The SAM method uses a logistic regression model to identify the association between marker alleles (individuals coded as either present/absent for each of the marker alleles) and environmental variables across the sampling locations. The best model was selected based on significant G and Wald tests after Bonferroni correction at a 99% confidence level (Joost et al., 2007). To supplement the SAM method, we investigated the evidence for the environmental contribution to allele frequency distribution, where outlier SSR markers were evaluated for the environmental association as described by Bradbury et al. (2013). In brief, genotype data, excluding rare and fixed alleles of frequency 0.05 and 0.95, respectively, were coded into Hapmap format for loading to Tassel 5 software (Bradbury et al., 2007). The standardized 20 environmental variables and their first principal component (PC1 accounting for 99.32% variation) were used. Genetic distance calculated from the non-outlier gSSR and EST-SSR in GenAlEx 6.5 (Peakall and Smouse, 2012) was used as a covariant to control for the effect of genetic structure on association. A mixed linear model (MLM) was fit, and a significant association was considered at P < 0.01 after false discovery rate (FDR) correction. Loci that were significantly associated with environmental variables were considered to be under selection. Their putative identity and role were determined through BLASTx analysis in NCBI and annotated using BLAST2GO v.6.0.1 (Conesa and Götz, 2008).
Genetic variation
Genetic diversity across the loci for each population and for each locus was estimated in terms of observed and expected heterozygosity (HO and HE), the effective number of alleles (Ne), the total number of alleles (A, allelic diversity), and the number of private alleles (SP and SR: alleles that only occurred in one population and one region) for all the 46 loci using GenAlEx.
Genetic structure
Population genetic divergence was calculated by the estimation of FST using 999 permutations with genepop. STRUCTURE program (Pritchard et al., 2000) was used to perform Bayesian clustering analysis. Ten independent runs for each number of K clusters from 1 to 15 were performed. A total of 20,000 iterations burn-in period followed by 100,000 Markov Chain Monte Carlo (MCMC) iterations were assumed for each run with correlated allele frequencies and admixture origin assumptions. To determine the value of K, the output was interpreted with Structure Harvester (Evanno et al., 2005; Earl and vonHoldt, 2012). However, Evanno's delta K method has been reported to suffer philosophical and statistical errors (Verity and Nichols, 2016). Therefore, it was supplemented with the thermodynamic integration (TI) method (Verity and Nichols, 2016). Here, the rmaverick R package was used to estimate the true value of K by running 20 runs for K = 1–15 with a burn-in period of 10,000 iterations followed by 100,000 MCMC iterations under the admixture model. The value of K was estimated as described by Verity and Nichols (2016). To confirm the results of Bayesian clustering, principal coordinate analysis (PCoA) and neighbor-joining (NJ) trees were implemented to identify the substructure and the clustering pattern of the individuals using GenAlEx and MEGA-X (Kumar et al., 2018), respectively. Additionally, the analysis of molecular variance (AMOVA) was performed to determine the genetic variation among and within populations using ARLEQUIN (Schneider et al., 2000).
Genetic discontinuity
Taking into account our sampling strategy that could mask sub-structuring as a result of geographical distances between the river basins, the spatial Bayesian clustering implemented in the geneland R package (Guillot et al., 2011), was performed under the correlated allele frequency model with spatial uncertainty in the spatial locations fixed at 1 km and using the option to filter for the presence of null alleles. The value of K was allowed to vary from 1 to 15 for 20 independent runs each consisting of 500,000 MCMC iterations, a thinning of 100, the maximum number of nuclei in the Poisson-Voronoi tessellations fixed at 536, maximum rate of the Poisson process fixed at 150, and burn-in of 100,000 in the postprocessing. MCMC coverage was assessed by comparing the number of populations across replicate runs, with a mean posterior density as the criterion for choosing the best run. BARRIER 2.2 (Manni et al., 2004), which is based on Monmonier's maximum difference algorithm, was used to assess the genetic barriers between populations with 1,000 FST matrices generated using the diveRsity R package (Keenan et al., 2013).
Migration and bottleneck analysis
To detect recent demographic bottlenecks, BOTTLENECK v.1.2.02 (Piry et al., 1999) was used to perform the analysis under three models: stepwise mutation model (SMM), IAM, and two-phase mutation model (TPM) with 1,000 iterations using a two-tailed Wilcoxon's signed-rank test. Furthermore, the allelic frequency distribution mode was tested and the mode shift away from the L-shaped distribution indicated recent bottlenecks.
Historical gene flow (MH) was estimated using MIGRATE (Beerli et al., 2019). The analysis was performed under the Brownian motion model using Bayesian inference. Defaults settings, as recommended by Beerli (2009), were used where a single long chain was run with 20 sampling increments, 5,000 recorded steps in the chain, a burn-in of 10,000, and heating of 4 parallel chains were set to estimate Θ, and M. Gene flow (MH) was calculated as Θ × M/4, where Θ is the mutation-scaled effective population size, and M is the mutation-scaled migration rate. Contemporary gene flow (MC) was assessed using BAYESASS (Wilson and Rannala, 2003). The analysis was performed using 5,000,000 iterations with the chain sampled after 2,000 iterations. A burn-in of 1,000,000 was used and the delta values were adjusted to ensure a 40–60% acceptance rate.
Geographic and environmental influence on the genetic structure
To compare simultaneously the three gene flow models (IBD, IBR, and IBE), we used the RCM, which is based on partial Mantels, and could eliminate the simple Mantels' spurious correlations (Cushman et al., 2006). For the analysis, we obtained some parameter matrices, including genetic distance, geographic distance, environment distance, and resistance distance.
Genetic distance between populations was calculated as pairwise FST based on the three data sets (all loci, adaptive loci, and neutral loci) using genepop. Geographic distance was based on Euclidean distance and was calculated using GenAlEx.
Nineteen environmental variables were extracted for the studied sites from BioClim's 30s resolution dataset (Busby, 1991), and soil type data from http://www.isric.org/ with GIS details using ArcMap 10.5 (Esri, Redlands, CA, USA). To reduce climatic variables, principal component analysis (PCA) was performed based on 21 variables (19 bioclimatic variables, elevation, and soil type) using PAST ver. 4.01 (Hammer et al., 2001). The first principal component (PC1) represented 99.32% of the variation and was highly correlated (r > 0.9) with eight temperature-related variables (bio_1, bio_2, bio_4, bio_6, bio_7, bio_9, bio_10, and bio_11). The PC1 was thus used to calculate the environmental distance matrix with the vegan package in R (Oksanen et al., 2018).
Zizania latifolia is wind-pollinated, and its seeds are edible for native waterfowl and migratory birds, which could lead to pollen and seed dispersal among populations. Additionally, water connectivity facilitates the dispersal of Z. latifolia propagules, while wind helps in pollen and seed dispersal. Wind and hydrological connectivity were used to calculate the resistance distance. Data for bird movements are unavailable and their influence on the genetic structure was not estimated in this study.
To obtain wind resistance distance, the R package rWind (Fernández-López and Schliep, 2019) was used to extract wind direction and speed data from September 20 to October 20, 2014, considering the sample collection time (Autumn of 2015) and flowering of Z. latifolia. We calculated the conductance distance based on the wind speed and direction for the average of the 30 days and calculated the cost distance between populations.
Hydrological connectivity was calculated on a raster water layer (Yamazaki et al., 2017) that was re-classed in Arcmap 10.5 such that pixels with permanent water bodies and major rivers were assigned a value of 0, pixels with small streams and canals were assigned a value of 1, while dry land pixels were assigned a value of 2. Pairwise least-cost distance between populations was then calculated using the gdistance R package.
Based on the four distance matrices, the RCM method was used to compare the different gene flow models. First, partial Mantel was performed between genetic (Gen) and geographic distances to test IBD and to partial out IBR (Gen~IBD|IBR); second, partial Mantel was performed between the Gen and resistance matrices to test IBR and to partial out the IBD (Gen~IBR|IBD). The difference between the contribution of geographical distance excluding the resistance and the resistance excluding the geographical distance is the score showing support for IBD when compared to IBR (Cushman et al., 2013a). If the score is positive, IBD is supported, and a zero or negative score supports IBR. The vice versa is also true. The full matrix of the partial Mantel test differences between pairs of alternative hypotheses was computed. A hypothesis was regarded as fully supported, independent of all alternatives if all the values in its column were positive and all the values in the row were negative (Cushman et al., 2013a,b). Correlation values and significance values for the partial Mantel model combinations were calculated through 9,999 corrected permutations using the vegan R package. The RCM analysis was performed for the entire data set and for each ecoregion, which corresponds to the clusters identified by the different methods.
We further evaluated the relationship between genetic diversity estimators and geographic and environmental variables through generalized linear models (GLMs) using the PAST software, and spatially explicit mixed modeling (Morente-López et al., 2018) using the spaMM R package. First, GLMs were used to explore the contribution of each environmental variable to genetic diversity estimators (HO, HE, and A). Second, spatial GLMMs were developed using genetic, geographic (coordinates), and environmental data. Here, we used genetic diversity estimators (HO, HE, and A) as response variables, each of the 21 environmental variables as fixed effects, and geographical coordinates as random effects. We transformed environmental variables as required, including using their squared values to account for non-linearity. Full models (e.g., [A ~ bio_1 + (1|lat+long)]) and null models (e.g., [A ~ 1 + (1|lat+long)]) were tested for associated likelihood ratio to obtain the P-value.
Genetically informed ecological niche modeling
With the realization that IBE was the supported model in the entire study site and 3 of the 5 river basins, and that our sampling strategy could have increased the bias toward IBE and against IBD, we supplemented the RCM analysis with genetically informed ecological niche models (gENMs). Besides our 28 geo-referenced collections, we obtained 131 occurrence records from the Global Biodiversity Information Facility (GBIF, http://www.gbif.org/). The GBIF occurrence records were assigned to one of the five genetic clusters identified by spatial analysis in geneland. The geneland probability surface maps for each cluster were georeferenced in QGIS (QGIS Development Team, 2009) and GBIF occurrence records were overlaid on the maps. Occurrences within ≥70% posterior probability contours were assigned to the respective clusters since the range was non-overlapping for any of the cluster populations. To model for the current distribution of the genetic populations, 19 bioclimatic variables (similar to those used in EAA) were used. First, we tested and removed highly correlated variables (Pearson correlation coefficient, r > 0.8) and those retained were verified for variance inflation factor (VIF) <5. To test for climate niche differentiation, we performed PCA on standardized climatic variables followed by permutational multivariate analysis of variance (perMANOVA) in the vegan R package (Bothwell et al., 2021). Furthermore, the ANOVA followed by Turkey's pairwise test of significant difference among groups was performed to explore the unique contribution of each bioclimatic variable to genetic group variations.
Following the approach by Bothwell et al. (2021), we developed ENMs using Maxent 3.4.4 (Phillips et al., 2006), since it performs better with presence-only data. One model was generated using all occurrence records for Z. latifolia and assuming no genetic structure, and the other five models were generated for each of the genetic groups (gENMs). Model performance was evaluated using the area under the receiver operating characteristic curves (AUC) and partial receiver operating characteristic curves (pROC) (Peterson et al., 2008).
Widely distributed species persist in varied environmental and geographical spaces resulting in restricted gene flow, local adaptation, and niche divergence. We tested for niche overlap and divergence among the 5 gENMs to determine if each group occupies distinct niches in the geographical space or they exhibit niche conservatism. For this, we performed a niche overlap test using Schoener's D statistic and implemented niche identity tests in ENMTools 1.4.4 (Warren et al., 2008, 2021) using 99 pseudo-replicated ENMs from pooled, randomized occurrence records for each genetic cluster pair.
Results
SSR genotyping
From 578 individuals used in this study, 536 multi-locus genotypes (MLGs) were identified, and no genotype was shared among populations. In nine populations, every individual had a unique genotype (Table 1). The individuals with clonal genotypes were excluded from further analysis. We detected 371 alleles across the 46 SSR markers, with an average of 8.1 alleles per locus. Among these loci, four gSSR markers showed a large number of alleles per locus with 28 (ZL4 and ZL5), 29 (ZL3), and 30 (ZL1) alleles per locus; five EST-SSR markers (EZ73, EZ75, EZ89, EZ121, and EZ131) only manifested 2 alleles per locus; 40 SSR markers showed private alleles unique to each of the 5 regions (Supplementary Table 2).
Null alleles were present in 87 of 1,288 population-loci combinations, which is slightly above the expected 64 by chance at a 5% significance level. The null alleles were not associated with any loci or population and there was no significant bias in FST estimation on the data compared to the estimate based on ENA correction (t-test, P = 0.873). The entire data set deviation from Hardy– Weinberg equilibrium (HWE) was detected at P = 0.05, which is expected for the natural population at a broad geographical scale (Garnier-Géré and Chikhi, 2013). Exact tests for LD indicated a significant deviation for 62 (P < 0.05) of 680 possible comparisons. This was slightly higher than that expected by chance (34 at P < 0.05). However, the significant tests involved different locus pairs indicating that loci were unlinked and statistically independent of each other.
Neutrality tests, associations between adaptive loci, and environmental variables
Among the 46 SSR loci amplified, a total of 19, 7, and 7 were detected as outlier loci by BAYESCAN, LOSITAN, and DETSEL, respectively (Figure 1A). Of these loci, 9 that were detected by two outlier tests were considered adaptive loci. The SAM analysis found that five of the nine loci tested were significantly associated with 17 environmental variables (Figure 1A). Three of the loci (EZ78, EZ81, and EZ121) showed the highest significant association with five temperature-related environmental variables (Figure 1B). The other two loci (EZ57 and EZ109) were associated with 15 variables both precipitation- and temperature-related (Figure 1B). Similar results were found for Tassel analysis, where 7 of the 9 loci tested were significantly associated with 15 environmental variables and PC1. Among these loci, three loci (EZ78, EZ81, and EZ121) were significantly associated with 8, 14, and 15 variables, respectively, as well as with PC1. EZ57 and EZ109 were significantly associated with one variable each. Besides PC1, among the significantly associated variables include; bio_1, bio_2, bio_3, bio_4, bio_5, bio_6, bio_7, bio_8, bio_9, bio_11, bio_12, bio_13, bio_14, bio_15, bio_17, and bio_19, eleven of which are related to temperature, while five are related to precipitation. Four loci were associated with functional genes based on the top BLAST hit and their putative roles include DNA-binding transcription factor activity, protein phosphorylation, RNA splicing, and cell differentiation, respectively (Table 2).
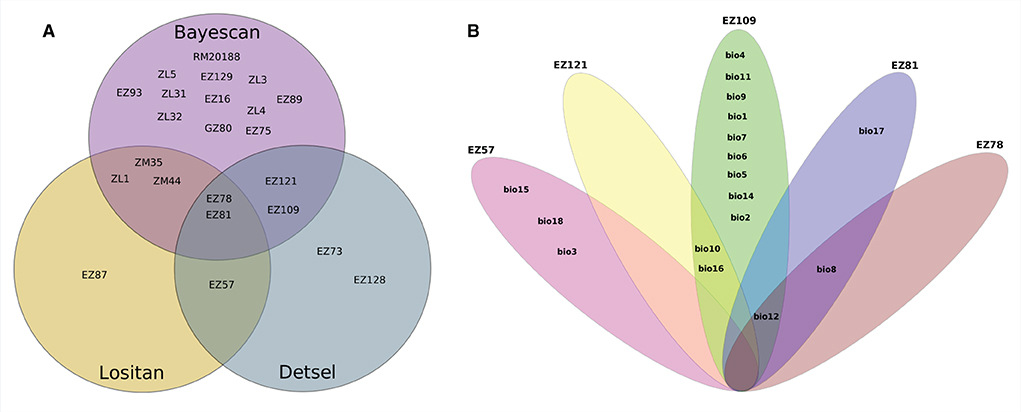
Figure 1. Summary of outlier loci and allele-environmental variables association. (A) Loci identified by each of the software, between two software and three software, respectively; (B) Environmental variables significantly associated with either of the loci and/or shared among and between loci.
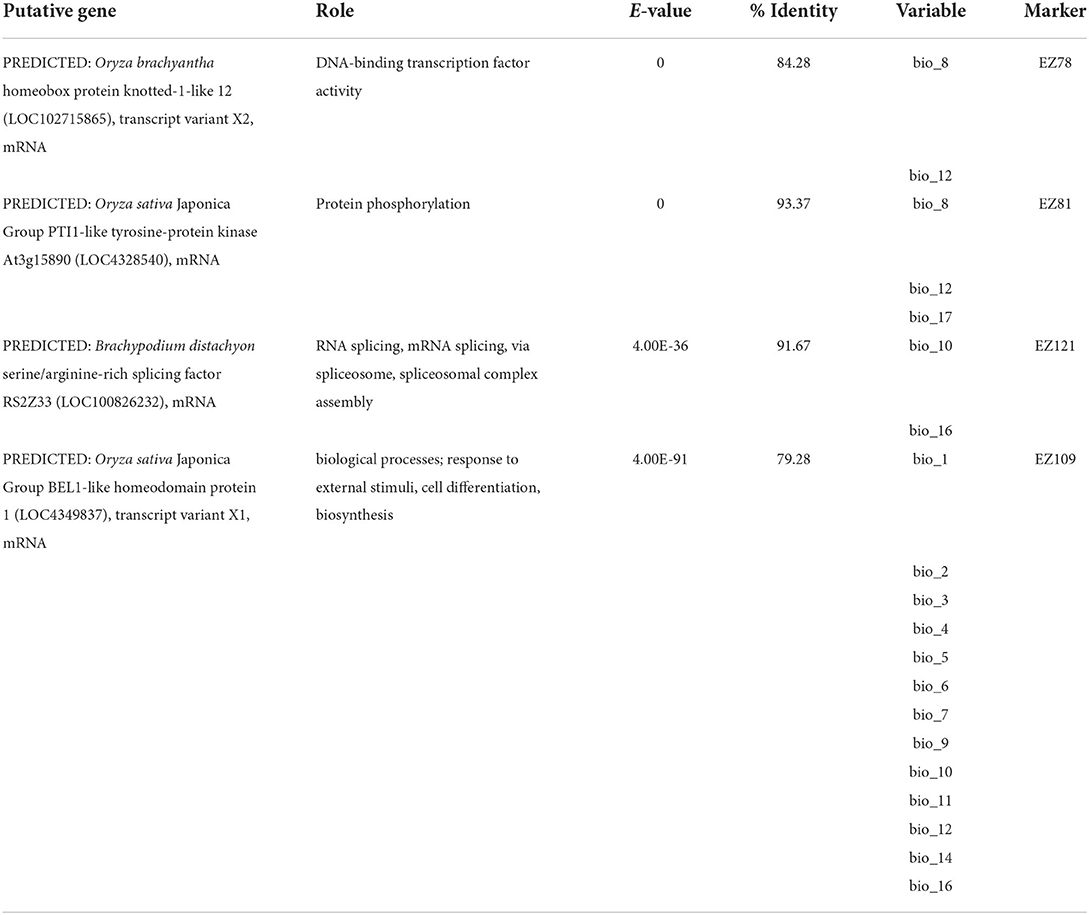
Table 2. Putative function of adaptive loci that were outliers and associated with climatic variables.
Genetic variation of populations
The genetic diversity of each population was evaluated based on all 46 SSR loci, 23 neutral loci, and 9 outlier loci. For all populations, the outlier loci and neutral loci showed the highest and lowest values of genetic variation (A, Ne, and HE) (Table 1). For the different regions, the genetic diversity increased gradually from north to south, reaching the highest value in the middle and lower reaches of the Yangtze River, and then began to decrease. The lowest and the second-lowest genetic diversity occurred in the southernmost and northernmost regions (Pearl River Basin and Heilongjiang River Basin), respectively. For each basin, the genetic variations varied greatly within the regions of the Heilongjiang River Basin and Liaohe River Basin. In the bottleneck analysis, 13, 17, and 23 populations were out of mutation-drift equilibrium under SMM, TPM, and IAM models, respectively. All populations from the Pearl River Basin showed significant bottlenecks for the 3 models (Supplementary Table 3). Wright's fixation index based on all, neutral, and adaptive loci showed that all populations displayed a heterozygote excess (Table 1).
Genetic structure and discontinuity
Obvious genetic structure was found between populations with FST = 0.641, 0.637, and 0.599 based on all loci, neutral loci, and loci under selection, respectively. Based on all loci and neutral loci, the three approaches (PCoA, NJ tree, and STRUCTURE) consistently divided the 28 populations into five clusters and populations from the same region clustered together, which showed the clear genetic divergence among the five regions (Figures 2, 3, and Supplementary Figure 1). Outlier loci showed six clusters, with the population from the expansive Yangtze River basin clustering into two groups (Figure 3). Similarly, AMOVA results based on all loci, neutral, and adaptive loci showed high population divergence (Øpt = 0.6324, 0.6546, 0.5925) (Table 3 and Supplementary Tables 4, 5). Based on neutral loci that were used to assess the landscape models, variation among populations was 65.46%, while 34.54% of the variation was within the populations, both statistically significant (P = 0.001). Inter-cluster AMOVA showed that 47.13% variation was within the clusters, 21.28% between the clusters, and 31.59% within populations (Table 4). AMOVA between populations in each cluster showed that differentiation was the highest in the north-most region (Øpt = 0.5887, P = 0.000) and decreased toward the south, reaching the lowest in the south-most region (Øpt = 0.1047, P = 0.000). Hierarchical FST analysis using neutral loci showed a similar differentiation pattern (Table 1).
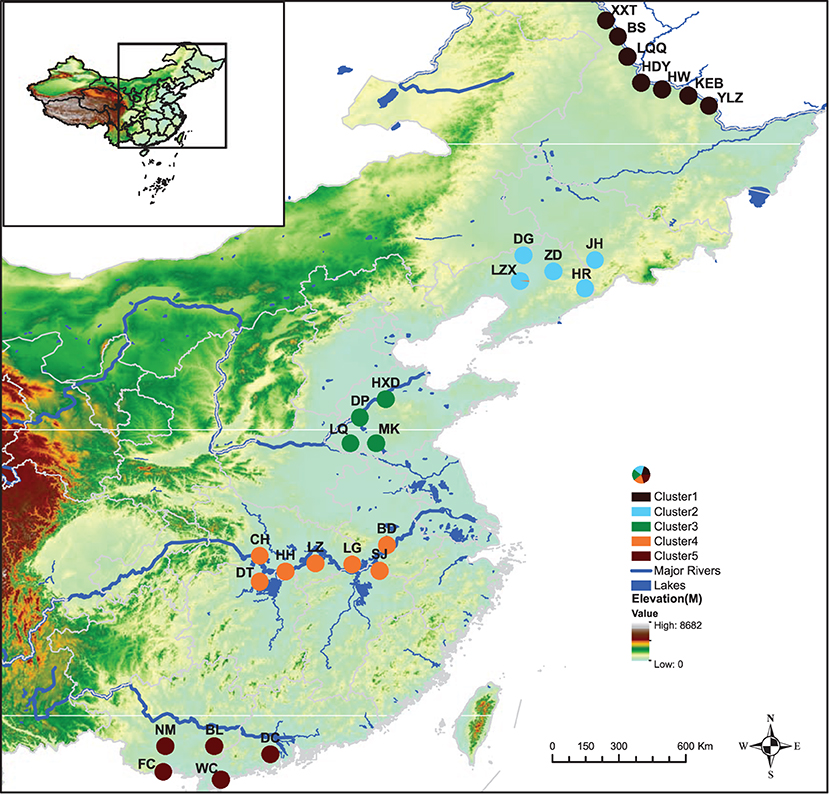
Figure 2. Geographical distribution of Zizania latifolia samples across the five (I–V) latitudinal regions in China and their respective genetic clusters each denoted by a different color.
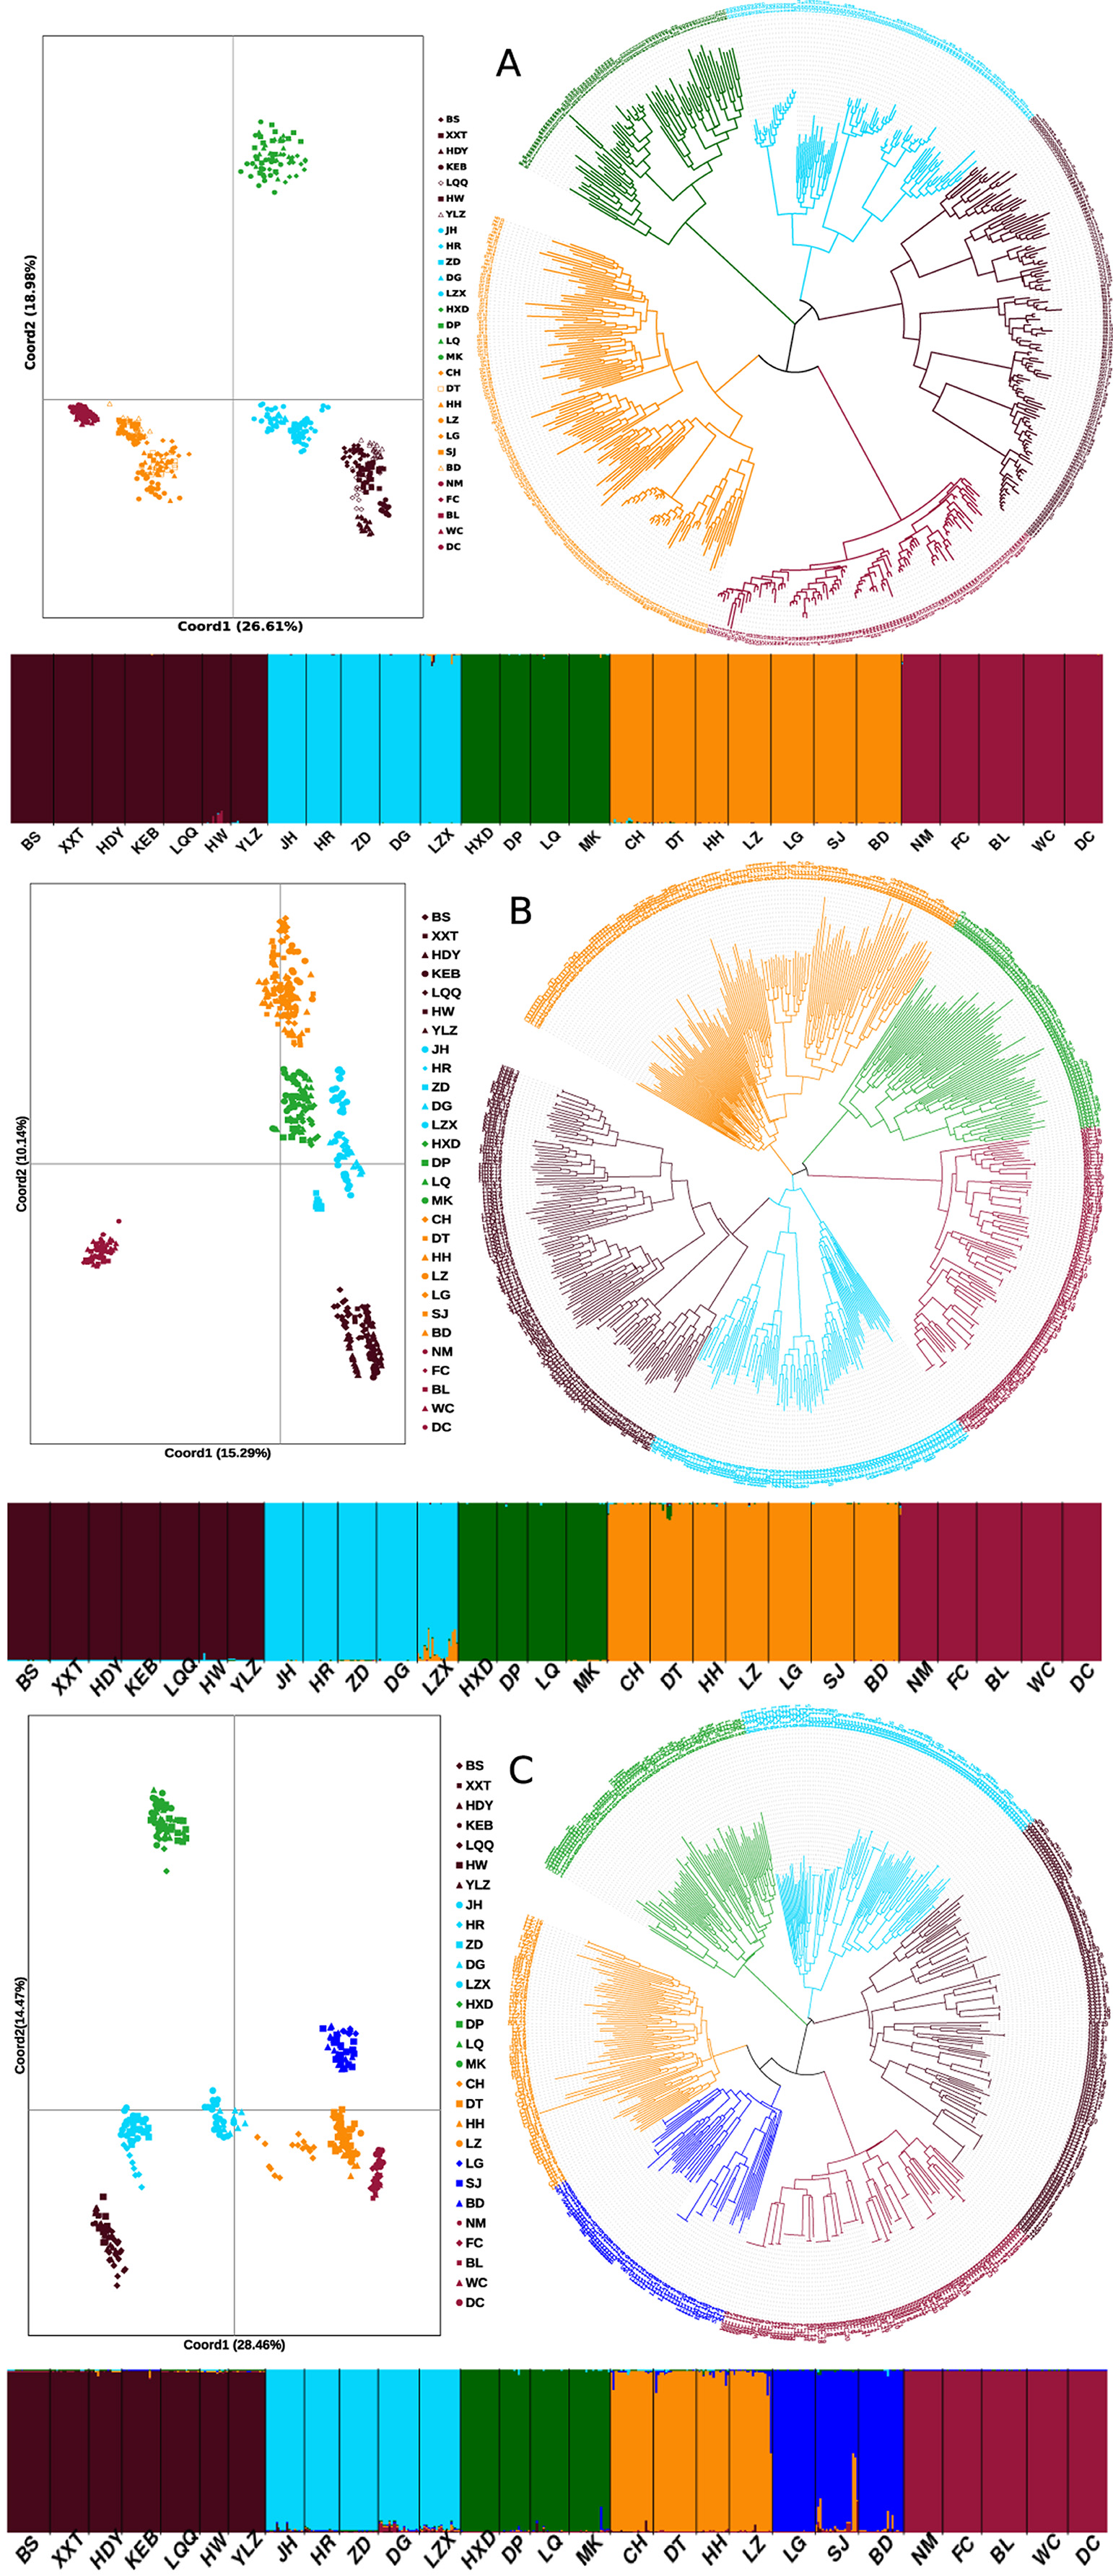
Figure 3. Genetic structure of 28 Zizania latifolia populations based on STRUCTURE, principal coordinate analysis (PCoA), and neighbor joining tree (NJ). (A) based on all loci; (B) based on neutral loci; (C) based on outlier loci. The colors represent the clusters based on STRUCTURE analysis for the histograms and NJ tree.
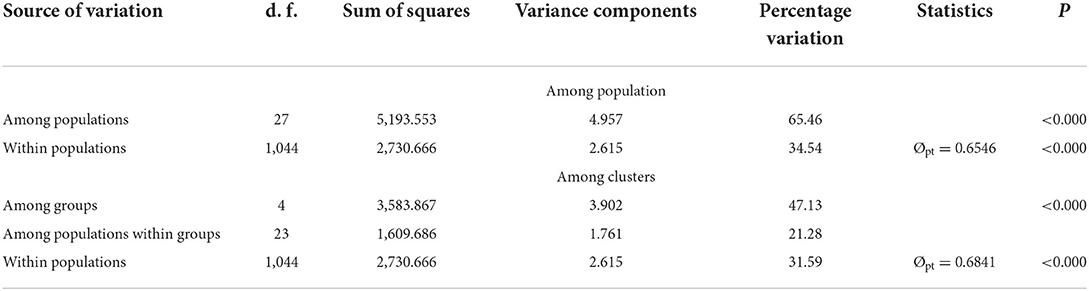
Table 3. AMOVA results based on 23 neutral loci for the 28 population of Z. latifolia across China.
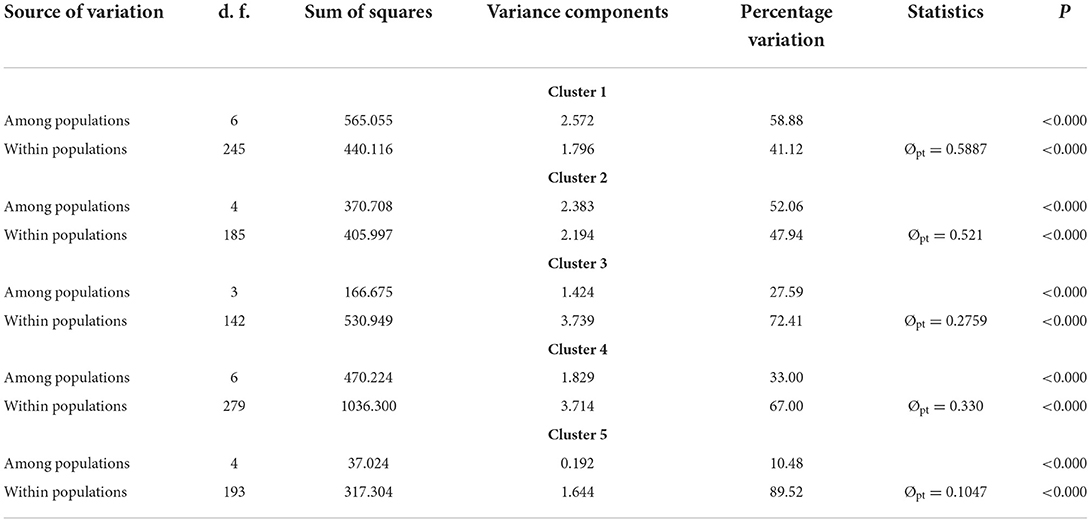
Table 4. AMOVA results for each of the inferred clusters based on 23 neutral loci.
Based on the 23 neutral loci, geneland identified five genetic clusters and populations from similar latitudes clustered together (Supplementary Figure 2). The results suggested that genetic discontinuities existed between any adjacent regions. Similar results were shown by BARRIER. Additionally, BARRIER further displayed the genetic discontinuities existing within the Heilongjiang River Basin, like barriers between populations BS and XXT, XXT and HDY, and LQQ and HW as well as around population ZD (Supplementary Figure 3).
Historical and contemporary gene flow
MIGRATE analysis based on neutral loci detected moderate historical gene flow between populations in each river basin, with the highest in Pearl River Basin ranging from 0.546 to 2.354, and the least in Heilongjiang River Basin, ranging from 0.212 to 1.136. Gene flow among the five clusters was also moderate, but higher than among the populations within clusters, ranging from 0.211 to 14.46 (Supplementary Tables 6, 7). Conversely, BAYESASS analysis revealed low contemporary gene flow in all clusters with the highest in Pearl River Basin ranging from 0.012 to 0.258 and the least in the Yangtze River Basin, ranging from 0.0112 to 0.0247. Among the clusters, contemporary gene flow was lower compared to within clusters, ranging from 0.0021 to 0.0044 (Supplementary Tables 8, 9).
Environment, geography, and landscape heterogeneity impact on genetic structure based on 23 neutral loci
Based on neutral loci, the IBE model was fully supported with respect to the relative support values of the RCM for the entire study site (Figure 4A). All column values for IBE were positive, while the row values were negative indicating that it explained the genetic structure independent of the alternative hypotheses (IBD and IBR). IBD was the second-best model explaining the genetic structure, with only one negative column value, while IBR was the least supported model. Moreover, the partial Mantel tests between genetic distance and environmental distance controlling for IBR and IBD showed significant positive correlations (Table 5).
Figure 4. Heat map for reciprocal causal model (RCM) values for the entire data set and each of the inferred clusters. (A) All population, (B) Heilongjiang River Basin, (C) Liaohe River Basin, (D) Huanghe River Basin, (E) Yangtze River Basin, (F) Pearl River Basin. Columns indicate test model and rows indicate alternative models. Each value represents the relative support for the test model. The best model has positive column values and negative/zero row values.
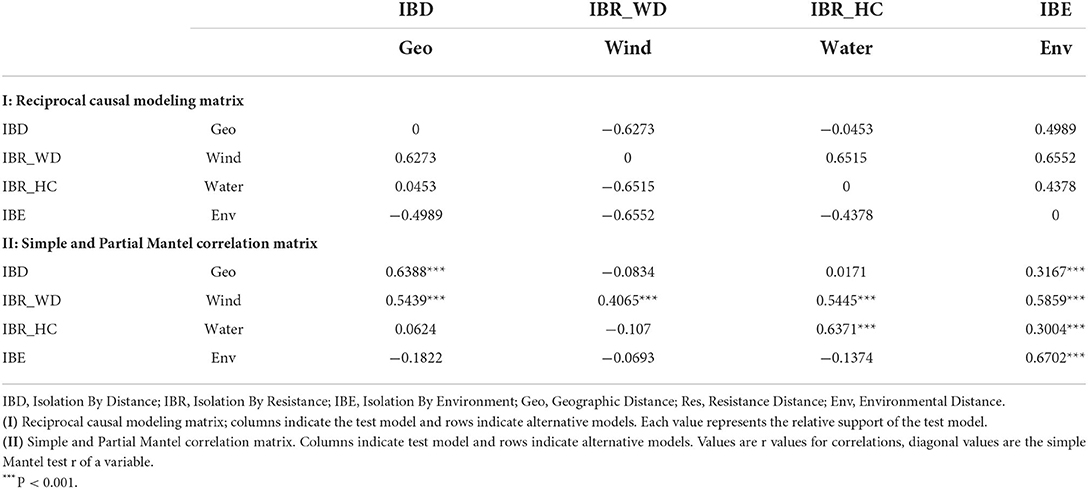
Table 5. Reciprocal causal modeling, partial, and simple Mantel results for IBD, IBR, and IBE for the 28 populations of Z. latifolia and each of the clusters based on 23 neutral loci.
It is worth noting that for all loci, neutral, and adaptive loci, IBE was the exclusively supported model. Simple Mantel tests were significant for all models based on the three data sets, but partial Mantel significance differed between the dataset, except for IBE for which all partial Mantels were significant for all loci (Table 5 and Supplementary Tables 10, 11)). The differences between simple and partial Mantels and the estimation of the best model in each of the datasets using RCM indicates its advantage over simple Mantel in landscape genetics.
Based on the neutral loci in each of the clusters, IBE was fully supported in clusters 2, 3, and 5, while in clusters 1 (populations along the Heilongjiang River Basin) and 4 (the Yangtze River Basin), IBD and hydrological connectivity model (IBR_HC) were the fully supported model, respectively. IBR_HC was the second-best model explaining the genetic structure in clusters 1, 2, and 5, while IBD was the second-best supported model in clusters 3 and 4 (Supplementary Tables 12–16).
Environmental influence on genetic diversity based on 23 neutral loci
Generalized linear models showed that 14 of the 21 environmental variables had a significant contribution to the genetic diversity of Z. latifolia. Environmental variables, bio_5, bio_10, bio_14, bio_15, and bio_17, were significantly correlated with genetic diversity estimators HO, HE, and A (Table 6). Spatially explicit linear mixed models with coordinates as random effect showed that one environmental variable (bio_5) had a significant influence on the genetic diversity estimator HE. To identify the most important environmental variables for the observed genetic variation, we tested the 14 variables showing a significant contribution to genetic diversity in GLM, for collinearity using VIF analysis (Helsen et al., 2017). Two variables, namely bio_5 (Maximum temperature of the warmest month) and bio_15 (precipitation seasonality), had VIF values below 5 and were therefore considered the best environmental variables explaining the genetic diversity patterns of Z. latifolia (Figure 5).
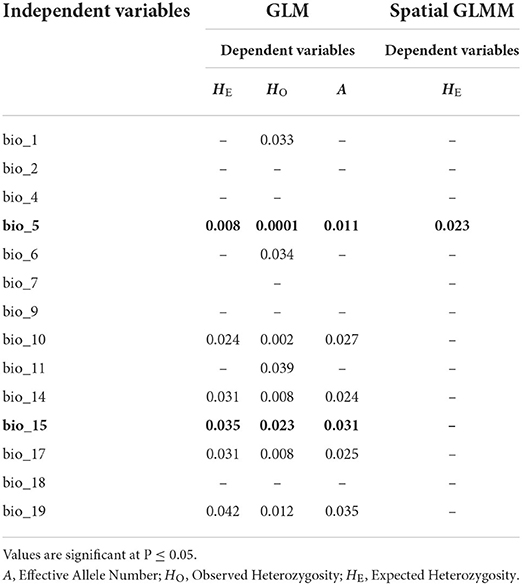
Table 6. Generalized linear model (GML) for the contribution of environmental variables to genetic diversity measures and spatially explicit generalized linear mixed models (spatial GLMMs) for the influence of environmental variables on genetic diversity measures based on 23 neutral SSR loci.
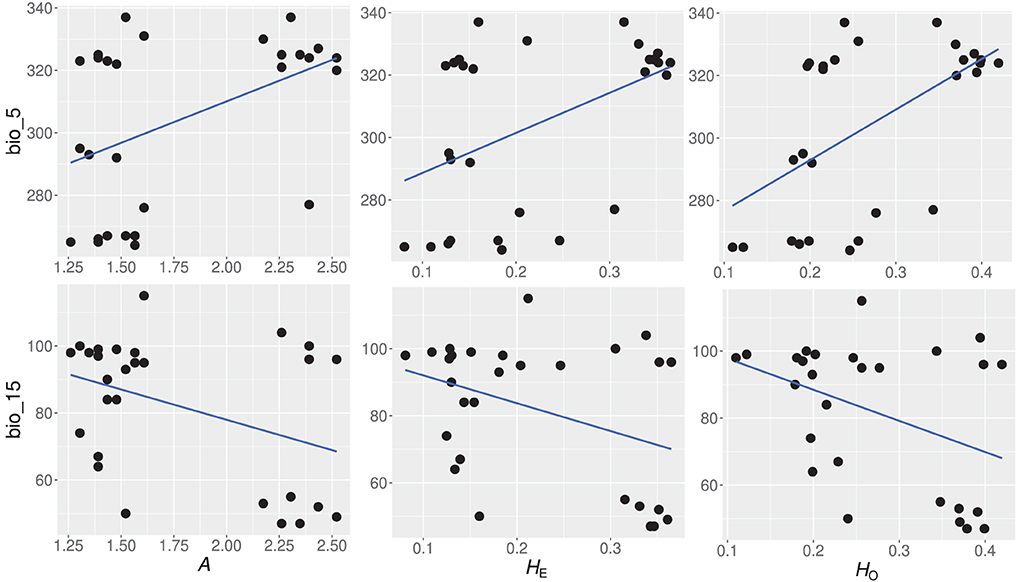
Figure 5. Significant relationships between genetic diversity estimators and the two most important environmental variables, based on variance inflation factor (VIF) analysis. A, number of alleles per population; HE, expected heterozygosity; HO, observed heterozygosity; bio_5; Maximum temperature of the warmest month, bio_15; precipitation seasonality.
Genetically informed ecological niche modeling
Five environmental variables were left after multi-collinearity analysis (bio3, bio5, bio8, bio15, and bio18) and were used in subsequent analysis. We found significant differences among groups in environmental space using both multivariant and individual-based analyses. The first three principal components accounted for 99.9% of the variation in climate among groups (PC1 = 67.9%, PC2 = 20.1%, and PC3 = 11.9%). Each of the PC axis was highly correlated with a single bioclimatic variable (PC1~bio8, r = 0.850; PC2~bio15, r = 0.849; PC3~bio5, and r = 0.561) (Figure 6). Multivariant perMANOVA detected significant niche separation by climate among genetic groups (p = 0.001). All genetic groups occupied significantly different environmental niche spaces with respect to each bio-climatic variable as assessed using Turkey's pairwise test (at least p < 0.01) and Welch's ANOVA (p < 0.01).
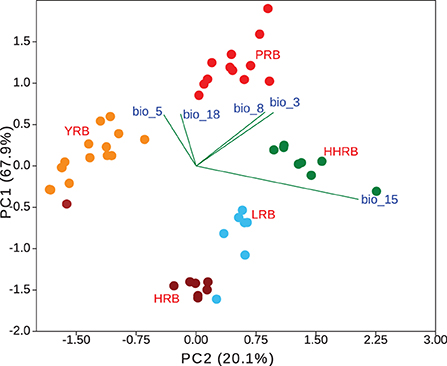
Figure 6. Population genetic groups are significantly different in the environmental space. HRB, Heilongjiang River Basin; LRB, Liaohe River Basin; HHRB, Huanghe River Basin; YRB, Yangtze River Basin; PRB, Pearl River Basin.
Our genetic-informed models (gENMs) showed high discriminatory power. AUC and pROC scores were 0.914–0.987 and 1.879–1.984, respectively. This was an improvement from the species-level model that had AUC and pROC scores of 0.893 and 1.845, respectively (Supplementary Table 17). The percentage contribution of bioclimatic variables to the model building showed high variation across models (Table 7). For instance, bio3 had a 92.3% contribution to the HRB model and 0.1% to the PRB model. Temperature-related variables showed the highest contribution to all models except the YRB, where precipitation seasonality had a contribution of 58.8% (Table 7).

Table 7. Percentage contribution of bioclimatic variables across six ecological niche models (ENMs).
Empirical niche overlap (D) between all model pairs ranged from 0.097 to 0.451. The null hypothesis that any genetic group occupies identical niches was rejected for 5 of the pairwise comparisons, while 5 other comparisons supported niche equivalence (Table 8). However, based on the low observed D values, the gENMs were found to be less similar than expected by chance, supporting the hypothesis of niche divergence among the river basins. The difference in regional habitat available to each population could influence its realized niche. Background similarity test to determine if gENMs were more or less similar than expected showed that D was significantly higher than expected by chance reflecting a degree of niche conservatism (Table 9). This is expected for aquatic plants since they persist in limited riparian micro-ecosystems sandwiched among expansive terrestrial ecosystems.
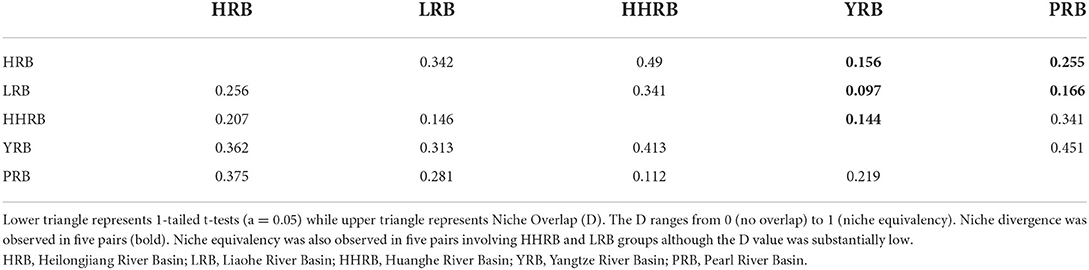
Table 8. Niche identity tests between genetic group pairs.
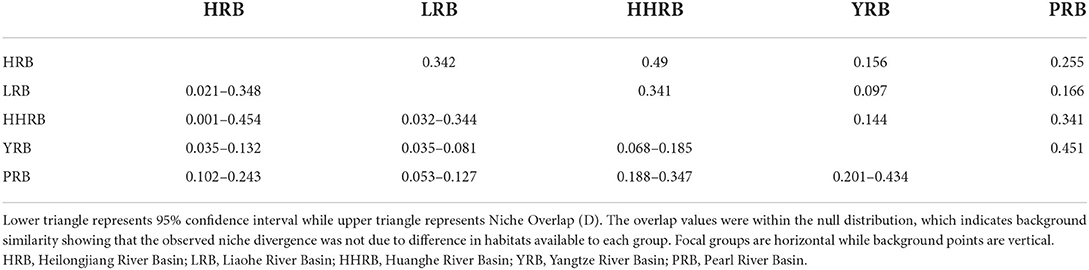
Table 9. Background similarity test between genetic clusters with all comparisons being significant at 95 CI level.
Discussion
Aquatic plants thrive in patchy habitats within the expansive terrestrial ecosystem, and their dispersal mostly depends on water connectivity, wind, and/or birds, generally effective locally. Previous studies have focused on the IBD model to explain the genetic structure, ignoring the influence of other factors, such as climatic, environmental, and landscape heterogeneity. In this study, the evident genetic structure was found for all Z. latifolia populations throughout China along the latitudinal gradient. The three models of gene flow (IBE, IBD, and IBR) were tested and showed that IBE was first supported followed by IBD. This indicates that climatic differences, especially bio_5 (maximum temperature of the warmest month) and bio_15 (precipitation seasonality), are more important than the distance between populations. Populations in central China exhibited higher than average genetic diversity followed by populations from the North, and the least diversity was found in Southern populations. This genetic pattern might be impacted by the latitudinal trend.
Comparison of genetic diversity at different latitudes and genetic bottlenecks
Zizania latifolia populations showed relatively low genetic diversity (HE = 0.258). For the 28 Z. latifolia populations from the five river basins/regions along the latitudinal gradient, the genetic diversity increased gradually from north to south, culminating in the Yangtze River Basin, and then dropping rapidly to its lowest level in the southernmost populations in the Pearl River Basin. A similar level of genetic diversity was reported in its natural populations across China (HE = 0.371) using limited (three) SSR markers (Xu et al., 2015). Additionally, similar microsatellite diversity of Z. latifolia was also found in Northeast China (HE = 0.328; Chen et al., 2017a). In the present study, a higher-than-average genetic diversity was observed in populations along the Huanghe River (HE = 0.317), and along the Yangtze River (HE = 0.315). Similarly, previous studies also reported a relatively high genetic diversity in the Yangtze River Basin (Chen et al., 2012; Zhao et al., 2018, 2019).
Although latitudinal trends in intraspecific genetic diversity have not been fully resolved, the leading hypothesis is that genetic diversity increases along the latitudinal gradient toward the equator, which is explained to be as a result of greater evolutionary stability in the tropics than in the higher latitudes. Such an intraspecific genetic diversity trend has been generally reported in plants, birds, and vertebrates (reviewed by Hirao et al., 2017). This trend is not completely applicable to the present study. The genetic diversity increased from the Heilongjiang Basin to the Yangtze River Basin, which may mirror the latitudinal trend of genetic diversity. However, the lowest level of genetic variations in the Pearl River Basin broke the trend. Among the five regions studied, the Pearl River Basin has been fully utilized and developed, with little idle land and water area. Furthermore, the residents around rivers in the Pearl River Basin have greatly increased, resulting in more sewage and a poor water environment. Though recent bottlenecks were found in all 28 populations, the harsh habitats in the Pearl River Basin might result in the lowest genetic diversity in this region.
The Bottleneck analysis showed that almost all Z. latifolia populations experienced recent demographic bottlenecks, especially under IAM (23 populations) and TPM (17 populations). The microsatellites used in Z. latifolia are either dinucleotide perfect repeats or imperfect repeats, both of which tend toward the IAM (Cornuet and Luikart, 1996). Therefore, the IAM might give more accurate estimates. The census population size of species can provide compelling evidence for bottlenecks. Unfortunately, for wild Z. latifolia, as a kind of common weed, its census population size is difficult to be obtained. Chinese wetlands, including the current five river basins, have been shrinking seriously in the past few decades (Wang et al., 2011; Huang et al., 2012; Cao et al., 2017; Chen et al., 2017b; Zhang et al., 2019). During this process, we inferred that the habitats of Z. latifolia could have been severely disturbed and the population size would be reduced. Besides the general situation, wild Z. latifolia populations have continuously suffered from bottlenecks caused by other factors. The factors leading to the bottlenecks were different for populations collected from different habitats. As for the populations from lakes (including all populations from the Yangtze River Basin and DP and LQ from the Huanghe River Basin), they generally grow along the littorals of lakes, and two factors may lead to the bottlenecks: (1) Severe shrinkage of lakeside zones during the dry seasons would result in extensive death of wild Z. latifolia; (2) Since people do not need Z. latifolia to feed cattle as they did historically, Z. latifolia has been removed by machines in some lakes to prevent the process of paludification. As for populations growing in ponds, irrigation ditches, and small rivers, such habitats are usually ephemeral, which would lead to repeated bottlenecks for Z. latifolia populations. As we know, Z. latifolia cannot withstand drought due to its underdeveloped root systems and recalcitrant seeds (Berjak and Pammenter, 2007).
Historical and contemporary gene flow
In the present study, historical gene flow (MH = 0.212–2.354) was higher compared to contemporary gene flow (MC = 0.0021–0.0044), indicating the effect of wetland fragmentation and subsequent population decline. These findings are supported by observed low genetic diversity, significant bottlenecks, and high population divergence. Unlike the contemporary gene flow, which showed that higher migration was within clusters (MC = 0.0112–0.0247) than among clusters (MC = 0.0021–0.0044), a higher migration rate was found among clusters (MH = 0.211–14.46) than within clusters (MH = 0.212–2.354) for historical gene flow. This could be related to the origin and dispersal history of Z. latifolia. Guo and Ge (2005) reported that Zizania species originated from the New World and dispersed into North America and then to Asia through the Bering Land Bridge during the Miocene, which is also supported by the timeframe for the diversification of the rice tribe (Wen, 2001; Gutaker et al., 2020). After the introduction of Z. latifolia in Northern China, colonization occurred southwards occupying different environmental habitats (Guo and Ge, 2005). During the migration process, the plant could have acquired new mutations, but which were not enough to dilute the shared common ancestry.
IBE, IBD, and IBR
For the first time, IBE and IBR were tested, besides the commonly assessed IBD pattern in the natural populations of Z. latifolia. We found that the IBE pattern was exclusively supported by RCM for all populations, and it was also detected in three regions, including Liaohe River Basin, Huanghe River Basin, and Pearl River Basin. Similarly, previous studies also showed that instead of geographical distance, the environmental variables better explain the genetic patterns of different other plant species [refer to reviews by Shafer and Wolf (2013) and Sexton et al. (2014)]. For example, IBE was reported for the perennial grass species (Festuca rubra) of the western Norway alpines and the aquatic species Ranunculus subrigidus of the Qinghai-Tibetan plateau (Šurinová et al., 2019; Wu Z. et al., 2019).
The two methods (GLMs and spatial GLMMs) consistently found that the maximum temperature of the warmest month (bio_5) and precipitation seasonality (bio_15) were the best environmental variables responsible for the observed genetic diversity. Environmental association analysis (EAA) based on the outlier loci also showed similar results. Additionally, EAA also detected a significant association between outlier loci and a high number of temperature-related variables, which implied that temperature and precipitation could alter the physiology and phenotypic diversity and subsequently influence plant genetic differentiation and adaptability, which was well-proved by previous studies (Hoffmann and Sgr, 2011; Manel et al., 2012; Wang et al., 2016; Münzbergová et al., 2017). For Z. latifolia, the intolerance to drought undoubtedly makes precipitation very important for its growth and population maintenance. Our common garden experiments showed that the individuals exhibited shorter heights and smaller leaves when they were transplanted to a relatively lower latitude region. We also found that with the annual temperature increasing at 1°C, the plant height, leaf length, and width would decrease by 4.65, 2.81, and 0.39 mm, respectively (unpublished data). Furthermore, higher respiration rates were found in the populations from high to low latitude regions compared with those from low to high latitude regions, but all populations showed similar levels of photosynthetic parameters (unpublished data). A previous study suggested that plant respiration often reaches peak at a higher temperature compared to photosynthesis (Atkin and Tjoelker, 2003). Therefore, we inferred that a warmer condition could result in a decrease in biomass accumulation due to higher organic matter degradation. In the present study, the putative roles of the four gene-linked loci (DNA-binding transcription factor activity, protein phosphorylation, RNA splicing, and response to external stimuli) are part of the plant machinery involved not only in normal growth, but also in response to stressors through transcription regulation, RNA modification, and protein metabolism.
Isolation by distance was the second best-supported model for the entire study site. As an anemophilous emergent plant, combined with its edible seeds, Z. latifolia can mainly be dispersed by wind, water flow, and waterfowl. These factors work more effectively at close distances, especially in the local area. Furthermore, since the Z. latifolia populations in this study were sampled from plains with latitude gradients, geographically distant regions tend to have greater variations due to differences in climate factors. Even though migrating birds can spread seeds over long distances along latitudes, the seeds may unsuccessfully colonize in the new habitat due to unsuitable climatic conditions. In contrast, seeds that spread to nearby regions are more likely to survive due to similar climatic conditions. The contribution of geographical distance to Z. latifolia genetic structuring has been reported previously by Zhao et al. (2018, 2019) using a simple Mantel, for which we also found a strong positive correlation (r = 0.6388; P = 0.001) for the entire data set.
Within regions, IBD was only in the Heilongjiang River Basin where Z. latifolia populations grow along the stretch of the Amur River (Fan et al., 2016). When populations reach equilibrium between gene flow and genetic drift, there should be an IBD pattern (Wright, 1943). The IBD pattern in the Heilongjiang River Basin may suggest that the continuous populations along the river in this area are less susceptible to genetic drift.
For aquatic or riparian plants, hydrological connectivity greatly facilitates their dispersal between populations. In the present study, the populations from the Yangtze River Basin were sampled from ponds and small rivers which would connect with the artery of Yangtze in flood seasons. The Yangtze River Basin was a potamo-lacustrine system where lakes (including sampling lakes) were interconnected with the main vein of the Yangtze River by small rivers; thus, hydrological connectivity (IBR_HC) was expected. It is worth noting that of the seven lakes sampled in the Yangtze River Basin, except for Dongting Lake, the water course of the other six lakes was controlled by water gates installed in the 1950s for controlling water levels, generating electricity, and irrigation (Wu Y. et al., 2019). Thus, the hydrological connectivity between lakes depends on the control of lakes by local governments, rather than the connectivity of waterways. Since Z. latifolia is a wind-pollinated plant, wind connectivity was also investigated in this study. Previous studies have shown that pollen-mediated gene flow spreads almost exclusively locally, and diminishes logarithmically with increasing distance (Tero et al., 2003). The IBR_WD was not supported in the present study, which proved that the wind pollination of Z. latifolia was only effective within a population.
We found that populations within each river basin occupy significantly different environmental spaces, which is expected to facilitate local adaptation. Similar to our results of EAA, where bio_3, bio_5, bio_15, and bio_18 variables were significantly associated with gene-linked loci, these variables proved to be the most influential drivers of niche differentiation. Niche divergence was identified in half of the pairwise comparisons that involved at least each genetic group. Although some comparisons showed evidence of niche equivalency, the niche overlap score was substantially low (0.097–0.451) on a scale of 0 (no overlap) to 1 (niche equivalency). Pairwise background similarity tests showed that gENMs were not significantly different, and thus the observed niche divergence could not be an artifact of difference in habitat availability among the river basins. The IBD model results from geographical isolation, which limits gene flow among populations. Given that the local adaptation could occur in differentiated environment space, the genetic structure pattern could be construed to be shaped by IBD, especially for widespread species. Our gENM results supplement the evidence for IBE being the most important in shaping the genetic structure and distribution of Z. latifolia.
In general, the genetic structure of Z. latifolia is influenced by the combined effects of the environment, geographical distance, and landscape heterogeneity, with the environment having the highest impact.
Genetic discontinuity and excess heterozygosity
In the present study, the AMOVA based on three data sets consistently showed the strong genetic divergence among Z. latifolia populations from different regions/latitude areas, accounting for 45.54–47.13% of the total genetic variations. The results were also supported by the cluster analyses (STRUCTURE, PCoA, and NJ) which showed that the populations from the same regions/latitude areas clustered together. Accordingly, genetic discontinuities were detected between adjacent regions/latitude areas by both geneland and BARRIER analysis. The evident genetic differentiation among regions might be explained by a number of factors, such as IBE, IBD, and fragmentation, which were supported by decreased gene flow.
As mentioned above, the IBE and IBD were the two best-supported models for the entire study site. Populations from the same latitude are geographically closer and their climatic conditions are more similar, so populations from the same latitude tend to cluster together with less genetic differentiation.
Habitat fragmentation generally reduces the gene flow among populations by decreasing the habitat size and increasing the isolation between populations, which would eventually increase genetic differentiation. However, Zhao et al. (2013) reported that wild rice Oryza rufipogon increased gene flow in fragmented habitats through introgression which is from cultivated populations to wild ones and acts as a bridge to mediate the gene flow among wild populations. In the present study, historical gene flow (MH = 0.212–2.354) was higher than contemporary gene flow (MC = 0.0112–0.0247), which implied that the wetland fragmentation and degeneration were followed by reduced gene flow.
Declining population size and population isolation are expected to result in considerable inbreeding. However, we found negative FIS values for almost all populations. This could be related to the characteristics of Z. latifolia, which is a perennial species that reproduces both sexually and clonally. The reproduction system of partial clonality has been shown to influence the heterozygosity rate, with tendencies toward excess, leading to negative FIS values (Stoeckel et al., 2006, 2021). According to Balloux et al. (2003), in clonal/partial clonal species, mutations will accumulate due to irreversible divergence of two alleles of a locus over generations leading to excess heterozygosity and hence the observed negative FIS values for Z. latifolia populations.
Implications for conservation and management
Global climate change has brought a tremendous impact on world food production, which highlights the protection and management of the resources of crop wild germplasm increasingly prominent. Knowledge of genetic diversity patterns and local adaptation for the target species is a prerequisite for the effective conservation of its wild germplasm resources.
The wild rice Z. latifolia showed a high level of genetic differentiation among the regions along the latitudinal gradient. The genetic discontinuity was attributed to the climate differences (especially temperature and precipitation), the heterogeneous landscape, and the discrete distribution of the natural populations. Given that Chinese wetlands are being increasingly damaged (Liu et al., 2005), both in-situ and ex-situ conservation should be recommended in the future conservation process. In the process of ex-situ conservation, transplanting with a large latitude span is discouraged due to its inadaptability to the local climate. Multiple ex-situ conservation sites should be established along the latitude gradient, which can reduce the management cost, and prevent the out-crossing depression caused by the interbreeding of ex-situ populations from different latitude regions.
For the same latitude region, obvious genetic differentiation among populations was detected due to wetland fragmentation. Therefore, dredging the watercourses to achieve hydrological connectivity within each wetland is recommended for in-situ conservation at the same latitude. This action would increase the gene flow among populations and habitat stability and consequently reduce bottlenecks (Chen et al., 2017a). Additionally, populations with a high level of genetic variation need to be protected as a priority for both ex- and in-situ conservation, such as populations CH, SJ, and DT in the Yangtze River Basin.
Data availability statement
The datasets presented in this study can be found in online repositories. The names of the repository/repositories and accession number(s) can be found in the article/Supplementary Material.
Author contributions
YC conceived the idea and designed the research project. WL gave suggestions for the design of the study. YC, XF, and WF collected the samples and assembled experiment materials. GW, XF, and MT performed the experiment. YC and GW analyzed the data and wrote the manuscript. All authors contributed to the revision and final editing of the manuscript prior to submission.
Funding
This work was supported by the Strategic Priority Research Program of the Chinese Academy of Sciences (XDB31000000), the Talent Program of Wuhan Botanical Garden of the Chinese Academy of Sciences (Y855291), and the CAS-TWAS President's Fellowship for International Doctoral Students.
Acknowledgments
We would like to thank MS. Chen Jian for her valuable comments on the manuscript. This manuscript has been released as a pre-print at https://www.biorxiv.org/content/10.1101/2020.05.29.124685v1 (Wagutu et al., 2020c).
Conflict of interest
The authors declare that the research was conducted in the absence of any commercial or financial relationships that could be construed as a potential conflict of interest.
Publisher's note
All claims expressed in this article are solely those of the authors and do not necessarily represent those of their affiliated organizations, or those of the publisher, the editors and the reviewers. Any product that may be evaluated in this article, or claim that may be made by its manufacturer, is not guaranteed or endorsed by the publisher.
Supplementary material
The Supplementary Material for this article can be found online at: https://www.frontiersin.org/articles/10.3389/fevo.2022.929944/full#supplementary-material
References
Antao, T., Lopes, A., Lopes, R. J., Beja-Pereira, A., and Luikart, G. (2008). LOSITAN: a workbench to detect molecular adaptation based on a Fst-outlier method. BMC Bioinformatics 9, 323. doi: 10.1186/1471-2105-9-323
Atkin, O., and Tjoelker, M. (2003). Thermal acclimation and the dynamic response of plant respiration to temperature. Trends Plant Sci. 8, 343–351. doi: 10.1016/S1360-1385(03)00136-5
Balloux, F., Lehmann, L., and De Meeus, T. (2003). The population genetics of clonal and partially clonal diploids. Genetics 164, 1635–1644. doi: 10.1093/genetics/164.4.1635
Barrett, S. C. H., Eckert, C. G., and Husband, B. C. (1993). Evolutionary processes in aquatic plant populations. Aquat. Bot. 44, 105–145. doi: 10.1016/0304-3770(93)90068-8
Beaumont, M. A., and Nichols, R. A. (1996). Evaluating loci for use in the genetic analysis of population structure. Proc. R. Soc. London Ser. B Biol. Sci. (1996) 263, 1619–1626. doi: 10.1098/rspb.1996.0237
Beerli, P. (2009). How to use MIGRATE or why are Markov Chain Monte Carlo programs difficult to use. Popul. Genet. Anim. Conserv. 17, 42–79. doi: 10.1017/CBO9780511626920.004
Beerli, P., Mashayekhi, S., Sadeghi, M., Khodaei, M., and Shaw, K. (2019). Population genetic inference with MIGRATE. Curr. Protoc. Bioinformatics 68, e87. doi: 10.1002/cpbi.87
Berjak, P., and Pammenter, N. W. (2007). From Avicennia to Zizania: seed recalcitrance in perspective. Ann. Bot. 101, 213–228. doi: 10.1093/aob/mcm168
Bischoff, A., Crémieux, L., Smilauerova, M., Lawson, C. S., Mortimer, S. R., Dolezal, J., et al. (2006). Detecting local adaptation in widespread grassland species? The importance of scale and local plant community. J. Ecol. 94, 1130–1142. doi: 10.1111/j.1365-2745.2006.01174.x
Bothwell, H. M., Evans, L. M., Hersch-Green, E. I., Woolbright, S. A., Allan, G. J., and Whitham, T. G. (2021). Genetic data improves niche model discrimination and alters the direction and magnitude of climate change forecasts. Ecol. Appl. 31:e02254. doi: 10.1002/eap.2254
Bradbury, D., Smithson, A., and Krauss, S. L. (2013). Signatures of diversifying selection at EST-SSR loci and association with climate in natural Eucalyptus populations. Mol. Ecol. 22, 5112–5129. doi: 10.1111/mec.12463
Bradbury, P. J., Zhang, Z., Kroon, D. E., Casstevens, T. M., Ramdoss, Y., and Buckler, E. S. (2007). TASSEL: Software for association mapping of complex traits in diverse samples. Bioinformatics 23, 2633–2635. doi: 10.1093/bioinformatics/btm308
Cao, J., Guo, J., and Li, Y. (2017). Research on typical wetlands degradation factors in Liao River Basin. J. Water Resour. Res. 6, 176–186. doi: 10.12677/JWRR.2017.62021
Chapuis, M. P., and Estoup, A. (2007). Microsatellite null alleles and estimation of population differentiation. Mol. Biol. Evol. 24, 621–631. doi: 10.1093/molbev/msl191
Chen, Y., Huang, X., and Wang, X. (2017b). Pearl River Basin habitat fragmentation effects on fish species diversity. Yunnan Geogr. Environ. Res. 29, 62–68. Available online at: http://www.doc88.com/p-9601741097785.html
Chen, Y., Liu, Y., Fan, X., Li, W., and Liu, Y. (2017a). Landscape-scale genetic structure of wild rice Zizania latifolia: the roles of rivers, mountains and fragmentation. Front. Ecol. Evol. 5, 17. doi: 10.3389/fevo.2017.00017
Chen, Y.-Y., Chu, H.-J., Liu, H., and Liu, Y.-L. (2012). Abundant genetic diversity of the wild rice Zizania latifolia in central China revealed by microsatellites. Ann. Appl. Biol. 161, 192–201. doi: 10.1111/j.1744-7348.2012.00564.x
Conesa, A., and Götz, S. (2008). Blast2GO: a comprehensive suite for functional analysis in plant genomics. Int. J. Plant Genomics 2008, 1–12. doi: 10.1155/2008/619832
Cornuet, J. M., and Luikart, G. (1996). Description and power analysis of two tests for detecting recent population bottlenecks from allele frequency data. Genetics 144, 2001–2014. doi: 10.1093/genetics/144.4.2001
Cushman, S., Wasserman, T., Landguth, E., and Shirk, A. (2013b). Re-evaluating causal modeling with mantel tests in landscape genetics. Diversity 5, 51–72. doi: 10.3390/d5010051
Cushman, S. A., and Landguth, E. L. (2010). Spurious correlations and inference in landscape genetics. Mol. Ecol. 19, 3592–3602. doi: 10.1111/j.1365-294X.2010.04656.x
Cushman, S. A., McKelvey, K. S., Hayden, J., and Schwartz, M. K. (2006). Gene flow in complex landscapes: testing multiple hypotheses with causal modeling. Am. Nat. 168, 486–499. doi: 10.1086/506976
Cushman, S. A., Shirk, A. J., and Landguth, E. L. (2013a). Landscape genetics and limiting factors. Conserv. Genet. 14, 263–274. doi: 10.1007/s10592-012-0396-0
Doyle, J. J., and Doyle, J. L. (1987). A rapid DNA isolation procedure for small quantities of fresh leaf tissue. Phytochem. Bull. 19, 11–15.
Earl, D. A., and vonHoldt, B. M. (2012). STRUCTURE HARVESTER: a website and program for visualizing STRUCTURE output and implementing the Evanno method. Conserv. Genet. Resour. 4, 359–361. doi: 10.1007/s12686-011-9548-7
Evanno, G., Regnaut, S., and Goudet, J. (2005). Detecting the number of clusters of individuals using the software structure: a simulation study. Mol. Ecol. 14, 2611–20. doi: 10.1111/j.1365-294X.2005.02553.x
Fan, X.-R., Ren, X.-R., Liu, Y.-L., and Chen, Y.-Y. (2016). Genetic structure of wild rice Zizania latifolia and the implications for its management in the Sanjiang Plain, Northeast China. Biochem. Syst. Ecol. 64, 81–88. doi: 10.1016/j.bse.2015.11.017
Fernández-López, J., and Schliep, K. (2019). rWind: Download, edit and include wind data in ecological and evolutionary analysis. Ecography 42, 804–810. doi: 10.1111/ecog.03730
Garnier-Géré, P., and Chikhi, L. (2013). “Population subdivision, hardy-weinberg equilibrium and the wahlund effect,” in Genetics of Large Populations and Association Studies (2008), eds P. H. Garnier-Gére and L. Chikhi (Chichester: John Wiley and Sons, Ltd). doi: 10.1002/9780470015902.a0005446.pub3
Gross, C. L., Nelson, P. A., Haddadchi, A., and Fatemi, M. (2012). Somatic mutations contribute to genotypic diversity in sterile and fertile populations of the threatened shrub, Grevillea rhizomatosa (Proteaceae). Ann. Bot. 109, 331–342. doi: 10.1093/aob/mcr283
Guillot, G., Santos, F., and Estoup, A. (2011). Population Genetics Analysis Using R and the Geneland Program. Available online at: http://www2.imm.dtu.dk/~gigu/Geneland/ (accessed January 19, 2022).
Guo, Y.-L., and Ge, S. (2005). Molecular phylogeny of Oryzeae (Poaceae) based on DNA sequences from chloroplast, mitochondrial, and nuclear genomes. Am. J. Bot. 92, 1548–1558. doi: 10.3732/ajb.92.9.1548
Gutaker, R. M., Groen, S. C., Bellis, E. S., Choi, J. Y., Pires, I. S., Bocinsky, R. K., et al. (2020). Genomic history and ecology of the geographic spread of rice. Nat. Plants 6, 492–502. doi: 10.1038/s41477-020-0659-6
Hammer, Ø., Harper, D. A. T., and Ryan, P. D. (2001). PAST: paleontological statistics software package for education and data analysis. Palaeontologia Electronica 4, 1–9. Available online at: http://palaeo-electronica.org/2001_1/past/issue1_01.htm
Helsen, K., Acharya, K. P., Brunet, J., Cousins, S. A. O., Decocq, G., Hermy, M., et al. (2017). Biotic and abiotic drivers of intraspecific trait variation within plant populations of three herbaceous plant species along a latitudinal gradient. BMC Ecol. 17, 38. doi: 10.1186/s12898-017-0151-y
Hirao, A. S., Watanabe, M., Tsuyuzaki, S., Shimono, A., Li, X., Masuzawa, T., et al. (2017). Genetic diversity within populations of an arctic-alpine species declines with decreasing latitude across the Northern Hemisphere. J. Biogeogr. 44, 2740–2751. doi: 10.1111/jbi.13085
Hoffmann, A. A., and Sgr,ò, C. M. (2011). Climate change and evolutionary adaptation. Nature 470, 479–485. doi: 10.1038/nature09670
Huang, C., Liu, G., Wang, X., Ye, Y., Li, Y., and Huang, J. (2012). Monitoring wetlands pattern in the Yellow River Basin for water resources management using Beijing-1 images. Geogr. Res. 31, 1764–1774. doi: 10.1109/IGARSS.2012.6351453
Ikeda, D. H., Max, T. L., Allan, G. J., Lau, M. K., Shuster, S. M., and Whitham, T. G. (2017). Genetically informed ecological niche models improve climate change predictions. Global Change Biology, 23, 164–176. doi: 10.1111/gcb.13470
James, E. A., and McDougall, K. L. (2014). Spatial genetic structure reflects extensive clonality, low genotypic diversity and habitat fragmentation in Grevillea renwickiana (Proteaceae), a rare, sterile shrub from south-eastern Australia. Annals Botany 114, 413–423. doi: 10.1093/aob/mcu049
Joost, S., Bonin, A., Bruford, M. W., Després, L., Conord, C., Erhardt, G., et al. (2007). A spatial analysis method (SAM) to detect candidate loci for selection: Towards a landscape genomics approach to adaptation. Mol. Ecol. 16, 3955–3969. doi: 10.1111/j.1365-294X.2007.03442.x
Keenan, K., McGinnity, P., Cross, T. F., Crozier, W. W., and Prodöhl, P. A. (2013). diveRsity: an R package for the estimation and exploration of population genetics parameters and their associated errors. Methods Ecol. Evolution 4, 782–788. doi: 10.1111/2041-210X.12067
Kumar, S., Stecher, G., Li, M., Knyaz, C., and Tamura, K. (2018). MEGA X: molecular evolutionary genetics analysis across computing platforms. Mol. Biol. Evol. 35, 1547–1549. doi: 10.1093/molbev/msy096
Liu, B., Piao, H., Zhao, F., Zhao, J., and Zhao, R. (1999). Production and molecular characterization of rice lines with introgressed traits form a wild species Zizania latifolia (Griseb.). J. Genetic Breed. 53, 279–284.
Liu, H., Lü, X., Zhang, S., and Yang, Q. (2005). Fragmentation process of wetland landscape in watersheds of Sanjiang Plain, China. Ying Yong Sheng Tai Xue Bao 16, 289–295. Available online at: http://www.cjae.net/EN/Y2005/V16/I2/289
Liu, J. G., Dong, Y., Xu, H., Wang, D. K., and Xu, J. K. (2007). Accumulation of Cd, Pb and Zn by 19 wetland plant species in constructed wetland. J. Hazard. Mater. 147, 947–953. doi: 10.1016/j.jhazmat.2007.01.125
Lo, E. Y. Y., Stefanović, S., Ritland, K., and Dickinson, T. A. (2010). Fine-scale comparisons of genetic variability in seed families of asexually and sexually reproducing Crataegus (hawthorn; Rosaceae). Am. J. Botany 97, 1014–1024. doi: 10.3732/ajb.0900091
Manel, S., Gugerli, F., Thuiller, W., Alvarez, N., Legendre, P., Holderegger, R., et al. (2012). Broad-scale adaptive genetic variation in alpine plants is driven by temperature and precipitation. Mol. Ecol. 21, 3729–3738. doi: 10.1111/j.1365-294X.2012.05656.x
Manni, F., Guerard, E., and Heyer, E. (2004). Geographic patterns of (genetic, morphologic, linguistic) variation: how barriers can be detected by using Monmonier's algorithm. Ann. Hum. Biol. 76, 173–190. doi: 10.1353/hub.2004.0034
Mantel, N. (1967). The detection of disease clustering and a generalized regression approach. Cancer Resour. 27, 209–220.
McRae, B. H. (2006). Isolation by resistance. Evolution 60, 1551–1561. doi: 10.1111/j.0014-3820.2006.tb00500.x
Meirmans, P. G. (2020). genodive version 3.0: easy-to-use software for the analysis of genetic data of diploids and polyploids. Mol. Ecol. Resour. 20, 1126–1131. doi: 10.1111/1755-0998.13145
Meirmans, P. G., and Van Tienderen, P. H. (2004). genotype and genodive: two programs for the analysis of genetic diversity of asexual organisms. Mol. Ecol. Notes 4, 792–794. doi: 10.1111/j.1471-8286.2004.00770.x
Morente-López, J., García, C., Lara-Romero, C., García-Fernández, A., Draper, D., and Iriondo, J. M. (2018). Geography and environment shape landscape genetics of Mediterranean Alpine Species Silene ciliata Poiret. (Caryophyllaceae). Front. Plant Sci. 9, 1698. doi: 10.3389/fpls.2018.01698
Münzbergová, Z., Hadincová, V., Skálová, H., and Vandvik, V. (2017). Genetic differentiation and plasticity interact along temperature and precipitation gradients to determine plant performance under climate change. J. Ecol. 105, 1358–1373. doi: 10.1111/1365-2745.12762
Ngarega, B. K., Nzei, J. M., Saina, J. K., Halmy, M. W. A., Chen, J.-M., and Li, Z.-Z. (2022). Mapping the habitat suitability of Ottelia species in Africa. Plant Divers. S2468265921001591. doi: 10.1016/j.pld.2021.12.006
Nzei, J. M., Ngarega, B. K., Mwanzia, V. M., Musili, P. M., Wang, Q.-F., and Chen, J.-M. (2021). The past, current, and future distribution modeling of four water lilies (Nymphaea) in Africa indicates varying suitable habitats and distribution in climate change. Aquat. Bot. 173, 103416. doi: 10.1016/j.aquabot.2021.103416
Oksanen, J., Blanchet, F. G., Kindt, R., Legendre, P., and Minchin, R. B. (2018). vegan: Community Ecology Package. R package version 2.5-3. Available online at: https://CRAN.R-project.org/package=vegan.
Orsini, L., Vanoverbeke, J., Swillen, I., Mergeay, J., and De Meester, L. (2013). Drivers of population genetic differentiation in the wild: isolation by dispersal limitation, isolation by adaptation and isolation by colonization. Mol. Ecol. 22, 5983–5999. doi: 10.1111/mec.12561
Peakall, R., and Smouse, P. E. (2012). GenAlEx 6.5: Genetic analysis in Excel. Population genetic software for teaching and research–an update. Bioinformatics 28, 2537–2539. doi: 10.1093/bioinformatics/bts460
Peng, S.-L., You, W.-H., Qi, G., and Yang, F.-L. (2013). “Nitrogen and phosphorus uptake capacity and resource use of aquatic vegetables floating bed in the eutrophicated lake,” in 2013 Third International Conference on Intelligent System Design and Engineering Applications, 994–997. doi: 10.1109/ISDEA.2012.237
Peterson, A. T., Papeş, M., and Soberón, J. (2008). Rethinking receiver operating characteristic analysis applications in ecological niche modeling. Ecol. Model. 213, 63–72. doi: 10.1016/j.ecolmodel.2007.11.008
Phillips, S. J., Anderson, R. P., and Schapire, R. E. (2006). Maximum entropy modeling of species geographic distributions. Ecol. Model. 190, 231–259. doi: 10.1016/j.ecolmodel.2005.03.026
Piry, S., Luikart, G., and Cornuet, J.-M. (1999). Computer note. BOTTLENECK: A computer program for detecting recent reductions in the effective size using allele frequency data. J. Hered. 90, 502–503. doi: 10.1093/jhered/90.4.502
Pritchard, J. K., Stephens, M., and Donnelly, P. (2000). Inference of population structure using multilocus genotype data. Genetics 155, 945–959. doi: 10.1093/genetics/155.2.945
QGIS Development Team (2009). QGIS Geographic Information System. QGIS Association. Available online at: http://www.qgis.org
Quan, Z., Pan, L., Ke, W., Liu, Y., and Ding, Y. (2009). Sixteen polymorphic microsatellite markers from Zizania latifolia Turcz. (Poaceae). Mol. Ecol. Resour. 9, 887–889. doi: 10.1111/j.1755-0998.2008.02357.x
Richards, C. M., Antolin, M. F., Reilley, A., Poole, J., and Walters, C. (2007). Capturing genetic diversity of wild populations for ex situ conservation: Texas wild rice (Zizania texana) as a model. Genet. Resour. Crop Evol. 54, 837–848. doi: 10.1007/s10722-006-9167-4
Richter-Boix, A., Quintela, M., Segelbacher, G., and Laurila, A. (2011). Genetic analysis of differentiation among breeding ponds reveals a candidate gene for local adaptation in Rana arvalis. Mol. Ecol. 20, 1582–1600. doi: 10.1111/j.1365-294X.2011.05025.x
Rousset, F., and Ferdy, J.-B. (2014). Testing environmental and genetic effects in the presence of spatial autocorrelation. Ecography 37, 781–790. doi: 10.1111/ecog.00566
Rousset, F., Lopez, J., and Belkhir, K. (2020). Genepop: Population Genetic Data Analysis Using Genepop. Available online at: http://kimura.univ-montp2.fr/~rousset/Genepop.htm (accessed January 15, 2022).
Santamaría, L. (2002). Why are most aquatic plants widely distributed? Dispersal, clonal growth and small-scale heterogeneity in a stressful environment. Acta Oecol. 23, 137–154. doi: 10.1016/S1146-609X(02)01146-3
Schneider, S., Roessli, D., and Excoffier, L. (2000). Arlequin: A Software for Population Genetics Data Analysis, Version 2.0. Geneva, Switzerland: Genetics and Biometry Laboratory, Department of Anthropology, University of Geneva.
Sexton, J. P., Hangartner, S. B., and Hoffmann, A. A. (2014). Genetic isolation by environment or distance: which pattern of gene flow is most common? Evolution 68, 1–15. doi: 10.1111/evo.12258
Shafer, A. B. A., and Wolf, J. B. W. (2013). Widespread evidence for incipient ecological speciation: a meta-analysis of isolation-by-ecology. Ecol. Lett. 16, 940–950. doi: 10.1111/ele.12120
Shen, W., Song, C., Chen, J., Fu, Y., Wu, J., and Jiang, S. (2011). Transgenic Rice Plants Harboring Genomic DNA from Zizania latifolia Confer Bacterial Blight Resistance. Rice Sci. 18, 17–22. doi: 10.1016/S1672-6308(11)60003-6
Stoeckel, S., Arnaud-Haond, S., and Krueger-Hadfield, S. A. (2021). The combined effect of haplodiplonty and partial clonality on genotypic and genetic diversity in a finite mutating population. J. Hered. 112, 78–91. doi: 10.1093/jhered/esaa062
Stoeckel, S., Grange, J., Fernández-Manjarres, J. F., Bilger, I., Frascaria-Lacoste, N., and Mariette, S. (2006). Heterozygote excess in a self-incompatible and partially clonal forest tree species—Prunus avium L. Mol. Ecol. 15, 2109–2118. doi: 10.1111/j.1365-294X.2006.02926.x
Stucki, S., Orozco-terWengel, P., Forester, B. R., Duruz, S., Colli, L., Masembe, C., et al. (2017). High performance computation of landscape genomic models including local indicators of spatial association. Mol. Ecol. Resour. 17, 1072–1089. doi: 10.1111/1755-0998.12629
Šurinová, M., Hadincová, V., Vandvik, V., and Münzbergová, Z. (2019). Temperature and precipitation, but not geographic distance, explain genetic relatedness among populations in the perennial grass Festuca rubra. J. Plant Ecol. 12, 730–741. doi: 10.1093/jpe/rtz010
Tero, N., Aspi, J., Siikamäki, P., Jäkäläniemi, A., and Tuomi, J. (2003). Genetic structure and gene flow in a metapopulation of an endangered plant species, Silene tatarica. Mol. Ecol. 12, 2073–2085. doi: 10.1046/j.1365-294X.2003.01898.x
Verity, R., and Nichols, R. A. (2016). Estimating the Number of Subpopulations (K) in Structured Populations. Genetics 203, 1827–1839. doi: 10.1534/genetics.115.180992
Vitalis, R., Dawson, K., Boursot, P., and Belkhir, K. (2003). DetSel 1.0: a computer program to detect markers responding to selection. J. Hered. 94, 429–431. doi: 10.1093/jhered/esg083
Wagutu, G. K., Fan, X., Fu, W., Li, W., and Chen, Y. (2020c). Influence of isolation by environment and landscape heterogeneity on genetic structure of wild rice Zizania latifolia along a latitudinal gradient. Ecology. doi: 10.1101/2020.05.29.124685
Wagutu, G. K., Fan, X.-R., Njeri, H. K., Wen, X.-Y., Liu, Y.-L., and Chen, Y.-Y. (2020b). Development and characterization of EST-SSR markers for the endangered tree Magnolia patungensis (Magnoliaceae). Ann. Bot. Fennici 57, 97–107. doi: 10.5735/085.057.0114
Wagutu, G. K., Njeri, H. K., Fan, X. R., and Chen, Y. Y. (2020a). Development and transferability of SSR primers in the wild rice Zizania latifolia (Poaceae). Plant Sci. J. 38, 105–111. doi: 10.11913/PSJ.2095-0837.2020.10105
Wang, H. M., Wu, G. L., Jiang, S. L., Huang, Q. N., Feng, B. H., Hunag, C. G., et al. (2015). Genetic diversity of Zizania latifolia Griseb. from Poyang Lake basin based on SSR and ISSR analysis. J. Plant Genet. Resour. 16, 133–141. doi: 10.13430/j.cnki.jpgr.2015.01.020
Wang, I. J., and Bradburd, G. S. (2014). Isolation by environment. Mol. Ecol. 23, 5649–5662. doi: 10.1111/mec.12938
Wang, T., Wang, Z., Xia, F., and Su, Y. (2016). Local adaptation to temperature and precipitation in naturally fragmented populations of Cephalotaxus oliveri, an endangered conifer endemic to China. Sci. Rep. 6, 25031. doi: 10.1038/srep25031
Wang, Y., Huang, L., and Fan, L. (2013). Main agronomic traits, domestication and breeding of Gu (Zizania latifolia). J. Zhejiang Univ. 39, 629–635. doi: 10.3785/j.issn.1008-9209.2013.01.251
Wang, Z., Song, K., Ma, W., Ren, C., Zhang, B., Liu, D., et al. (2011). Loss and fragmentation of marshes in the Sanjiang Plain, Northeast China, 1954–2005. Wetlands 31, 945–954. doi: 10.1007/s13157-011-0209-0
Warren, D. L., Glor, R. E., and Turelli, M. (2008). Environmental niche equivalency versus conservatism: quantitative approaches to niche evolution. Evolution 62, 2868–2883. doi: 10.1111/j.1558-5646.2008.00482.x
Warren, D. L., Matzke, N. J., Cardillo, M., Baumgartner, J. B., Beaumont, L. J., Turelli, M., et al. (2021). ENMTools 1.0: an R package for comparative ecological biogeography. Ecography 44, 504–511. doi: 10.1111/ecog.05485
Wen, J. (2001). Evolution of Eastern Asian–Eastern North American Biogeographic Disjunctions: a few additional issues. Int. J. Plant Sci. 162, S117–S122. doi: 10.1086/322940
Wiens, J. A., Stralberg, D., Jongsomjit, D., Howell, C. A., and Snyder, M. A. (2009). Niches, models, and climate change: assessing the assumptions and uncertainties. Proc. Natl. Acad. Sci. U.S.A. 106, 19729–19736. doi: 10.1073/pnas.0901639106
Wilson, G. A., and Rannala, B. (2003). Bayesian inference of recent migration rates using multilocus genotypes. Genetics 163, 1177–1191. doi: 10.1093/genetics/163.3.1177
Wu, N., Wang, Y., Wang, Y., Sun, X., Faber, C., and Fohrer, N. (2022). Environment regimes play an important role in structuring trait- and taxonomy-based temporal beta diversity of riverine diatoms. J. Ecol. 110, 1442–1454. doi: 10.1111/1365-2745.13859
Wu, Y., Guo, L., Xia, Z., Jing, P., and Chunyu, X. (2019). Reviewing the Poyang lake hydraulic project based on humans' changing cognition of water conservancy projects. Sustainability 11, 2605. doi: 10.3390/su11092605
Wu, Z., Xu, X., Zhang, J., Wiegleb, G., and Hou, H. (2019). Influence of environmental factors on the genetic variation of the aquatic macrophyte Ranunculus subrigidus on the Qinghai-Tibetan Plateau. BMC Evol. Biol. 19:228. doi: 10.1186/s12862-019-1559-0
Wu., S, Yang, Q., and Zheng, D. (2003). Comparative study on eco-geographic regional systems between China and USA. Acta Geogr. Sinica 58, 686–694. doi: 10.11821/xb200305006
Xu, X.-W., Wu, J.-W., Qi, M.-X., Lu, Q.-X., Lee, P. F., Lutz, S., et al. (2015). Comparative phylogeography of the wild-rice genus Zizania (Poaceae) in eastern Asia and North America. Am. J. Bot. 102, 239–247. doi: 10.3732/ajb.1400323
Yamazaki, D., Ikeshima, D., Tawatari, R., Yamaguchi, T., O'Loughlin, F., Neal, J. C., et al. (2017). A high accuracy map of global terrain elevations Geophys. Res. Lett. 44, 5844–5853. doi: 10.1002/2017GL072874
Yu, C., Likun, L., Xiuyun, L., Wanli, G., and Bao, L. (2006). Isolation and characterization of a set of disease resistance-gene analogs (RGAs) from wild rice, Zizania latifolia Griseb. I. Introgression, copy number lability, sequence change, and DNA methylation alteration in several rice–Zizania introgression lines. Genome 49, 150–158. doi: 10.1139/g05-097
Zhang, Y., Zhang, Y., Qin, B., and Zhu, G. (2019). Evolution process and driving mechanism of lake ecological space in the middle and lower reaches of the Yangtze River. Environ. Process Sustain. Dev. 44, 33–36. doi: 10.19758/j.cnki.issn1673-288x.201905033
Zhao, Y., Song, Z., Zhong, L., Li, Q., Chen, J., and Rong, J. (2019). Inferring the origin of cultivated Zizania latifolia, an aquatic vegetable of a plant-fungus complex in the Yangtze river basin. Front. Plant Sci. 10, 1406. doi: 10.3389/fpls.2019.01406
Zhao, Y., Vrieling, K., Liao, H., Xiao, M., Zhu, Y., Rong, J., et al. (2013). Are habitat fragmentation, local adaptation and isolation-by-distance driving population divergence in wild rice Oryza rufipogon? Mol. Ecol. 22, 5531–5547. doi: 10.1111/mec.12517
Keywords: genetic structure, isolation by environment, landscape heterogeneity, latitudinal gradient, microsatellite markers, Zizania latifolia
Citation: Wagutu GK, Fan X, Fu W, Tengwer MC, Li W and Chen Y (2022) Genetic structure of wild rice Zizania latifolia in an expansive heterogeneous landscape along a latitudinal gradient. Front. Ecol. Evol. 10:929944. doi: 10.3389/fevo.2022.929944
Received: 27 April 2022; Accepted: 30 June 2022;
Published: 25 July 2022.
Edited by:
Naicheng Wu, Ningbo University, ChinaReviewed by:
Zhiqiang Lu, Xishuangbanna Tropical Botanical Garden (CAS), ChinaJun Rong, Nanchang University, China
Copyright © 2022 Wagutu, Fan, Fu, Tengwer, Li and Chen. This is an open-access article distributed under the terms of the Creative Commons Attribution License (CC BY). The use, distribution or reproduction in other forums is permitted, provided the original author(s) and the copyright owner(s) are credited and that the original publication in this journal is cited, in accordance with accepted academic practice. No use, distribution or reproduction is permitted which does not comply with these terms.
*Correspondence: Yuanyuan Chen, yychen@wbgcas.cn