Orbital Influence on Precipitation, Fire, and Grass Community Composition From 1.87 to 1.38 Ma in the Turkana Basin, Kenya
 Chad L. Yost1,2*
  Rachel L. Lupien3
  Catherine Beck4
  Craig S. Feibel5
  Steven R. Archer6 Andrew S. Cohen2
- 1Department of Earth and Environmental Systems, Indiana State University, Terre Haute, IN, United States
- 2Department of Geosciences, University of Arizona, Tucson, AZ, United States
- 3Division of Biology and Paleo Environment, Lamont-Doherty Earth Observatory, Palisades, NY, United States
- 4Department of Geosciences, Hamilton College, Clinton, NY, United States
- 5Department of Earth and Planetary Sciences, Rutgers University, Piscataway, NJ, United States
- 6School of Natural Resources and the Environment, University of Arizona, Tucson, AZ, United States
The Turkana Basin in northern Kenya and southern Ethiopia has yielded hundreds of hominin fossils and is among the most important localities in the world for studying human origins. High resolution climate and vegetation reconstructions from this region can elucidate potential linkages between hominin evolution and environmental change. Microcharcoal and phytoliths were examined from a 216 m (1.87–1.38 Ma) drill core (WTK13), which targeted paleo-Lake Lorenyang sediments from the Nachukui Formation of the Turkana Basin. A total of 287 samples were analyzed at ∼32–96 cm intervals, providing millennial-scale temporal resolution. To better understand how basin sediments record fire and vegetation from the watershed, the paleorecord was compared with nine modern sediment samples collected from Lake Turkana along a transect of increasing distance from the 1978 to 1979 shoreline. This included vegetation surveys and phytolith production data for species from areas proximal to the basin. We found that phytolith and microcharcoal concentrations decreased predictably moving off shore. However, phytoliths from plants sourced in the Ethiopian Highlands increased moving off shore, likely the result of increased exposure to the Omo River sediment plume. In our down-core study, microcharcoal was well-preserved but phytolith preservation was poor below ∼60 m (∼1.50 Ma). Spectral analysis revealed that microcharcoal often varied at precessional (∼21 kyr) periodicities, and through a correlation with δDwax, linked orbitally forced peaks in precipitation with elevated fire on the landscape. Phytoliths revealed that alternating mesic C4 versus xeric C4 grass dominance likely varied at precessional periodicities as well, but that grass community composition was also mediated by basin geometry. Two high eccentricity intervals of particularly high amplitude and abrupt environmental change were centered at ∼1.72 and 1.50 Ma, with the intervening period experiencing high fire variability. With the switch from lacustrine to fluvial-deltaic deposition at the core site by 1.5 Ma, mesic C4 grasses dominated and fire activity was high. This upper interval correlated to the time interval from which Nariokotome Boy (Homo erectus/ergaster) was discovered 3 km east of our drill site. Phytoliths indicated a seasonally wet and open landscape dominated by xeric C4 grasses, sedges, and other herbaceous plants.
Introduction
The Turkana Basin in northern Kenya and southern Ethiopia is among the most important localities in the world for studying human origins. Its hydrological connection to the Ethiopian Highlands and its geological setting within the East African Rift System has combined to produce fossil-rich sedimentary strata yielding hundreds of hominin fossils from species of Australopithecus, Kenyanthropus, Paranthropus, and Homo (Feibel, 2011; Wood and Leakey, 2011). Lake Turkana is the largest desert lake in the world, and a series of predecessors to the modern lake have occupied this basin periodically since at least the Miocene (Brown and McDougall, 2011). The Hominin Sites and Paleolakes Drilling Project (HSPDP) targeted Early Pleistocene sediments from paleo-Lake Lorenyang (HSPDP-WTK13-1A drill core; hereafter WTK13), a precursor to present-day Lake Turkana, to reconstruct regional climate and vegetation in relatively close spatial and temporal proximity to important hominin sites (Cohen et al., 2016; Campisano et al., 2017). This includes the Nariokotome site (NK3) and its hominin remains (Nariokotome Boy, KNM-WT 15000) located ∼3 km from the drill site; NK3 yielded the most complete Homo erectus/ergaster skeleton ever recovered (Brown et al., 1985; Walker and Leakey, 1993).
The recovered drill core interval of 1.87–1.38 Ma coincides with the first occurrence of hominins with modern, human-like terrestrial adaptations, the expansion of grasslands, and the first hominin expansions outside of Africa (Antón, 2003; Bobe, 2004; Bobe and Leakey, 2009; Campisano et al., 2017). Mammalian turnover and diversity peaks at ∼1.8 Ma and includes the co-occurrence of Paranthropus boisei, Homo habilis, Homo rudolfensis and Homo erectus (Bobe and Carvalho, 2019). This period in the Turkana Basin has also yielded one of the oldest archaeological sites with Acheulean stone tool technology (Lepre et al., 2011) and the earliest evidence of aquatic resource subsistence by hominins (Braun et al., 2010). In addition, fossils attributed to Homo in the Turkana Basin show an apparent increase in the consumption of C4 vegetation (or animals that consume C4 plants) after 1.65 Ma (Patterson et al., 2019). Archaeological sites in East Turkana (Koobi Fora) exhibit potential evidence for the intentional use of fire at ∼1.5 Ma (Hlubik et al., 2019).
When evaluating potential environmental drivers of human evolution and cultural change, spatially and temporally relevant vegetation reconstructions are essential. Although isotopic approaches can provide information about vegetation structure (e.g., grassland, woodland, forest), they are limited in their taxonomic resolution. In grass-dominated plant communities, phytoliths (opal silica microfossils) and microcharcoal can reconstruct grass community dynamics and fire regimes important to understanding how herbivores and hominins may have interacted with their surroundings (e.g., Yost et al., 2021), and complement related isotopic studies (e.g., Lupien et al., 2021).
Essential to the use of phytoliths and microcharcoal to reconstruct vegetation from paleolake sediments is an understanding of phytolith source areas and depositional patterns in modern lakes. Because such studies are rare (see Yost et al., 2013; Li et al., 2019), the examination of modern Lake Turkana sediments provides an opportunity to elucidate these phenomena in a context appropriate for better understanding phytolith and microcharcoal records from much older lacustrine deposits in the Turkana Basin. Additionally, use of modern lake sediments originally collected in 1978 (Cohen et al., 1986) pre-dates significant anthropogenic perturbations including construction of the Gibe I dam in the Ethiopian Highlands, significant changes in the Omo River delta configuration, and delta land-use intensification since the 1970s (Carr, 2017).
Here, we present a millennial-scale record of fire and vegetation through the use of plant opal phytoliths and microcharcoal for the Early Pleistocene in the Turkana Basin. By incorporating an understanding of the sediments and dominant vegetation from modern Lake Turkana we are able to better understand how the potential phytolith landscape (phytoscape) is recorded in sediments across the lake, and quantify how sediments from the Omo River may influence this signal. We then use phytoliths and microcharcoal extracted from the WTK13 paleorecord to reconstruct dominant vegetation and fire activity during the Early Pleistocene. We explore these data using spectral analyses to reveal the influence of Earth’s orbital parameters on vegetation, in particular grass community composition, and fire. Lastly, we use a core-to-outcrop linkage to reconstruct the local paleoenvironment present when the Nariokotome Boy walked upon the landscape.
Background
Geography, Climatology, Limnology
Lake Turkana is a closed-basin lake approximately 250 km long and 30 km wide situated in an arid depression between the Kenyan and Ethiopian Highlands (Figures 1A,E). The lake surface is at an elevation of ∼360 m; mean and maximum depths are 35 and 120 m, respectively (Johnson and Malala, 2009). The dominant vegetation type within the Turkana Depression is arid-adapted Acacia-Commiphora deciduous bushland and desert. However, the watershed includes small areas of riverine and afromontane forests, freshwater swamps, and a large area of dry Combretum wooded grasslands (Figure 1B).
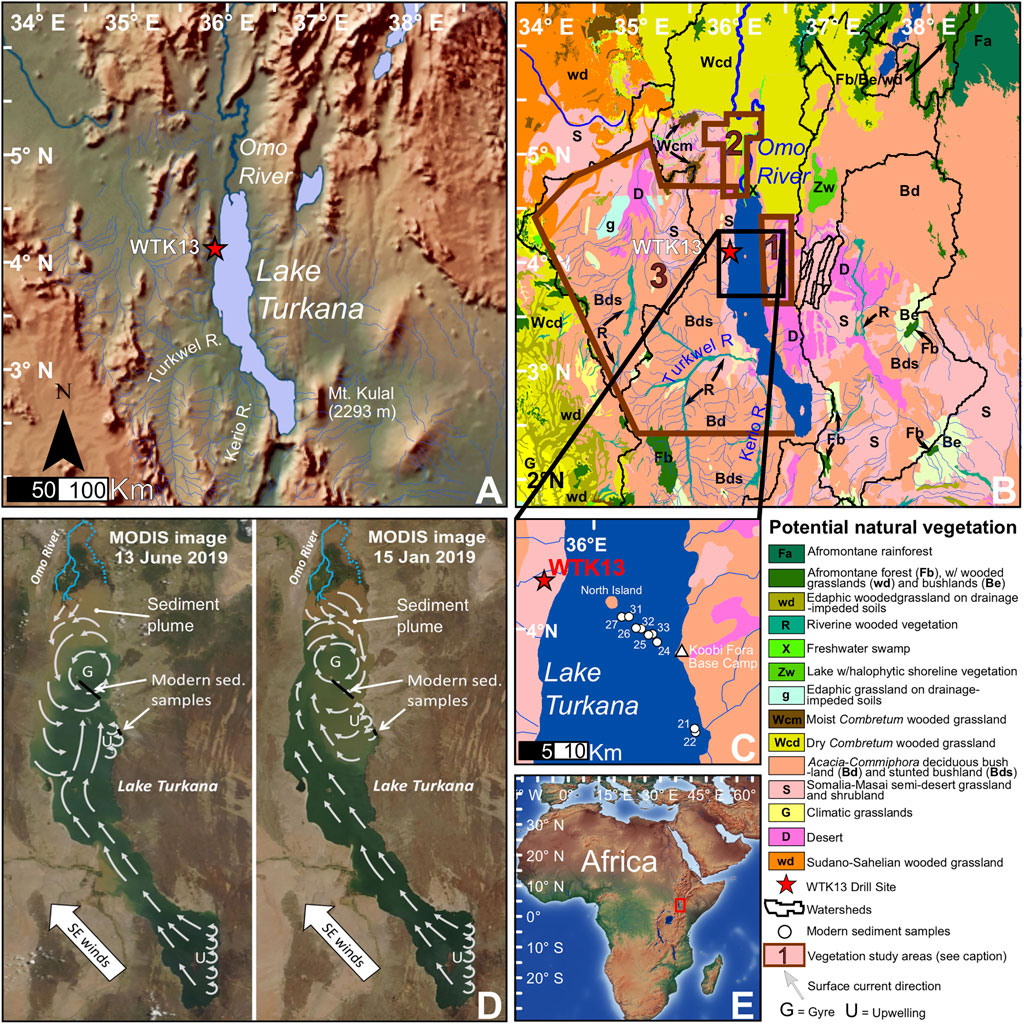
FIGURE 1. Study area maps. (A) Colored relief map of the Turkana Depression. (B) Potential natural vegetation (PNV; van Breugel et al., 2015) of the Turkana Depression and floristic study area boundaries (1 = Koobi Fora [East Turkana], 2 = Lower Omo River Valley, 3 = West Turkana). (C) Modern Lake Turkana sediment sample locations. (D) MODIS satellite images (NASA, 2019) depicting the Omo River sediment plume, and inferred surface currents redrawn from Yuretich and Cerling (1983). (E) Colored relief map of Africa with the Turkana Basin location indicated with the red box.
The Turkana Depression has a mean annual temperature of ∼30°C, with a mean maximum and minimum of 34 and 24°C, respectively (Morrissey et al., 2017). Historic (1925–1990) mean annual precipitation (MAP) is ∼200 mm, and is delivered over two rainy seasons: the ‘long rains’ during boreal spring and the ‘short rains’ during boreal autumn (Nicholson, 2000). The Ethiopian Highlands to the north receive about 800–1,200 mm MAP, mostly during boreal summer (Nicholson, 2017). The Omo River, which drains a portion of the Ethiopian Highlands, supplies 80–90% of the water in the lake (Yuretich and Cerling, 1983). Its sediment plume is dispersed throughout much of the northern lake basin via seasonal gyres (Figure 1D; Hopson, 1975; Yuretich and Cerling, 1983). The Turkwel and Kerio rivers, draining a portion of the Kenyan Highlands to the south, supply 10–20% of the lake water (Johnson and Malala, 2009). However, strontium isotope data indicates that the proportion of Turkwel to Omo river water may have been significantly higher during past humid periods (van der Lubbe et al., 2017). Thus, the Turkana Basin is hydrologically connected to two different precipitation modes, bimodal (spring and autumn) in the Kenyan Highlands and locally unimodal (summer) in the Ethiopian Highlands.
The Omo River and Lake Turkana surface waters have an average pH of 7.1 and 9.2, respectively (Yuretich and Cerling, 1983), and biogenic silica (diatoms, sponge spicules, and phytoliths) can begin to rapidly dissolve when sediment pore water pH is >9.0 (Fraysse et al., 2009). However, measurements of pore water pH on short cores from Lake Turkana yielded values of ∼8.6 for depths of up to 120 cm. The release of carbonic acid from organic matter decay is thought to be the mechanism for lowering pH from that observed in surface waters (Yuretich and Cerling, 1983). The Turkana Depression is extremely windy, with prevailing winds out of the south/southeast producing surface currents that generally move towards the north end of the lake (Figure 1D; Yuretich and Cerling, 1983; Johnson and Malala, 2009). Lake Turkana is classified by Nutz et al. (2016) as a wind-driven waterbody, where wind and wave action have pronounced effects on surface currents, bottom currents, upwelling, shoreline stability, and sedimentation patterns. There is high-resolution seismic profile evidence for the existence of erosion or non-deposition caused by surface wave activity at sites where water depths are <35 m (Johnson and Malala, 2009). Our study provides new information on terrestrial microfossil transport and biogenic silica preservation in both modern and paleo-lake sediments from the Turkana Basin that can be applied to other large lake paleolimnological studies.
Eastern African Rainfall Seasonality
Areas between 7° S and 6° N in eastern Africa experience strong bimodal (spring and autumn) distributions of maximum precipitation. At 20° S and 20° N, maximum precipitation is unimodal during each hemisphere’s summer (Nicholson, 2018). Summer precipitation in the Ethiopian Highlands is triggered by the onset of low-level westerlies, peaking in July/August. Low-level cyclonic flow over the Arabian Peninsula promotes the development of westward propagating convective systems (Nicholson, 2017). In a reanalysis study, Viste and Sorteberg (2013) found that moisture sources for convergence in the highlands were from three main regions: the Indian Ocean, the Congo Basin, and the Red Sea/Mediterranean Sea, with the Gulf of Guinea (Atlantic Ocean) contributing the least amount.
The mechanisms behind the bimodal distribution of rainfall in eastern Africa have been attributed by many to the twice-yearly passing of the tropical rain belt (Nicholson, 2018). Recently, Yang et al. (2015) proposed that bimodal precipitation is the result of the annual cycle of monsoonal winds combining with the annual cycle of the Indian Ocean sea surface temperatures (SSTs). During boreal winter and summer, precipitation is suppressed due to advection of low-moist static energy (MSE) air from a cooler off-shore Indian Ocean. During the two rainy seasons, low-level divergent winds are much weaker, allowing for the import of unstable air into eastern Africa; SSTs off the coast are higher, with the highest levels associated with the long rains.
Orbital Forcing in the Turkana Basin
Relationships between paleosol formation, paleolake high stands, depositional processes and Earth’s orbital parameters in the Turkana Basin have been recognized for some time (e.g., Wynn, 2004; Trauth et al., 2005; Lepre et al., 2007). Research in this area continues to expand and shows that eccentricity (400, 100 kyr) and precession (23–19 kyr) are major drivers of hydroclimate and lake level variability (Joordens et al., 2011; Joordens et al., 2013; Nutz et al., 2017; Lupien et al., 2018; Boës et al., 2019). However, volcano-tectonic impounding likely played a role in lake formation within the Turkana Basin as well (Bruhn et al., 2011; Lepre, 2014; Boës et al., 2019). Nevertheless, first-order observations in stratigraphic records (e.g., Nutz et al., 2017; Nutz et al., 2020; Boës et al., 2019) indicate that some, but not all paleolake transgressive (regressive) phases and high (low) stands occur during periods of eccentricity maxima (minima). Stratigraphic and isotopic studies from the Turkana Basin have found that low precession, which results in high insolation, is correlated with increased precipitation within the watershed (Lupien et al., 2018), progradation within the lake (Nutz et al., 2017), and increased river inflow to the lake (Joordens et al., 2011; van der Lubbe et al., 2017).
Causal mechanisms between increased insolation and increased precipitation in the tropics and subtropics are not fully understood, but researchers typically invoke the orbital monsoon hypothesis (Kutzbach and Otto-Bliesner, 1982; Rossignol-Strick, 1983; Prell and Kutzbach, 1987; Tuenter et al., 2003; Merlis et al., 2013). Essentially, high (low) eccentricity amplifies (modulates) the precession parameter and increases (decreases) insolation levels during boreal summer; higher insolation is thought to increase latitudinal and land–sea temperature gradients, evaporation, monsoon circulation, and convection (Ruddiman, 2008). Chandan and Peltier (2020) also show that insolation in combination with vegetation, soil, and lake feedbacks are necessary to achieve and sustain significant increasing in precipitation. Our study provides a new understanding of how grass community composition and fire regimes within the Turkana Basin have responded to changes in Earth’s orbital parameters.
Materials and Methods
Drill Core Extraction and Chronology
A single borehole, deviated 10° from vertical, was cored to a depth of ∼216 m in West Turkana (4°6′34.92″ N, 35°52′18.48″ E) in June–July 2013 (Figure 1). The drill site was chosen for its proximity to outcrop exposures of the correlative type sections of the Kaitio and Natoo members of the Nachukui Formation, which are locally dipping at ∼5° W (Harris et al., 1988). The stratigraphy records deposition on a dynamic lacustrine margin which experienced repeated transgressive and regressive events (Beck, 2015). Borehole instability and/or high-pressure groundwater resulted in high torque and required the termination of drilling operations at the maximum depth. The WTK13 core was shipped via airfreight to LacCore, the National Lacustrine Core Facility (University of Minnesota, United States) for full scanning, processing, description, and subsampling. Full coring details and initial core descriptions are presented in Cohen et al. (2016). An age model (Supplementary Figure S1) was developed by Lupien et al. (2018) using tephra correlation, direct 40Ar/39Ar dating of a new tephra, and a paleomagnetic reversal (Sier et al., 2017). Core depths are reported in meters below surface (mbs), and core lithology is provided in Supplementary Figure S2.
Lake Turkana Modern Sediment Transect
Modern sediment samples from Lake Turkana were collected by A. Cohen in 1978–1979 using an Ekman dredge. Nine of these samples extending along a NW-SE transect from offshore of Koobi Fora (East Turkana) to North Island were subsampled for phytolith and microcharcoal analysis (Figure 1C). Distance from the eastern shoreline for the selected samples ranged from 0.15 to 15.7 km. Sample distances from the leading edge of the modern Omo River delta plain average around 60 km for most (Figure 1), but the delta plain has advanced ∼20 km southward since 1975 (see Carr, 2017). Straight-line distances from the eastern and western shorelines, grain size classifications, and lake depths were recorded for each sample (Table 1). Sample mass and volume are provided in Supplementary Material S1.
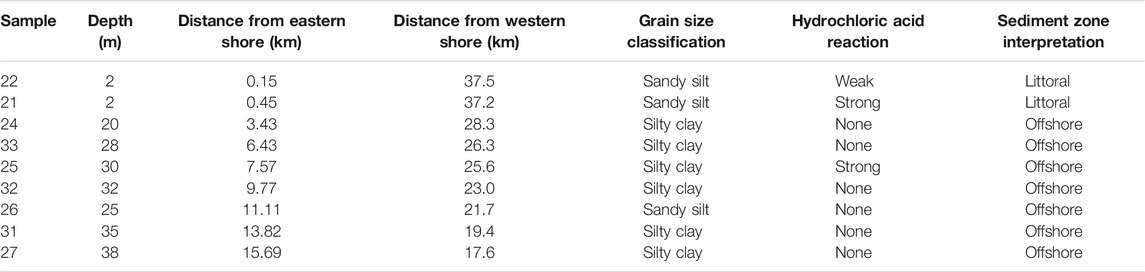
TABLE 1. Modern Lake Turkana sediment sample characteristics.
Modern Vegetation and Phytoscape
Plant species occurrence data were aggregated from Olang (1984), Carr (2017), and Mbaluka and Brown (2016) for West Turkana (WTK), the Lower Omo River Valley (LOR), and Koobi Fora (East Turkana; ETK), respectively (Supplementary Table S1). Boundaries for these three floristic study areas are depicted in Figure 1B. Emphasis was placed on grasses because of their prolific phytolith production and taxonomic distinctiveness. For each species of grass, dominant phytolith morphotype production was determined from published accounts or lead author Yost’s phytolith reference collection (Supplementary Table S1). Grass species occurrence and the relative abundance of lobates (bilobates and crosses), rondel, and saddle phytoliths produced by those species were used to identify a grass short-cell phytoscape signature for each of the three floristic study areas.
The plant species occurrence data for LOR and ETK were also compared to a compilation of woody plants in Africa known to produce phytoliths to determine the potential for LOR and ETK to produce an arboreal phytoscape signal (Supplementary Tables S2, S3). Samples from the modern Lake Turkana sediment transect were then compared to the phytoscape signatures to determine how distance from shore and proximity to the Omo River sediment plume affected the phytolith record.
Microfossil Separations, Microscopy, and Classification
The samples for phytolith and microcharcoal analyses were collected at 32 cm intervals along the entire 215.8 m core by removing 1 cm3 of sediment. Samples for microfossil extraction were selected at 96 cm intervals (206 samples) for a coarse resolution analysis to assess biogenic silica preservation. Additional samples at 32 cm intervals were then selected for extraction from the intervals with good biogenic silica preservation, yielding a total of 287 paleolake samples and 9 modern lake samples for analysis. Phytoliths and microcharcoal particles were co-extracted using the wet oxidation and heavy-liquid density separation method described by Yost et al. (2021). Synthetic microspheres were added to each sample in order to calculate concentrations; the number added varying by the amount of extracted residue (Supplementary Materials S1, S2).
For microscopy, entire samples or subsamples of the extract were mounted on slides using Type-A immersion oil and the cover glass was sealed with fingernail polish. Mounting in immersion oil allows for easy phytolith rotation when pressure is applied to the cover glass. This rotation is essential for many phytolith identifications and for differentiation between Arecaceae globular echinate phytoliths and freshwater sponge spherasters (Yost et al., 2021). Phytolith and microcharcoal counting was conducted using an Olympus BX-43 transmitted-light microscope at 400× magnification, with a goal of counting 200 Iph and D/P° index-specific phytoliths to minimize statistical uncertainties (Strömberg, 2009).
Phytoliths were classified into 41 morphotypes (Supplementary Materials S1, S2). Primary descriptive references, anatomical origin, and taxonomical interpretation for each morphotype are described in Yost et al. (2021). Bilobates and crosses in this study were not classified into the Neumann super types as Yost et al. (2021) had done for the paleo-Lake Baringo core (BTB13) because most of the samples from this core had been counted before classifying the BTB13 samples. Each broken bilobate phytolith counted was given a value of 0.5.
Microcharcoal was identified (absolute counts) using the diagnostic characteristics described by Turner et al. (2008), with particular emphasis on avoiding misidentifications of pyrite and naturally-darkened unburned plant fragments as charcoal. Two microcharcoal size classes (<50 μm and >50 μm) were originally tallied, but later combined for change point and spectral analyses because of the intermittent occurrence and low abundance of the larger size class. Sponge spicules, sponge spherasters, and chrysophycean cysts were also identified and counted. Detailed descriptions of these microfossils can be found in Yost et al. (2021).
Phytolith dissolution, which can affect preservation and result in morphotype assemblage bias, was determined based on i) the presence of zeolites and evaporites in the phytolith extracts (especially when no phytoliths were observed), and ii) the presence of pits, breakage, and re-precipitation of silica on phytolith, diatom, and sponge spicule surfaces. The biogenic silica dissolution sequence described by Yost et al. (2021) for alternating high and low pore water pH was also used as a dissolution indicator.
Numerical Calculations, Statistics, and Time-Series Analysis
Relative-abundance percentages were based on the total phytolith count for each sample. Concentrations were calculated from the microsphere counts and starting volume of the sample (Supplementary Materials S1, S2). Relative abundance determinations of C3, C4 mesic, and C4 xeric grass phytoliths were based only on grass silica short-cell (GSSC) phytoliths attributed to those plant functional types (per Yost et al., 2021). The tree cover index (D/P°), used to discriminate between open (shrubland to wooded grassland, 0–40% canopy cover), woodland (40–80% canopy cover), and forest (80–100% canopy cover) formations, and the aridity (Iph) phytolith index, used to discriminate short-grass xerophytic (Sahelian) savanna from tall-grass mesophytic (Sudanian) savanna were calculated as described in Bremond et al. (2008) and Novello et al. (2017) using the specific morphotypes listed in Yost et al. (2021). The 95% confidence intervals for the D/P° and Iph indices were determined by nonparametric bootstrap resampling using the “boot” and “simpleboot” packages in R (R Core Team, 2018) and the R code in Yost et al. (2021). The rolling Spearman correlation was conducted using the R package “RollWinMulCor” (Polanco-Martínez, 2020). Prior to correlation analysis, δDwax and microcharcoal concentrations were converted to z-scores and interpolated to 3,100-yr time steps. For spectral analysis, the periodogram and bivariate cross-wavelet power spectrum were produced using the R packages “astrochron” (Meyers, 2014) and “WaveletComp” (Roesch and Schmidbauer, 2018), respectively. Prior to the spectral analyses, microcharcoal concentrations were log transformed, detrended, and linearly interpolated to a 3,100-yr time-step. All other descriptive, regression, and correlation statistics were conducted in R.
Zonation of the WTK13 Core
The phytolith record could not be used to develop a zonation because dissolution throughout most of the core biased phytolith assemblages and negatively affected phytolith preservation and concentrations. Microcharcoal concentrations provided a continuous record and zone boundaries were identified from the change point analysis of log transformed microcharcoal concentrations using the R package “ecp”. (James and Matteson, 2014). The E-Divisive method from the ecp package is a nonparametric procedure that is able to estimate multiple change point locations that are statistically significant (set at 0.05) without a priori knowledge of the number of change points. This iterative process analyzes changes in both slope (trend) and mean.
Results
Modern Grass Occurrence and Phytoscape
A total of 80 grass species from 38 genera occurred within the modern WTK, LOR, and ETK floristic areas (Supplementary Table S1). Highest species richness was found for Sporobolus (10 species), followed by Enneapogon (5), Eragrostis (5), Panicum (5), and Dactyloctenium (4). The only C3 grass was Phragmites (common reed), an obligate wetland plant. At the subfamily level, 40 species (51%) were Chloridoideae, 34 (43%) were Panicoideae, and 4 (5%) were Aristidoideae (Table 2). Only one Arundinoideae grass (Phragmites) was noted, and in being a C3 obligate wetland grass was predictably from the LOR area. No taxa from the C3 grass subfamily Pooideae were listed in any of the study regions. Chloridoideae grasses, which are typically arid-adapted and drought tolerant, were most common in ETK and WTK (55–60%), and less common in LOR (48%), although a χ2 contingency test shows these differences are not statistically significant. Panicoideae taxa, which typically thrive under more humid and mesic conditions, were most common for LOR (41%) and less common in ETK and WTK (20–30%).
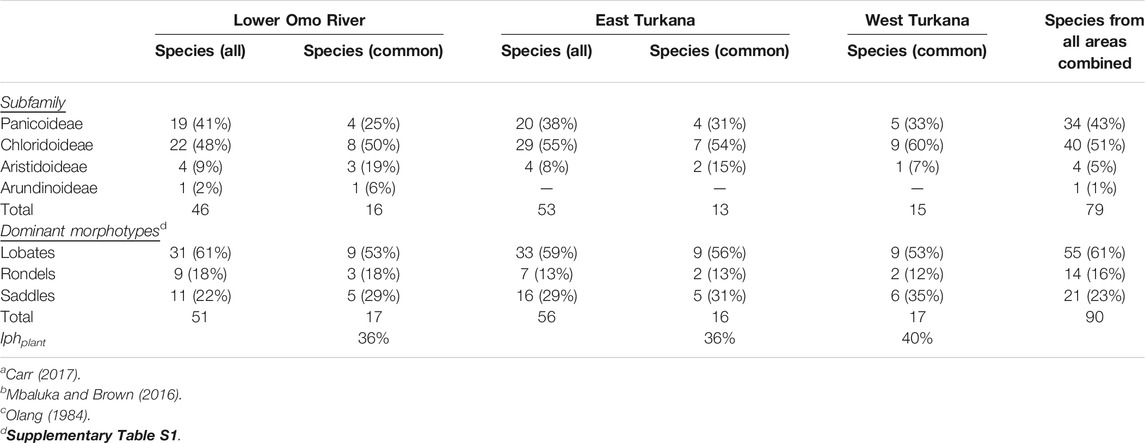
TABLE 2. Grass subfamily occurrence based on Lower Omo River Valleya, East Turkanab and West Turkanac floristic studies, and potential dominant phytolith morphotypes.
Regarding phytolith morphotype production, lobates were slightly more common in LOR grasses (61%), versus 59 and 53% for ETK and WTK grasses, respectively. Saddles were generally more common for ETK grasses (29%) and WTK grasses (35%) than for LOR grasses (22%). Rondels were slightly more represented in LOR grasses (18%), than for ETK (13%), and WTK (12%) grasses. Overall, the GSSC phytoscapes for LOR, ETK, and WTK were strikingly similar. Calculated Iph aridity index values based simply on the dominance of either lobates or saddles for the most commonly listed grasses were 36% (LOR), 36% (ETK), and 40% (WTK).
For woody plant phytolith production, LOR and ETK had nine and six species respectively, in genera known to produce globular granulate phytoliths. Additionally, both LOR and ETK had two woody species known to produce other types of woody tissue phytoliths. Although these numbers are similar, the ETK study area is only 0.3% woodland, and 0.1% forest (Mbaluka and Brown, 2016). Vegetation cover was not mentioned by Carr (1998) at LOR, but our GIS-based estimates from their maps put woodland and forest cover at ∼ 7 and 16%, respectively.
Modern Lake Turkana Sediments
Microcharcoal was observed in all samples. Concentrations ranged from 676 to 5.14 × 104 cm−3 (Figure 2A). Concentrations decreased exponentially (r2 = 0.72, p = 0.01) with increasing distance from shoreline, becoming asymptotic at concentrations <10,000 cm−3 and distances >6 km. Sponge spicules and spherasters were typically most abundant within 6.5 km of the shoreline, and single occurrences of chrysophyte cysts were observed in two samples (Supplementary Figure S3). Phytolith preservation was good, with low to moderate dissolution on phytolith surfaces. Phytolith concentrations ranged from 38 to 1.65 × 105 cm−3 (Figure 2B), and decreased linearly (r2 = 0.54, p = 0.04) with increasing distance from shoreline. An extreme outlier value (sample 27) was removed prior to the regression analysis (a possible reason for this outlier value is discussed in Phytolith and Microcharcoal Deposition in the Modern Lake System). The Iph aridity index also decreased linearly (r2 = 0.45, p = 0.05) as distance from shoreline increased (Figure 2E). With one exception, the D/Pº tree cover index was low and did not vary with distance from shoreline. The exception was Sample 25, which yielded a D/P° value of 1.22, which is within the range of savanna woodlands (Figure 2F; Supplementary Material S1). The percentage of broken bilobate phytoliths increased linearly with increasing distance from shoreline (Figure 2G; r2 = 0.61, p = 0.01). The average abundance of broken phytolith samples collected between 0.2 and 0.5 km offshore was 57 ± 10% (n = 2), whereas the average value for samples 3–16 km offshore was 73 ± 4% (n = 7). The relative abundance of large phytoliths (bulliforms and trichomes) decreased linearly (r2 = 0.80, p = 0.001), whereas that of small GSSC phytoliths increased linearly (r2 = 0.41, p = 0.07) as distance from shoreline increased (Figures 2C,D).
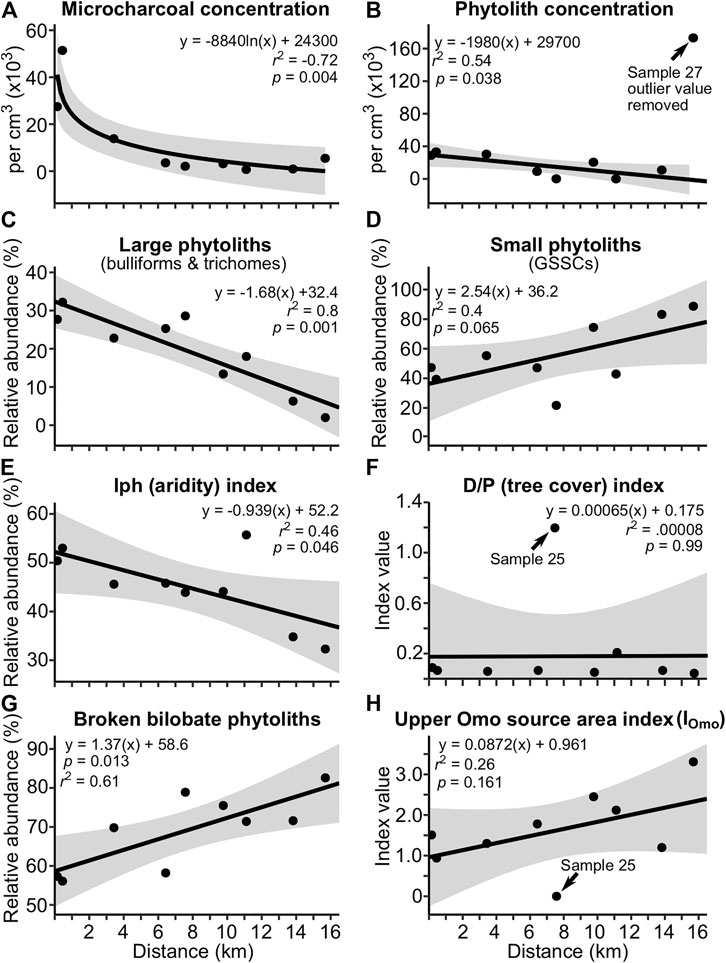
FIGURE 2. Relationship between distance from shoreline and the relative abundance of selected phytolith and microcharcoal constituents of modern Lake Turkana sediment samples. Shaded regions represent regression 95% confidence intervals. Sample location numbers for points on the graphs are (left to right): 22, 21, 24, 33, 25, 32, 26, 31, and 27, respectively. As distance from shoreline increases, exposure to the Omo River sediment plume and proximity to the north basin gyre increases, but distance to the mouth of the Omo River does not appreciably change (see Figure 1D). (A) Microcharcoal concentrations decrease exponentially as distance from shoreline increases. (B) Phytolith concentrations decrease linearly as distance from shoreline increases. (C) Large-sized phytoliths decrease and (D) small-sized phytoliths increase as distance from shoreline increases. (E) The grass-based Iph (aridity) index decreases as distance from shoreline increases, presumably from the presence of phytoliths derived from the Omo River Valley. (F) The D/P° tree cover index shows no relationship with distance from shoreline, presumably because phytolith-rich grasses are much more abundant than trees that produce phytoliths in both the Turkana Basin and Omo River Valley. (G) Broken bilobates increase as distance from shoreline increases, presumably because they are smaller, but also because some proportion may have been transported long-distance from the Omo River Valley. (H) Phytoliths derived from plants sourced to the Omo River Valley increase as distance from shoreline increases. See Table 3 for details on the IOmo index.
Using results of the modern vegetation study compilation and the recovery of phytoliths diagnostic of plants found only above ∼1,500 m (Podostemaceae) and ∼2000 m (C3 Pooideae grasses) in the modern and paleolake samples, we created a new index called the upper Omo River watershed source area index (IOmo; Table 3). The IOmo index is calculated by dividing the sum of phytoliths derived from plants found in the upper Omo River watershed by the total sum of phytoliths counted. The IOmo scatter plot shows a trend of increasing index values with increasing distance from shore (Figure 2H), but the relationship was not statistically significant, in part, because Sample 25 had an IOmo index value of zero; with exclusion of sample 25, a moderately significant linear relationship emerges (r2 = 0.44, p = 0.07). Regardless, the index has promise, as later discussed in Section 5.2.
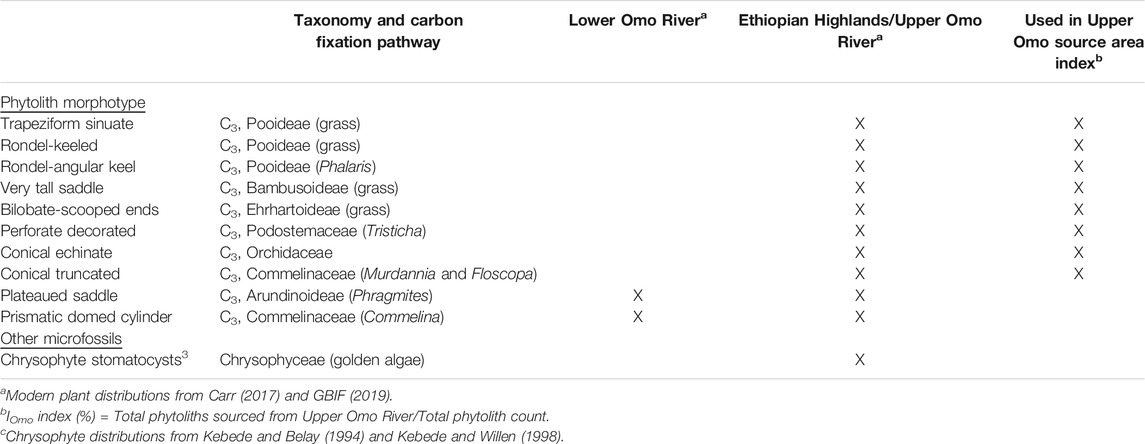
TABLE 3. Microfossils recovered from WTK13 and most likely derived from the lower and upper reaches of the Omo River based on modern plant and algae distributions.
Paleo-Lake Lorenyang (WTK13) Samples
Phytolith preservation and recovery in WTK13 varied from excellent to poor, with extensive intervals yielding few to no phytoliths, most likely the result of biogenic silica dissolution (Figure 3; Supplementary Material S2). Of the 287 WTK13 samples analyzed, 29 (10%) yielded no phytoliths. The majority of samples, 119 (41%), yielded phytoliths, but the counts (concentrations) were either very low, or the phytolith assemblages were likely biased from dissolution, which precluded reliable and robust index calculations. However, 90 samples (31%) occurring in four discreet intervals (Figure 3B), yielded well-preserved phytoliths with no evidence of morphotype assemblage bias. Among these, phytolith counts ranged from 0 to 10,326 (
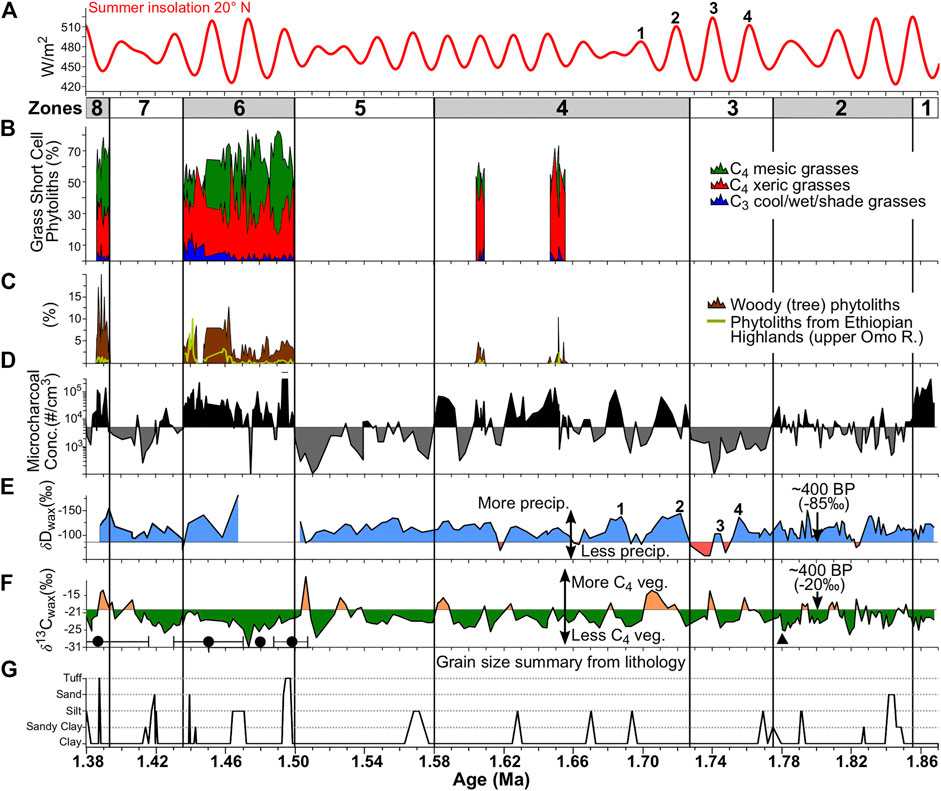
FIGURE 3. Summary phytolith and microcharcoal datasets (this study) and leaf wax δ13C and δD datasets (Lupien et al., 2018) from WTK13. (A) Summer 20° N insolation from Laskar et al. (2004). The numbered insolation peaks were tied to corresponding peaks in depleted δDwax values depicted here in panel E by Lupien et al. (2018). (B) C3 and C4 grass relative abundance derived from grass short-cell phytoliths. (C) Tree/shrub phytoliths relative to total phytolith sum, and the IOmo index indicating relative abundance of phytoliths sourced from the Ethiopian Highlands (Table 2). (D) Microcharcoal concentrations (log scale) with horizontal reference line at 5,000 cm−3 to highlight the zonal changes. (E, F)δDwax and δ13Cwax values from (Lupien et al., 2018), with horizontal reference lines set at the late Holocene δDwax and δ13Cwax values for Lake Turkana from Morrissey (2014). Black circles (tephrocorrelations and 40Ar/39Ar dating) and the black triangle (magnetic reversal) represent chronostratigraphic control points used in the age model. (G) Grain size summarized from the WTK lithological core description (see SOM Figure 2).
Correlation and Spectral Analyses
Spectral analysis of microcharcoal concentrations at 3,100-yr time steps detected precessional periodicities of 21.3 and 19.6 kyr with power above the 95% confidence level (Figure 4). Cross-wavelet analysis between δDwax and microcharcoal concentrations identified several intervals with high common power (variability at same statistically significant periodicity) over orbital and non-orbital periodicities (Figures 5B,D), including three intervals near and within the precession band (19–23 kyr). A large interval of high common power spans 1.75 to 1.66 Ma over periodicities between 23 and 41 kyr (centered on ∼33 kyr), and another interval is found from 1.84 to 1.70 Ma along a narrow periodicity band centered on 78 kyr. Almost all of the high common power areas indicate anti-phasing (anticorrelation), where more positive δDwax values are correlated with lower microcharcoal concentrations. The high common power area centered on 78 kyr shows δDwax consistently leading microcharcoal concentrations by about 10 kyr.
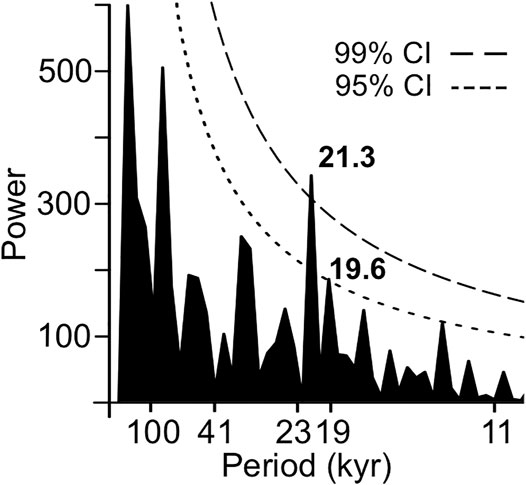
FIGURE 4. Spectral analysis of microcharcoal concentrations. Periodicities >5 × the 3,100-yr time step with power above the 95 and 99% confidence levels are labeled on the periodogram.
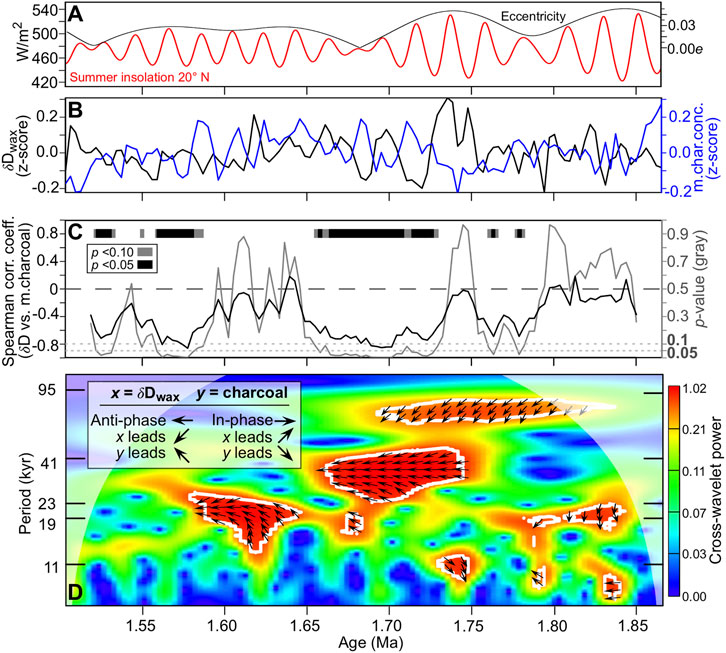
FIGURE 5. Correlations between WTK13 core leaf wax δD (precipitation) and microcharcoal (fire) records between 1.866 and 1.503 Ma. This analysis was not extended to the top of the core at 1.379 Ma because of a ∼30 kyr gap in the δD record. (A) Summer insolation for 20° N plotted with orbital eccentricity (Laskar et al., 2004). (B) Microcharcoal concentrations (this study) and δDwax (Lupien et al., 2018) z-scores after interpolating each record at 3100-yr time steps. Higher δDwax values signify lower precipitation while higher microcharcoal values signify higher fire frequency and/or intensity. (C) Rolling Spearman correlations between the δDwax and microcharcoal records. Correlation coefficients (black line) and their respective p values (gray line) were calculated using a 34,100-yr moving window. The gray and black bars represent intervals with strong negative correlations at the p ≤ 0.10 and p ≤ 0.05 levels, respectively. (D) Evolutive (periodicity through time) cross-wavelet correlations and phasing between the δDwax and microcharcoal records. Warmer colors signify higher spectral density, and white contours with internal phase paths signify p = 0.05 confidence levels. Cone of influence (boundary effects) marked with white transparent shading.
The rolling Spearman correlation analysis identified several intervals with strong negative correlations between δDwax values and microcharcoal concentrations at p ≤ 0.10 and p ≤ 0.05 significance levels (Figure 5C). The longest such interval spans from 1.74 to 1.65 Ma, followed by strong but intermittent correlations between 1.59 and 1.52 Ma.
Change Point Analysis and Zonation
Change point analysis of the log-transformed microcharcoal concentration record identified seven change points at the 0.05 significance level that were subsequently used as zone boundaries for eight zones (Supplementary Figure S4). A horizontal reference line set at a microcharcoal concentration of 5,000 cm−3 was used in Figure 3D to visually highlight the zonal changes in concentrations. These zones correspond well with major changes in phytolith preservation and some distinct lithological transitions. Results by zone are discussed next.
Zone 1 (1.868–1.855 Ma; 215.56–206.77 mbs)
Zone 1 was characterized by high charcoal concentrations (3 × mean) and very poor biogenic silica (BSi) preservation. Phytoliths and sponge spicules were rare and often appeared severely pitted and/or dissolved when present. Diatom concentrations were relatively high (∼1.85 × 107 cm−3) and appeared to be mostly Aulacoseira spp.; however, they were severely altered. Silica replacement or reprecipitation rather than simple dissolution, (e.g., Yost et al., 2021) appeared to be the main mode of alteration.
Zone 2 (1.855–1.774 Ma; 206.77–150.62 mbs)
Zone 2 was characterized by very low microcharcoal concentrations (∼14% of the mean), and extremely low phytolith concentrations (∼0.03% of the mean; 142 phytoliths per cm3). There was partial to total BSi dissolution in many of the samples (Supplementary Figure S4), likely the result of high pore water or lake water pH. Phytolith samples were too poorly preserved to reliably report morphotype relative abundances. The occurrence of sandy sediments in the lower third of the zone was also notable (Figure 3G).
Zone 3 (1.774–1.728 Ma; 150.62–135.44 mbs)
Of all the zones from WTK13, Zone 3 was characterized by having the lowest microcharcoal concentrations (4% of the mean) and the lowest phytolith concentrations (∼0.004% of the mean; 21 phytoliths per cm3). Like the previous zone, there was partial to total BSi dissolution in many of the samples, and the phytolith record was too poorly preserved to reliably report morphotype relative abundances. In addition, the highest δDwax values (higher values indicate lower precipitation) from the entire WTK13 core were obtained from this zone, which also had the highest average δDwax values of any zone (Supplementary Table S4). The lowest microcharcoal and phytolith concentrations and the highest δDwax values are centered around 1.74 Ma.
Zone 4 (1.728–1.582 Ma; 135.44–86.87 mbs)
Zone 4 was characterized by high microcharcoal variability, with peaks and troughs alternating between 4 × above and 112 × below the mean (Figure 3). The rolling Spearman correlation analysis detected negative correlations at p ≤ 0.05 between δDwax values and microcharcoal concentrations in the lower half of the zone (Figure 5C). The cross-wavelet spectral analysis detected this same anticorrelation throughout the zone at periodicities ranging between obliquity (41 kyr) and precession (23–19 kyr) but centered on 33 kyr (Figure 5D) Phytolith concentrations were higher than those in the lower zones, but morphotype preservation bias was evident in most samples (Supplementary Figure S4). However, two short intervals centered at 1.651 Ma (109.93 mbs) and 1.607 Ma (97.98 mbs) exhibited good to excellent phytolith preservation. These two phytolith preservation intervals may coincide with the two precession peaks identified in Figure 6A. Iph aridity index values for these two intervals were >27.8%, and D/P° tree cover index values were <1.0 (Figures 6B,C), suggesting xeric short-grass (Chloridoideae) grassland or open savanna characterized the Turkana Basin at this time. Concomitant microcharcoal peaks with the phytolith intervals suggest grass densities were sufficient to support frequent fires.
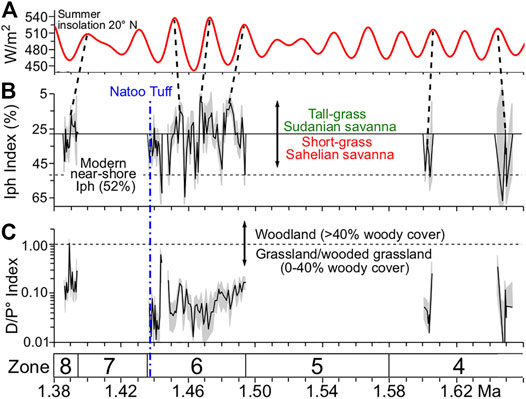
FIGURE 6. Phytolith Iph (aridity) and D/P° (tree cover) indices. Gray shading represents bootstrapped 95% confidence intervals. The vertical blue dashed line marks the position of the Natoo Tuff in the WTK13 core, linking the Nariokotome Boy site (NK3) to the core. (A) Summer insolation for 20° N (Laskar et al., 2004). (B) Iph index with inverted y-axis. Solid horizontal reference line set at 27.8%, which separates mesic tall-grass Sudanian savanna from xeric short-grass Sahelian savanna (Novello et al., 2017). Dashed horizontal line denotes the average modern Lake Turkana Iph value. Dashed vertical lines link possible tie points between peaks in insolation and peaks in phytoliths indicative of mesic C4 tall-grasses (C) D/P° tree cover index.
Zone 5 (1.582–1.50 Ma; 86.87–59.42 mbs)
Zone 5 was characterized by consistently low microcharcoal concentrations that averaged ∼8% of the mean, and poor phytolith preservation. Spearman correlation analysis detected negative correlations at p ≤ 0.05 between δDwax values and microcharcoal concentrations throughout much of the zone (Figure 5C). Phytolith morphotype preservation bias was evident throughout, and low GSSC recovery precluded aridity and tree cover index calculations. Authigenic silicates, many of which resembled phillipsite, were observed in 5% of the samples. However, at 1.556 Ma (between 78.25 and 77.27 mbs), sponge spicule concentrations were an order of magnitude above any other occurrence within the zone (Figure 7; Supplementary Material S2). All of the spicules retained their original shape, but their silica appears to have been reprecipitated or devitrified, as has been observed in some spicules from Plio-Pleistocene Lake Baringo (see Figure 5 from Yost et al., 2021).
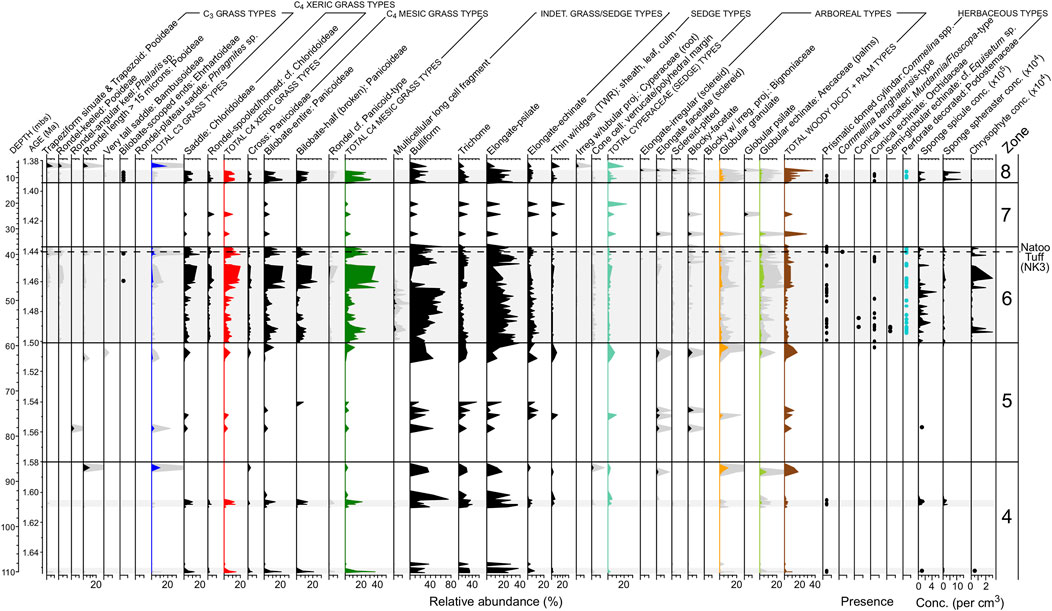
FIGURE 7. Phytolith relative abundance for selected morphotypes between 1.66 and 1.38 Ma. Some morphotypes include a gray shaded 5x exaggeration. Black dots denote presence, but at values too low to show up on diagram. Horizontal gray shaded bars denote intervals with good phytolith preservation. Unshaded (white) intervals are periods with poor phytolith preservation and partial or complete loss of the phytolith record. The vertical dashed line marks the position of the Natoo Tuff in WTK13, which is a core-to-outcrop tie point for the Nariokotome Boy (Homo erectus/ergaster) site (NK3).
Zone 6 (1.50–1.436 Ma; 59.42–36.83 mbs)
Zone 6 had the longest interval with good to excellent BSi preservation, and it had the highest average phytolith and microcharcoal concentrations for the core. Of all zones, Zone 6 had the second lowest average δDwax value (−133.3‰; Supplementary Table S4). Iph aridity index values often exceeded the 27.8% threshold separating mesic tall-grass Sudanian savanna from xeric short-grass Sahelian savanna (Novello et al., 2017). Although there was considerable uncertainty in the tephra ages from this zone used in the age model (Lupien et al., 2018), the mesic C4 tall-grass peaks may coincide with precession-scale insolation peaks (Figures 6A,B). D/P° aridity index values were typically well below the 1.0 threshold that identify woodlands with >40% canopy cover (Yost et al., 2021; Figure 6C). This zone marked the first appearance of phytoliths diagnostic of the aquatic riverweed family (Podostemaceae; da Costa et al., 2018; Figure 8E). Numerous phytoliths from at least two species of dayflower (Commelina spp.; Eichhorn et al., 2010) were also observed. Sponge spicules reached their highest concentrations here, and intervals with high sponge abundances appear to correspond with intervals of low insolation (Figure 8I). Phytoliths derived from plants that are found today above 1,500–2,000 m elevation (Table 3), including phytoliths from the C3 Pooideae grass subfamily, abruptly increased in abundance in the upper half of the zone (Figure 8F). There was one interval between 43.69 and 42.06 mbs (∼1.446 Ma) where all phytoliths were poorly preserved and the phytolith extracts were dominated by authigenic silicates, most likely phillipsite.
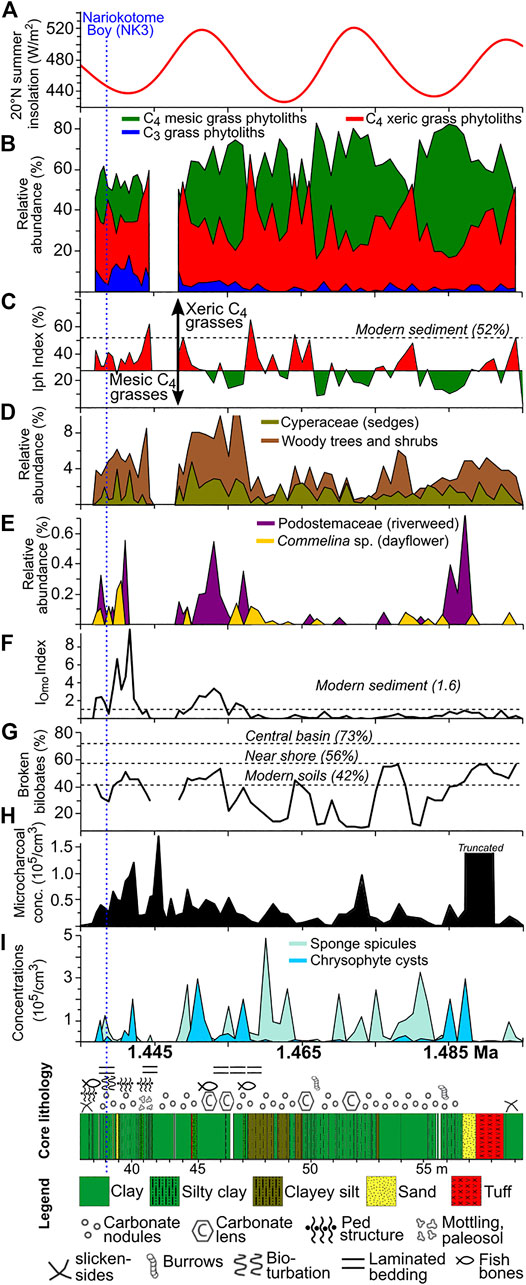
FIGURE 8. Microfossil summary plots for Zone 6 (1.50–1.435 Ma). (A) 20° N summer insolation (Laskar et al., 2004). (B) Relative abundance of C3 and C4 grass functional types based on short-cell phytoliths. (C) Iph aridity index with xeric short-grass/mesic tall-grass transition set at 27.8% (Novello et al., 2017). (D) Relative abundance of tree/shrub and Cyperaceae (sedge) phytoliths based on the total phytolith sum. (E) Podostemaceae (riverweed) and Commelina spp. (dayflower) relative abundance based on total phytolith sum. (F) Upper Omo River source area index (IOmo), with higher values signaling more phytolith transport from plants likely growing above 1,500 m elevation. (G) Percentages of broken bilobate phytoliths, with higher values suggesting greater phytolith inputs from long-distance transport. (H) Microcharcoal concentrations. (I) Sponge spicule and chrysophyte cyst concentrations. Chrysophytes were most likely derived from waters sourced to the Ethiopian Highlands.
Zone 7 (1.436–1.393 Ma; 36.83–11.40 mbs)
Zone 7 was characterized by relatively low microcharcoal concentrations and poor BSi preservation. Phytolith concentrations were three orders of magnitude below the mean, and low GSSC recovery precluded aridity and tree cover index calculations. The longest core interval with no sediment recovery occurred between ∼19.1 and 13.5 mbs (∼1.40 Ma), in the upper portion of this zone.
Zone 8 (1.393–1.379 Ma; 11.40–3.33 mbs)
Zone 8 was characterized by excellent phytolith preservation and high phytolith concentrations, except between 7.47 and 3.33 mbs, where phytolith preservation was poor. In this uppermost interval, authigenic silicates dominated the phytolith extracts and dissolution was likely responsible for low phytolith recovery. For the interval with well-preserved phytoliths between 1.393 and 1.386 Ma (11.40 and 7.47 mbs), phytoliths from woody trees and shrubs were at their highest levels of relative abundance for the core (Figures 3C, 7). The sample from 9.07 mbs (1.39 Ma) yielded a D/P° index value of 1.06 (Figure 6C), indicating canopy cover ≥40%. However, samples immediately above and below had very low D/P° values suggesting a relatively short-lived (<1 kyr) riparian woodland episode. The Iph index tracks a change from mesic tall-grass dominance to xeric short-grass dominance, and this switch also takes place at 9.07 mbs. Lastly, Zone 8 had the lowest average δDwax value (−134.8‰; Supplementary Table S4).
Discussion
Modern Turkana Basin Phytoscape
Determining potential phytolith production at the landscape level (phytoscape) is an important step in understanding how terrestrial vegetation signals are integrated into lake sediments. Ideally this would be accomplished by sampling plants and modern soils within a lake basin watershed. Because that option was not available, we used a proxy approach based on species lists from local floristic surveys in concert with phytolith composition data for those species to determine a potential grass silica short-cell (GSSC) phytoscape signal for portions of the watershed closest to the modern lake. Results of this literature-based grass phytoscape analysis found there was no appreciable difference between the Lower Omo River Valley (LOR), East Turkana (ETK) and West Turkana (WTK) areas when considering the most common grasses, as the relative abundances of grasses dominated by either lobate, rondel, or saddle phytoliths were nearly identical (Table 2). Accordingly, changes in the Iph aridity index should reflect change in the hydroclimate and grass community composition rather than changes in local sediment source areas.
Results of the arboreal phytoscape analysis indicates that source area could have an influence on the D/P° tree cover index, as nine woody taxa from the LOR but only six from ETK are known to produce globular granulate phytoliths. However, phytolith production based on biomass would be a better determinant than the number of species. Perhaps more important is the fact that woodlands and forests in ETK make up < 1% of total land cover, as opposed to ∼20% for the LOR. Details on woody cover were not provided in the floristic surveys of WTK, but based on similarities in the climate regime are assumed to be similar to ETK.
The literature-based phytoscape study demonstrates that despite xeric C4 Chloridoideae taxa representing 51% of all grass taxa listed for LOR, ETK, and WTK, saddle phytoliths were the dominant morphotype in only 23% of all grass species listed. This, in part, reflects the fact that xeric C4Aristida spp. (Aristidoideae), which produce bilobates, were very common in all of the surveyed areas. Also, some of the most common Chloridoideae grasses in the Turkana basin, such as Sporobolus and Enneapogon, typically produce lobate and rondel instead of saddle phytoliths (Supplementary Table S1; Supplementary Figure S5). The implication is that if the Iph index is calibrated in habitats with low or no occurrences of bilobate-producing xeric C4 grasses (e.g., Aristida and Sporobolus spp.), the Iph aridity index could underestimate aridity and xeric C4 grass abundance in habitats that do contain those grasses since bilobates are often associated with mesic C4 grasses. However, because Aristida and Sporobolus are common in the Lake Chad Basin, the Iph index developed by Novello et al. (2017) is considered accurate for the Turkana Basin.
Phytolith and Microcharcoal Deposition in the Modern Lake System
Natural fires in the Turkana Basin are rare today because plant cover and density are generally too low to carry fire. The exception is in grassy riparian corridors or higher elevation areas with a continuous grass layer where pastoralists have been known to intentionally set fires (Coughenour and Ellis, 1993). Intentional fire use by pastoralists has also been observed within the LOR during the dry seasons (Carr, 2017). The abundance of wind-dispersed charcoal particulates typically decays nonlinearly from the point source (Clark, 1988; Lynch et al., 2004; Peters and Higuera, 2007). Considering the prevailing winds out of the southeast and the active use of the Koobi Fora Base Camp by researchers and support staff at the time of sample collection, the exponential decrease in microcharcoal concentrations suggests that the point source may have been close to the eastern edge of the lake and possibly related to human activities. Challenges in interpreting charcoal from paleolake sediments are discussed in Paleo-Lake Lorenyang Phytoliths and Microcharcoal.
The linear decrease in phytolith concentrations and large-sized phytoliths in the lake sediments with increasing distance from shoreline (Figures 2B,C) is likely a function of eolian transport from the east side of the lake (ETK) by the prevailing southeasterly winds (Figure 1D). In contrast, Iph aridity index values decreased as distance from shoreline increased. Because a broken bilobate was given a value of 0.5, lower Iph values (i.e., more bilobates) were not the result of single bilobates being counted twice after breakage. Thus, lower Iph values likely reflect increased exposure to the Omo River sediment plume and its modification by currents associated with the north basin gyre.
Sample 27, which was furthest from shore and closest to the gyre center (Figure 1D), yielded an outlier phytolith concentration value (>3 σ) and a slightly elevated microcharcoal concentration value, which both deviate from the trend of decreasing concentrations from shore (Figures 2A,B). During microscopy it was noted that the phytolith and inorganic sediment particles were very uniform in size (∼10–15 μm), and this apparent particle sorting may be related to the sample’s position within the gyre.
Bilobates can and do break during lab phytolith extraction procedures, especially during vortex mixing. However, these processing-induced breakages should be similar from sample to sample. The positive relationship between broken bilobate percentages and distance from shore we observed is considered here to be a consequence, and hence indicator, of long-distance bilobate transport from the upper reaches of the Omo River (Ethiopian Highlands). In support of this hypothesis, modern soil samples (n = 3) from an arid part of the Serengeti Plain (2°56′7.94″ S, 35°14′50.21″ E; MAP = 550 mm) had an average broken bilobate percentage of 42 ± 5% (C. Yost, unpublished data). This is lower than the broken bilobate percentages for the modern Lake Turkana near-shore samples (0.2–0.5 km; 57 ± 10%) and off-shore samples (3–16 km; 73 ± 4%) at the 95% confidence level. Further support for this hypothesis is the fact that phytoliths derived from C3 Pooideae grasses, which are not found today in the lower Omo River Valley, also increased in abundance as distance from shoreline increased (Figure 2H, IOmo index; Supplementary Figure S3). A potential limitation of this index would be in depositional settings where partial phytolith dissolution may be responsible for bilobate breakage.
In summary, our findings show that the proportion of the modern Lake Turkana sediment phytolith record derived from within the area immediately adjacent to Lake Turkana, or from the lower or upper Omo River Valley depends on the sample’s depositional position within the lake basin, which can vary as a result of changes in lake levels, especially in regard to transgression and regression of the Omo River delta. It is possible that at least ∼20% of the modern GSSC phytolith assemblage has been derived from the upper Omo River Valley, and that this proportion may have been significantly higher during past humid periods.
Paleo-Lake Lorenyang Phytoliths and Microcharcoal
Phytoliths in lake cores provide two types of direct information: a broad measure of lake/pore water pH via preservation state (Yost et al., 2021) and a record of vegetation. Indirectly, phytolith concentrations can provide information about relative changes in lake levels if lake surface area change is significant and preservation states and sedimentation rates do not change substantially. The most striking aspect of the WTK13 phytolith record was the poor preservation before, and good to excellent preservation after 1.5 Ma (59.10 mbs). This transition corresponds with a first order facies transition from more lacustrine dominated sedimentation in the bottom of the core to fluvial-deltaic sedimentation at the top of the core (Feibel et al., 2017).
Interpreting phytolith records can be complicated in lacustrine contexts, especially when riverine sediment loads to the system are significant (Li et al., 2019). The results of the modern phytoscape and modern lake sediment analysis enable us to determine that ∼80% of the phytoliths in modern lake sediments located ∼60 km from the Omo River delta were likely derived from areas proximal to the lake. If proximity from the core site to the paleo-Omo River delta decreased, or river discharge increased, the proportion of phytoliths derived from mesic vegetation sourced more distally from the Upper Omo River Valley in the Ethiopian Highlands would likely increase.
Increased microcharcoal concentrations can arise from various sources, including increased fire frequency, increased fire intensity, increased area burned, and/or decreased distance to source area (Whitlock and Anderson, 2003). For instance, a significant increase in lake surface area could reduce microcharcoal concentrations independent of an actual change in fire activity. However, this reduction could be tempered by decreased clastic inputs (lower sedimentation rates). In a core with excellent chronological control, changes in sedimentation rates can be accounted for by calculating microcharcoal influx. With the more limited chronological control in WTK13, microcharcoal influx calculations would not have appreciably changed the microcharcoal curve.
In a meta-analysis of published charcoal source area estimates, Vachula (2021) modeled the relationship between charcoal size and source area, which was found to be within 50 km for all size fractions of sedimentary charcoal. We consider this model output to be an appropriate estimate of the source area for our paleolake sediment microcharcoal record. Additionally, because of the time-averaging inherent in our samples (∼24 yr/sample), microcharcoal variability is most likely a function of fire frequency, but fire intensity, distance to fire source, and area burned may also be contributing factors. In fact, with our proposed causal relationship between increased precipitation and increased mesic (yet fire-adapted) C4 grass biomass in the WTK13 record (see Zone 4 (1.728–1.582 Ma; 135.44–86.87 mbs) and Correlations Between Precipitation, Fire, Vegetation, and Orbital Forcing), both increased fire frequency (seasonal fires) and increased area burned (expanded fuel source) would likely contribute to higher microcharcoal concentrations. With these phytolith and microcharcoal taphonomic issues in mind, the paleorecord zones are discussed in more detail below.
Zone 1 (1.868–1.855 Ma; 215.56–206.77 mbs)
The bottom of the core, Zone 1, was characterized by very high charcoal concentrations, (similar to other more humid intervals in the upper part of the core), relatively high concentrations of severely altered diatoms (cf. Aulacoseira), and some severely dissolved large bulliform phytoliths (Figure 3). Overall, BSi preservation was very poor, indicating lake water pH was likely >8.5. Zone 1 corresponds to what Boës et al. (2019) interpret as the end of a lake level transgression during the freshwater (exorheic) phase of paleo-Lake Lorenyang. Conversely, Schuster and Nutz (2019) and Nutz et al. (2020) interpret lake level regression at this time. Lastly, the consistently high microcharcoal concentrations in Zone 1 suggest fire may have played a role in the basin-wide increase in C4 vegetation that has been observed after ∼2.3 Ma in the Turkana Basin (Levin et al., 2011; Uno et al., 2016), but more importantly after ∼2 Ma in the Omo Valley (Levin, 2015), as the Omo River may be a source for some of this microcharcoal. Extending the microcharcoal and phytolith records across this C3/C4 vegetation transition would test this hypothesis and provide additional context for the C4 vegetation increase.
Zone 2 (1.855–1.774 Ma; 206.77–150.62 mbs)
Zone 2 is characterized by the largest number of samples with no phytolith recovery, suggesting high pH lake/pore water was responsible for the partial to complete loss of biogenic silica observed. Numerous ped structures and a sandy sequence of sediments between 199 and 195 mbs suggest periodically low lake levels and exposed surfaces (Supplementary Figure S2). Zone 2 corresponds to Unit 2 from Nutz et al. (2017), in which they identified five parasequences paced at precessional (∼22 kyr) periodicities. They interpret Unit 2 as being relatively dry with low climate variability. This is in general agreement with both the δDwax and δ13Cwax records of precipitation and vegetation (Lupien et al., 2018), and with the relatively muted variability of our microcharcoal record for the upper half of the zone (Figure 3). Our cross-wavelet analysis detected significant anticorrelation between δDwax values and microcharcoal concentrations at precessional periodicity throughout this zone (Figure 5D). This spectral analysis indicates that variability in precipitation and fire, and by extension, vegetation, were being driven by precession. Nutz et al. (2020) identify a lowstand in the paleolake sometime between 1.85 and 1.75 Ma that would have taken place in either this zone or in Zone 3.
Zone 3 (1.774–1.728 Ma; 150.62–135.44 mbs)
Zone 3 is unique for its extremely low microcharcoal and phytolith concentrations (Figure 3F, Supplementary Figure S4). The low microcharcoal interval suggests that vegetation within the Turkana Basin was often too sparse to carry fire, ostensibly reflecting hyper-arid conditions. This is supported by the leaf wax hydrogen isotopic record (Lupien et al., 2018), which recorded the most D-enriched δDwax values of the WTK13 core (Supplementary Table S4), and also recorded two prominent peaks in 13C-enriched δ13Cwax values, reflecting extreme aridity (Figures 3E,F). In fact, the δDwax values in Zone 3 are much higher than modern values at ∼400 yr BP from Lake Turkana (Morrissey, 2014; Morrissey and Scholz, 2014).
Although two very high eccentricity modulated insolation peaks fall within this zone (Figure 3A), the three troughs (low points) in insolation appear to have had a significant effect on precipitation and fire, and may have also effected lake levels and the resultant sedimentary record. The sample with the lowest microcharcoal concentration at 139.78 mbs (1.7413 Ma) was collected ∼1 cm below the erosional surface of a 13-cm coarsening upwards sandy sequence with shells and fish bones that separates a green clay interval with carbonate nodules and silt-filled veins (interpreted as a paleosol) from a green clay interval above that is interpreted as lacustrine (Supplementary Figure S6). This erosional event corresponds with the insolation minimum between insolation peaks 2 and 3 labeled in Figure 3A. Similar events in this zone, at the bottom of Zone 4, and at other locations in WTK13 may contribute to uncertainty in the age model. Poor chronological control in this part of the core led Lupien et al. (2018) to conservatively tune the δDwax record in the high eccentricity interval centered at 1.74 Ma to summer mean insolation at 20° N. Some of their tie points are depicted in Figure 3A. As a consequence, it is possible that the top of Zone 3 may actually be closer to 1.718 Ma rather than 1.728 Ma.
The large insolation increase that culminated at peak 2 (∼1.72 Ma) straddles the boundary between Zones 3 and 4 and was the subject of a study by Lupien et al. (2020). They observed an approximately 30‰ D-depletion in δDwax within ∼200 years, suggesting that an abrupt, nonlinear climate response was triggered after crossing an insolation threshold. Similarly paced abrupt change likely took place in Zone 6, where phytoliths recorded changes between xeric short-grass savanna and mesic tall-grass savanna occurring in less than 600 years. These changes were likely more abrupt but our ability to fully resolve the timing was limited by the temporal resolution of the 32-cm sampling scheme and age model for Zone 6. Abrupt change between mesic and xeric savanna in less than 600 years was frequently observed from the Plio-Pleistocene Baringo Basin, where the existence of a precipitation response to an insolation threshold was proposed (Yost et al., 2021). Although low biomarker concentrations did not allow for δDwax measurements for the transition from Zone 5 to Zone 6, the microcharcoal and δ13C records suggest this was a period of similarly abrupt and extreme change in climate and vegetation. In summary, the transitions to Zones 4 and 6 were both characterized by high eccentricity intervals of high amplitude variability not observed elsewhere in the WTK13 record.
Zone 4 (1.728–1.582 Ma; 135.44–86.87 mbs)
There was high variability in microcharcoal concentrations that included precessional periodicities throughout Zone 4 (Figure 5D). Increased fire on the landscape during this period likely helped maintain a grass-dominated savanna mosaic, as has been indicated by pedogenic carbonates and faunal records from the Turkana Basin (e.g., Quinn et al., 2007; Patterson et al., 2017). Peaks in microcharcoal were generally coincident with insolation peaks, and were also typically associated with low (depleted) δDwax values indicative of increased precipitation and high (enriched) δ13Cwax values indicative of increased proportions of C4 (e.g., grass) vegetation (Figures 3D–F).
This inverse relationship between δDwax values and microcharcoal concentrations may be explained by the strong positive relationship between fire and precipitation owing to increased C4 grass biomass (fuel) when precipitation increases in savanna ecosystems (Lehmann et al., 2014; Probert et al., 2019). Fires occurring when C4 grasses are quiescent during subsequent dry seasons would be expected to significantly reduce tree and shrub cover (Oliveras and Malhi, 2016), thus increasing the proportion of C4 to C3 biomass with increases in precipitation. As aridity increased in these communities, plant cover, biomass, and density would decline and bare ground would have increased such that fire frequency and intensity would be reduced, and xerophytic C3 trees and shrubs would increase relative to C4 grasses. This is a simplistic model, as grazers can also suppress fire activity by creating grazing lawns (Hempson et al., 2015), and browsers can reduce woody vegetation abundance independent of fire (Rugemalila et al., 2016). However, the basic relationships between fire, precipitation, and plant functional type dominance remain coherent at broad scales in African savannas (Oliveras and Malhi, 2016).
Although there were only two short intervals with good phytolith preservation within Zone 4, the Iph aridity and D/P° tree cover indices indicate that tree cover was likely <40%, and xeric C4 Chloridoideae taxa were the dominant grasses. This change in vegetation would be consistent with the rise in arid-adapted antilopin, alcelaphin, and hippotragin bovids in KBS Member paleontological assemblages from East Turkana (Patterson et al., 2017). However, the grass community overall was comprised of more mesic adapted grasses than today. This is supported by the δDwax record that shows hydroclimate within the watershed during the Zone 4 period was likely wetter than near-modern (∼400 yr BP; Figure 3E).
Zone 5 (1.582–1.50 Ma; 86.87–59.42 mbs)
Very poor phytolith preservation precluded Iph and D/P° index calculations in Zone 5, but the peak in sponge spicule concentrations between 78.25 and 77.27 mbs (1.556 Ma) is a marker for a humid period that may be related to the high amplitude insolation peak at 1.566 Ma (Figure 3A). This is supported by a peak in D-depleted δDwax and a peak in microcharcoal concentrations (Figures 3D,E) that are coeval with the insolation peak. In observing repeated humid-to-arid dissolution sequences for a Plio-Pleistocene record from the Baringo Basin in central Kenya (Yost et al., 2021), found that sponge spicules and spherasters were often the last biogenic silica microfossils to completely dissolve under conditions of increasing pore/lake water pH. Apparently, sponge silica is better polymerized to resist dissolution, possibly as an adaptation to alkaline lakes. Thus, for this short interval, lake water pH was low enough for marginal sponge preservation, but not for phytolith or diatom preservation.
Zones 6–8 (1.50–1.379 Ma; 59.42–3.33 mbs)
The sudden change from poor to good phytolith preservation in less than ∼1 kyr between Zones 5 and 6 is striking. This transition was likely faster, but 960 yr was the temporal limit of the 32-cm sampling resolution in this section of the core. To have a sudden shift towards good phytolith preservation, lake water pH would need to be dramatically lowered, possibly from increased inflow from the Omo River. Zones 6 and eight had the second highest and highest average δDwax values, respectively, indicating generally stronger precipitation than in the lower zones in the core. The appearance of riverweed phytoliths from Tristicha trifaria (Podostemaceae) in Zones 6 and 8, a plant that only grows above 1,500 m on rocks in fast moving water (Agnew, 2013; Koi et al., 2015), suggests that the WTK13 drill site at this time was close to the presumably neutral pH waters of the paleo-Omo River.
Numerous samples in these zones with phytolith concentrations of 106–107 cm−3 are suggestive of subaerial or subaqueous soils in low-energy depositional environments. In fact, during initial core descriptions, smear slides of unprocessed sediment were often comprised of 20–30% phytoliths. Discreet intervals from the Baringo/Tugen Hills (Yost et al., 2021) and Olorgesailie HSPDP drill cores also yielded high phytolith abundances in smear slides and were interpreted as possible wetlands. Modern East African sediment with even higher phytolith abundances have been observed from the Ngoitokitok wetland, Ngorongoro Basin, Tanzania (See Figure 2C from Deocampo and Ashley, 1999).
The percentages of broken bilobate phytoliths were in the ranges typical of soils from near shore settings in the modern Lake Turkana samples (Figure 8G). Higher levels of leaf wax degradation in this part of the core (Lupien et al., 2018) are indictive of oxidative conditions and suggestive of shallow water or overbank depositional settings. Lithologic descriptions indicate the presence of ped structures, burrows, carbonate nodules, and laminated bedding, indicating paleosol alteration of original lacustrine deposits (Figure 8). The grassland community for most of Zone 6 was typically dominated by tall-grass mesic C4 Panicoideae taxa, but it periodically switched to xeric short-grass savanna presumably during insolation minima (discussed in Correlations Between Precipitation, Fire, Vegetation, and Orbital Forcing). Extended periods of mesic tall-grass dominance would be consistent with the rise in mesic grassland-indicative reduncin bovids in Okote Member paleontological assemblages from East Turkana (Patterson et al., 2017). However, a trend of increasing xeric C4 grasses in the upper half of Zone 6 was observed (Figure 6). The environmental setting around the time of the Natoo Tuff, which links the upper part of Zone 6 to the Nariokotome Boy site (NK3), is discussed further in Local Environments of the Nariokotome Boy.
Correlations Between Precipitation, Fire, Vegetation, and Orbital Forcing
A correlation between precipitation (δDwax) and fire (microcharcoal) is visually apparent throughout much of the WTK13 record (Figure 3). The rolling Spearman correlation analysis identifies several intervals with strong, statistically significant, negative correlations between δDwax values and microcharcoal concentrations (Figure 4C). As δDwax values decrease, signifying more precipitation, microcharcoal concentrations increase, signifying more fire. This relationship of increasing precipitation with increasing fire is observed in modern grass-dominated (savanna) ecosystems, as fire-adapted C4 tall-grasses increase when precipitation increases [see discussion and refs in Zone 3 (1.774–1.728 Ma; 150.62–135.44 mbs)].
While the rolling Spearman correlation can determine the strength of transitory in-phase (positive) and anti-phase (negative) correlations at the sampled time steps, evolutive cross-wavelet analysis identifies transitory correlations (intervals of high common power) at multiple time steps (i.e., periodicities) and can detect lead/lag relationships (Figure 5D). In agreement with the Spearman correlation analysis, anti-phasing between the δDwax values and microcharcoal concentrations is the dominant phase relationship within the high common power areas of the cross-wavelet spectrum.
Spectral analysis of the microcharcoal record (Figure 4) and the δ13Cwax record (Supplementary Figure S7) indicated that precession had an effect on fire and vegetation, most likely through changes in precipitation. However, this relationship is not consistent across the entire record (Figure 5D). The strong anti-correlation between the δDwax and microcharcoal records with a range of periodicities centered around 33 kyr is curious given that equatorial climate variability is often driven by eccentricity-modulated precession (19–23 kyr; Figure 5A) on time scales of 104–105 yrs (Lourens, 2021). However, for this same WTK13 interval, Lupien et al. (2018) observed a similar range of periodicities between precession and obliquity for the δDwax record alone, and demonstrated through a conservative tuning exercise that this is most likely a precession band signal that is possibly being obscured by large age uncertainties in this section of the core. By using the tuned age model on the δ13Cwax record, we also removed periodicities at 30 and 26 kyr (Supplementary Figure S7). This may or may not explain the strong non-orbital periodicity of 78 kyr between 1.82 and 1.70 Ma, where increased precipitation (lower δDwax) leads increased fire (higher microcharcoal concentrations) by about 10 kyr. Such a scenario could arise if increased precipitation leads to an expansion of woody vegetation that then burns more frequently during drier periods.
The Spearman correlation and cross-wavelet analyses indicate there is a strong positive relationship between precipitation and fire in the Turkana Basin between at least 1.84 and 1.57 Ma. This is indicative of a grass-dominated ecosystem with increased mesic (yet fire-adapted) C4 tall-grasses during humid periods, presumably during insolation maxima, and increased xeric C4 short-grasses during arid and less fire-prone periods, presumably during insolation minima. The findings from Lupien et al. (2018) and this study suggest that on orbital time scales, variability in Turkana Basin precipitation, fire, and vegetation is being driven primarily by eccentricity-modulated precession.
Local Environments of the Nariokotome Boy
Identification of the Natoo Tuff in WTK13 through single shard glass geochemistry (Feibel et al., 2017) provides a direct core-to-outcrop linkage to the Nariokotome Boy site, where the most complete Homo erectus/ergaster skeleton to date (KNM-WT 15000) was recovered. The Nariokotome Boy site (NK3) is ∼3 km east of the WTK13 drill site, and the skeleton was recovered on the Natoo Tuff (Brown et al., 1985). A detailed paleoenvironmental reconstruction of the site using microstratigraphy was conducted by Feibel and Brown (1993). They describe the depositional setting as a low-energy floodplain marsh, and suggest the skeleton was covered by a short-duration shallow body of water and rapidly buried. Sediment characteristics indicate the floodwaters were supplied primarily from the ancestral Omo River.
Well-preserved phytoliths diagnostic of riverweed (Tristicha trifaria), and cysts from an algal chrysophyte, which were both transported to this location from the upper reaches of the Omo River in the Ethiopian Highlands, were deposited immediately below and above the lowest position of the Natoo Tuff in the WTK13 core (Figures 8E,I), indicating that this was likely a broad system of freshwater channels and wetlands. Phytoliths from at least three species of Commelina (C. africana type, C. diffusa type, and C. benghalensis type; Eichhorn et al., 2010) were observed. This is notable since Commelina leaves are consumed by African primates (Mitani et al., 1993; Huffman et al., 1997; Isbell, 1998), and modern humans (Maundu et al., 1999). Numerous phytoliths from sedge (Cyperaceae) stems, rhizomes (roots), and achenes (seeds), were present, as were high concentrations of grass phytoliths (2–4 × 106 cm−3). Sedge stems, shoots, and starchy rhizomes are consumed by modern humans and have been considered a probable food source for early Pleistocene hominins (Sponheimer et al., 2013; Stewart, 2014). The highest abundances of C3 grass phytoliths from WTK13 were observed in this part of Zone 6, although they were likely derived from the Ethiopian Highlands. Phytoliths from trees and shrubs were present as well, but the D/P° tree cover index values were well below the 1.0 threshold for tree cover >40%. The grass community appears to have switched to being dominated by more xeric C4 Chloridoideae taxa; however, the Iph index indicates the grass community was still more mesic than today (Figure 6B).
In summary, high concentrations of well-preserved phytoliths from sediments associated with the Natoo Tuff indicate that the area ∼3 km west of NK3 was a seasonally wet and densely vegetated environment dominated by short stature grasses, sedges and other herbaceous plants during the time that the Nariokotome Boy walked the ancient landscape. This area would have been rich in terrestrial and aquatic floral and faunal resources for hominin subsistence. Microfossils sourced from the Ethiopian Highlands link this area to hydroclimate fluctuations that would have operated on interannual to orbital time scales. The events at NK3 took place during a period of low summer insolation; however, winter insolation would have been at a maximum, resulting in overall reduced seasonality. This information adds some additional plant taxon detail to the original paleogeographic reconstruction by Feibel and Brown (1993), and perhaps confirms the extension of the floodplain ∼3 km east, but does not change the overall reconstruction first proposed 26 years ago.
Implications for Hominin Paleoecology
We do not observe any long-term trends in environmental change between 1.87 and 1.38 Ma, similar to the leaf wax biomarker records (Lupien et al., 2018); however, these orbitally resolved records do indicate that vegetation communities were oscillating at precessional periodicities in the Turkana Basin. Specifically, our study indicates that mesic tall-grass savanna was dominant primarily during insolation maxima and xeric short-grass savanna was dominant during insolation minima and periods when insolation maxima were muted (modulated) by low eccentricity. Presently, the short-grass/tall-grass savanna boundary occurs at ∼750 mm MAP (van Wyk, 1979; McNaughton, 1983), so switches between these savanna types likely signify when the ∼700 mm precipitation threshold has been crossed.
Although both of these savanna types constitute an open mosaic landscape with scatted trees and shrubs, their grass community structures, faunal populations, and fire regimes are very different. Short-grass savanna grasses are highly nutritious, heavily grazed, and can form rhizomatous lawns (McNaughton, 1985; Quigley and Anderson, 2014; Hempson et al., 2015). Modern short-grass savannas support high diversity and very high abundances of medium-sized mixed-diet taxa such as gazelle and oryx (Hempson et al., 2015). Tall-grass savanna grasses are 1–2 m in height, less nutritious, less digestible, hide predators, and are adapted to frequent fire (Dobson, 2009; Pays et al., 2012; Quigley and Anderson, 2014). Modern tall-grass savannas support high relative abundances of non-ruminant grazers such as equids, hippos, rhinos and suids, and water-dependent grazers such as wildebeest and hartebeest (Hempson et al., 2015).
Xeric short-grass versus mesic tall-grass savannas would have afforded very different resources and predator-prey relationships to hominin populations, which presumably would have required very different foraging strategies. Hominins utilizing a short-grass landscape would likely have experienced large populations of highly visible medium-sized social animals on a landscape with infrequent fires. In contrast, those utilizing a tall-grass landscape would have encountered seasonal fires and large bodied animals, including predators, in generally less visible settings than short-grass savanna. This study and a previous study from the Baringo Basin (Yost et al., 2021) indicate that hominin lineages have been exposed to precession-paced variability in tall-and short-grass savanna for at least the past three million years in eastern Africa.
Conclusion
Our new microcharcoal record from paleo-Lake Lorenyang spans 500 kyr and provides the first millennial-scale record of paleofire in the Turkana Basin for a critical period of hominin and landscape evolution between 1.87 and 1.38 Ma. Microcharcoal concentrations were found to vary at statistically significant precessional (21–19 kyr) periodicities, and through a correlation with δDwax link orbitally forced peaks in precipitation with elevated fire on the landscape. Phytoliths show that mesic C4 versus xeric C4 grass dominance likely varied at precessional periodicities, but other factors such as basin geometry also influenced grass composition. Two intervals of particularly high amplitude and abrupt environmental change were centered at ∼1.72 and 1.50 Ma, respectively, and corresponded with high orbital eccentricity. The interval between 1.72 and 1.58 Ma was notable for having extended periods of both high and low fire activity and for the prevalence of xeric C4 Chloridoideae grasses. With the switch from a lacustrine to fluvial-deltaic deposition at the drill site by 1.5 Ma, tall-grass C4 Panicoideae became dominant, with evidence of continuously high fire activity between 1.50 and 1.44 Ma. The recovery of phytoliths diagnostic of riverweed (Podostemaceae) and C3 grasses (Pooideae), indicate long-distance transport from the Ethiopian Highlands via the Omo River. From the modern vegetation and lake sediment study, it was estimated that ∼20% of the modern phytolith record could be sourced from the Highlands, and this proportion was likely higher during periods of increased precipitation. Thus, potential influences from the entire watershed need to be considered when interpreting microfossils and biomarkers derived from Turkana Basin sediments.
Data Availability Statement
The original contributions presented in the study are included in the article/Supplementary Material, further inquiries can be directed to the corresponding author.
Author Contributions
CY, CB, CF, and AC, assisted with coring. CY analyzed phytoliths and microcharcoal. CB, CF, and RL contributed data. CY, RL, CB, CF, SA, and AC assisted with writing the manuscript.
Funding
Funding for this work was provided by National Science Foundation (NSF) grants EAR-1123942, BCS-1241859, EAR-1338553, and the International Continental Scientific Drilling Program (ICDP). NSF funds were used for logistics, permit, drilling operation, shipping, and analytical expenses. ICDP funds were used for drilling operation expenses.
Conflict of Interest
The authors declare that the research was conducted in the absence of any commercial or financial relationships that could be construed as a potential conflict of interest.
Publisher’s Note
All claims expressed in this article are solely those of the authors and do not necessarily represent those of their affiliated organizations, or those of the publisher, the editors and the reviewers. Any product that may be evaluated in this article, or claim that may be made by its manufacturer, is not guaranteed or endorsed by the publisher.
Acknowledgments
We thank Laurel Karten, Kaitlynn Walker, and Lizbeth Murillo (University of Arizona) for assisting with the phytolith and microcharcoal separations. This research was conducted as part of the Hominin Sites and Paleolakes Drilling Program (HSPDP). Initial WTK13 core processing and sampling was completed at the National Lacustrine Core Facility (LacCore), University of Minnesota, United States. WTK13 is archived at LacCore. We thank Doris Barboni and two reviewers for valuable comments that significantly improved the article. This is publication 41 of the Hominin Sites and Paleolakes Drilling Project.
Supplementary Material
The Supplementary Material for this article can be found online at: https://www.frontiersin.org/articles/10.3389/feart.2021.568646/full#supplementary-material
References
Antón, S. C. (2003). Natural History of Homo Erectus. Am. J. Phys. Anthropol. 122, 126–170. doi:10.1002/ajpa.10399
Walker, A., and Leakey, R. E. (1993). The Nariokotome Homo Erectus Skeleton. Cambridge, Massachusetts: Harvard University Press.
Beck, C. C. (2015). A Multiproxy Approach to Deciphering Terrestrial Climate Records from the Turkana Basin. KenyaNew Brunswick, NJ: Ph.D. dissertationRutgers University.
Bobe, R., and Carvalho, S. (2019). Hominin Diversity and High Environmental Variability in the Okote Member, Koobi Fora Formation, Kenya. J. Hum. Evol. 126, 91–105. doi:10.1016/j.jhevol.2018.10.012
Bobe, R., and Leakey, M. G. (2009). “Ecology of Plio-Pleistocene Mammals in the Omo-Turkana Basin and the Emergence of Homo,” in The First Humans: Origins and Early Evolution of the Genus Homo. Editors F. E. Grine, J. G. Fleagle, and R. E. Leakey (Berlin: Springer), 173–184. doi:10.1007/978-1-4020-9980-9_15
Bobe, R. (2004). The Expansion of Grassland Ecosystems in Africa in Relation to Mammalian Evolution and the Origin of the Genus Homo. Palaeogeogr. Palaeoclimatol. Palaeoecol. 207 (3–4), 399–420. doi:10.1016/j.palaeo.2003.09.033
Boës, X., Prat, S., Arrighi, V., Feibel, C., Haileab, B., Lewis, J., et al. (2019). Lake-level Changes and Hominin Occupations in the Arid Turkana basin during Volcanic Closure of the Omo River Outflows to the Indian Ocean. Quat. Res. 91 (2), 892–909. doi:10.1017/qua.2018.118
Braun, D. R., Harris, J. W. K., Levin, N. E., McCoy, J. T., Herries, A. I. R., Bamford, M. K., et al. (2010). Early Hominin Diet Included Diverse Terrestrial and Aquatic Animals 1.95 Ma in East Turkana, Kenya. Proc. Natl. Acad. Sci. 107 (22), 10002–10007. doi:10.1073/pnas.1002181107
Bremond, L., Alexandre, A., Wooller, M. J., Hély, C., Williamson, D., Schäfer, P. A., et al. (2008). Phytolith Indices as Proxies of Grass Subfamilies on East African Tropical Mountains. Glob. Planet. Change 61 (3–4), 209–224. doi:10.1016/j.gloplacha.2007.08.016
Brown, F., Harris, J., Leakey, R., and Walker, A. (1985). Early Homo Erectus Skeleton from West Lake Turkana, Kenya. Nature 316, 788–792. doi:10.1038/316788a0
Brown, F. H., and McDougall, I. (2011). Geochronology of the Turkana Depression of Northern Kenya and Southern Ethiopia. Evol. Anthropol. 20 (6), 217–227. doi:10.1002/evan.20318
Bruhn, R. L., Brown, F. H., Gathogo, P. N., and Haileab, B. (2011). Pliocene Volcano-Tectonics and Paleogeography of the Turkana Basin, Kenya and Ethiopia. J. Afr. Earth Sci. 59 (2–3), 295–312. doi:10.1016/j.jafrearsci.2010.12.002
Campisano, C. J., Cohen, A. S., Arrowsmith, J. R., Asrat, A., Behrensmeyer, A. K., Brown, E. T., et al. (2017). The Hominin Sites and Paleolakes Drilling Project: High-Resolution Paleoclimate Records from the East African Rift System and Their Implications for Understanding the Environmental Context of Hominin Evolution. PaleoAnthropology, 1–43. doi:10.1130/abs/2017am-295426
Carr, C. J. (1998). Patterns of Vegetation along the Omo River in Southwest Ethiopia. Plant Ecol. 135, 135–163. doi:10.1023/a:1009704427916
Carr, C. J. (2017). River Basin Development and Human Rights in Eastern Africa — A Policy Crossroads. Switzerland: Springer Nature. doi:10.1007/978-3-319-28480-4
Chandan, D., and Peltier, W. R. (2020). African Humid Period Precipitation Sustained by Robust Vegetation, Soil, and lake Feedbacks. Geophys. Res. Lett. 47 (21). e2020GL088728. doi:10.1029/2020gl088728
Clark, J. S. (1988). Particle Motion and the Theory of Charcoal Analysis: Source Area, Transport, Deposition, and Sampling. Quat. Res. 30 (1), 67–80. doi:10.1016/0033-5894(88)90088-9
Cohen, A. S., Ferguson, D. S., Gram, P. M., Hubler, S. L., and Sims, K. W. (1986). “The Distribution of Coarse-Grained Sediments in Modern Lake Turkana, Kenya: Implications for Clastic Sedimentation Models of Rift Lakes,” in Sedimentation in the African Rifts. Editor L. E. Frostick (Palo Alto, CA: Blackwell Scientific Publications), 127–139. doi:10.1144/gsl.sp.1986.025.01.11
Cohen, A., Campisano, C., Arrowsmith, R., Asrat, A., Behrensmeyer, A. K., Deino, A., et al. (2016). The Hominin Sites and Paleolakes Drilling Project: Inferring the Environmental Context of Human Evolution from Eastern African Rift lake Deposits. Sci. Dril. 21, 1–16. doi:10.5194/sd-21-1-2016
Coughenour, M. B., and Ellis, J. E. (1993). Landscape and Climatic Control of Woody Vegetation in a Dry Tropical Ecosystem: Turkana District, Kenya. J. Biogeogr. 20 (4), 383–398. doi:10.2307/2845587
da Costa, F. G. C. M., Klein, D. E., Philbrick, C. T., and Bove, C. P. (2018). Silica Bodies in Leaves of Neotropical Podostemaceae: Taxonomic and Phylogenetic Perspectives. Ann. Bot. 122 (7), 1187–1201. doi:10.1093/aob/mcy121
Deocampo, D. M., and Ashley, G. M. (1999). Siliceous Islands in a Carbonate Sea; Modern and Pleistocene spring-fed Wetlands in Ngorongoro Crater and Oldupai Gorge, Tanzania. J. Sediment. Res. 69 (5), 974–979. doi:10.2110/jsr.69.974
Dobson, A. (2009). Food-Web Structure and Ecosystem Services: Insights From the Serengeti. Philos. Trans. R. Soc. Lond. B Biol. Sci. 364 (1524), 1665–1682. doi:10.1098/rstb.2008.0287
Eichhorn, B., Neumann, K., and Garnier, A. (2010). Seed Phytoliths in West African Commelinaceae and Their Potential for Palaeoecological Studies. Palaeogeogr. Palaeoclimatol. Palaeoecol. 298 (3–4), 300–310. doi:10.1016/j.palaeo.2010.10.004
Feibel, C. S. (2011). A Geological History of the Turkana Basin. Evol. Anthropol. 20 (6), 206–216. doi:10.1002/evan.20331
Feibel, C. S., Beck, C. C., Lupien, R. L., Russell, J. M., Deino, A., Sier, M. J., et al. (2017). Environmental Dynamics on an Early Pleistocene lake Margin: the WTK13 Core at Kaitio, West Turkana, Kenya. Geological Society of America Abstracts with Programs. 49 (6). doi:10.1130/abs/2017am-303947
Feibel, C. S., and Brown, F. H. (1993). “Microstratigraphy and Paleoenvironments,” in The Nariokotome Homo Erectus Skeleton. Editors A. Walker, and R. E. Leakey (Cambridge, Massachusetts: Harvard University Press), 21–39. doi:10.1007/978-3-662-10382-1_3
Fraysse, F., Pokrovsky, O. S., Schott, J., and Meunier, J.-D. (2009). Surface Chemistry and Reactivity of Plant Phytoliths in Aqueous Solutions. Chem. Geology. 258 (3–4), 197–206. doi:10.1016/j.chemgeo.2008.10.003
GBIF (2019). Global Biodiversity Information Facility (online database). Available: https://www.gbif.org. (Accessed July 29, 2019).
Harris, J. M., Brown, F. H., and Leakey, M. G. (1988). Stratigraphy and Paleontology of Pliocene and Pleistocene Localities West of Lake Turkana, Kenya. Natural History Museum of Los Angeles County. 399, 1–128.
Hempson, G. P., Archibald, S., and Bond, W. J. (2015). A Continent-wide Assessment of the Form and Intensity of Large Mammal Herbivory in Africa. Science 350 (6264), 1056–1061. doi:10.1126/science.aac7978
Hlubik, S., Cutts, R., Braun, D. R., Berna, F., Feibel, C. S., and Harris, J. W. K. (2019). Hominin Fire Use in the Okote Member at Koobi Fora, Kenya: New Evidence for the Old Debate. J. Hum. Evol. 133, 214–229. doi:10.1016/j.jhevol.2019.01.010
Hopson, A. J. (1975). Progress Report. January 1975, Lake Rudolf Fisheries Research Project. (unublished).
Huffman, M. A., Gotoh, S., Turner, L. A., Hamai, M., and Yoshida, K. (1997). Seasonal Trends in Intestinal Nematode Infection and Medicinal Plant Use Among Chimpanzees in the Mahale Mountains, Tanzania. Primates 38 (2), 111–125. doi:10.1007/BF02382002
Isbell, L. A. (1998). Diet for a Small Primate: Insectivory and Gummivory in the (Large) Patas Monkey (Erythrocebus Patas Pyrrhonotus). Am. J. Primatol. 45 (4), 381–398. doi:10.1002/(SICI)1098-2345(1998)45:4<381::AID-AJP5>3.0.CO;2-S
James, N. A., and Matteson, D. S. (2014). Ecp: An R Package for Nonparametric Multiple Change point Analysis of Multivariate Data. J. Stat. Softw. 62 (7), 1–25. doi:10.18637/jss.v062.i07
Johnson, T. C., and Malala, J. O. (2009). “Lake Turkana and its Link to the Nile,” in The Nile: Origin, Environments, Limnology and Human Use. Editor H. J. Dumont (Dordrecht: Springer), 287–304. doi:10.1007/978-1-4020-9726-3_15
Joordens, J. C. A., Vonhof, H. B., Feibel, C. S., Lourens, L. J., Dupont-Nivet, G., van der Lubbe, J. H. J. L., et al. (2011). An Astronomically-Tuned Climate Framework for Hominins in the Turkana Basin. Earth Planet. Sci. Lett. 307 (1–2), 1–8. doi:10.1016/j.epsl.2011.05.005
Joordens, J. C. A., Dupont-Nivet, G., Feibel, C. S., Spoor, F., Sier, M. J., van der Lubbe, J. H. J. L., et al. (2013). Improved Age Control on Early Homo Fossils from the Upper Burgi Member at Koobi Fora, Kenya. J. Hum. Evol. 65 (6), 731–745. doi:10.1016/j.jhevol.2013.09.002
Kebede, E., and Belay, A. (1994). Species Composition and Phytoplankton Biomass in a Tropical African lake (Lake Awassa, Ethiopia). Hydrobiologia 288 (1), 13–32. doi:10.1007/bf00006802
Kebede, E., and Willén, E. (1998). Phytoplankton in a Salinity-Alkalinity Series of Lakes in the Ethiopian Rift Valley. archiv_algolstud 89, 63–96. doi:10.1127/algol_stud/89/1998/63
Koi, S., Ikeda, H., Rutishauser, R., and Kato, M. (2015). Historical Biogeography of River-Weeds (Podostemaceae). Aquat. Bot. 127, 62–69. doi:10.1016/j.aquabot.2015.08.003
Kutzbach, J. E., and Otto-Bliesner, B. L. (1982). The Sensitivity of the African-Asian Monsoonal Climate to Orbital Parameter Changes for 9000 Years B.P. In a Low-Resolution General Circulation Model. J. Atmos. Sci. 39 (6), 1177–1188. doi:10.1175/1520-0469(1982)039<1177:tsotaa>2.0.co;2
Laskar, J., Robutel, P., Joutel, F., Gastineau, M., Correia, A. C. M., and Levrard, B. (2004). A Long-Term Numerical Solution for the Insolation Quantities of the Earth. Astronomy and Astrophysics 428 (1), 261–285. doi:10.1051/0004-6361:20041335
Lehmann, C. E. R., Anderson, T. M., Sankaran, M., Higgins, S. I., Archibald, S., Hoffmann, W. A., et al. (2014). Savanna Vegetation-Fire-Climate Relationships Differ Among Continents. Science 343 (6170), 548–552. doi:10.1126/science.1247355
Lepre, C. J., Quinn, R. L., Joordens, J. C. A., Swisher, C. C., and Feibel, C. S. (2007). Plio-Pleistocene Facies Environments from the KBS Member, Koobi Fora Formation: Implications for Climate Controls on the Development of lake-margin Hominin Habitats in the Northeast Turkana Basin (Northwest Kenya). J. Hum. Evol. 53 (5), 504–514. doi:10.1016/j.jhevol.2007.01.015
Lepre, C. J., Roche, H., Kent, D. V., Harmand, S., Quinn, R. L., Brugal, J.-P., et al. (2011). An Earlier Origin for the Acheulian. Nature 477 (7362), 82–85. doi:10.1038/nature10372
Lepre, C. J. (2014). Early Pleistocene lake Formation and Hominin Origins in the Turkana-Omo Rift. Quat. Sci. Rev. 102, 181–191. doi:10.1016/j.quascirev.2014.08.012
Levin, N. E., Brown, F. H., Behrensmeyer, A. K., Bobe, R., and Cerling, T. E. (2011). Paleosol Carbonates from the Omo Group: Isotopic Records of Local and Regional Environmental Change in East Africa. Palaeogeogr. Palaeoclimatol. Palaeoecol. 307 (1–4), 75–89. doi:10.1016/j.palaeo.2011.04.026
Levin, N. E. (2015). Environment and Climate of Early Human Evolution. Annu. Rev. Earth Planet. Sci. 43 (1), 405–429. doi:10.1146/annurev-earth-060614-105310
Li, R., Fan, J., Vachula, R. S., Tan, S., and Qing, X. (2019). Spatial Distribution Characteristics and Environmental Significance of Phytoliths in Surface Sediments of Qingshitan Lake in Southwest China. J. Paleolimnol 61 (2), 201–215. doi:10.1007/s10933-018-0053-9
Lourens, L. J. (2021). The Variation of the Earth's Movements (Orbital, Tilt, and Precession) and Climate Change. Climate Change: Observed Impacts on Planet Earth. 583–606. doi:10.1016/b978-0-12-821575-3.00028-1
Lupien, R. L., Russell, J. M., Feibel, C., Beck, C., Castañeda, I., Deino, A., et al. (2018). A Leaf Wax Biomarker Record of Early Pleistocene Hydroclimate from West Turkana, Kenya. Quat. Sci. Rev. 186, 225–235. doi:10.1016/j.quascirev.2018.03.012
Lupien, R. L., Russell, J. M., Grove, M., Beck, C. C., Feibel, C. S., and Cohen, A. S. (2020). Abrupt Climate Change and Its Influences on Hominin Evolution During the Early Pleistocene in the Turkana Basin, Kenya. Quat. Sci. Rev. 245. doi:10.1016/j.quascirev.2020.106531
Lupien, R. L., Russell, J. M., Yost, C. L., Kingston, J. D., Deino, A. L., Logan, J., et al. (2021). Vegetation Change in the Baringo Basin, East Africa across the Onset of Northern Hemisphere Glaciation 3.3-2.6 Ma. Palaeogeogr. Palaeoclimatol. Palaeoecol. 570 (6), 109426. doi:10.1016/j.palaeo.2019.109426
Lynch, J. A., Clark, J. S., and Stocks, B. J. (2004). Charcoal Production, Dispersal, and Deposition from the Fort Providence Experimental Fire: Interpreting Fire Regimes from Charcoal Records in Boreal Forests. Can. J. For. Res. 34 (8), 1642–1656. doi:10.1139/x04-071
Maundu, M. P., Ngugi, W. G., and Kabuye, H. S. C. (1999). Traditional Food Plants of Kenya. Nairobi: National Museums of Kenya.
Mbaluka, J. K., and Brown, F. H. (2016). Vegetation of the Koobi Fora Region Northeast of Lake Turkana, Marsabit County, Northern Kenya. J. East Afr. Nat. Hist. 105 (1), 21–50. doi:10.2982/028.105.0101
McNaughton, S. J. (1983). Serengeti Grassland Ecology: The Role of Composite Environmental Factors and Contingency in Community Organization. Ecol. Monogr. 53 (3), 291–320. doi:10.2307/1942533
McNaughton, S. J. (1985). Ecology of a Grazing Ecosystem: The Serengeti. Ecol. Monogr. 55 (3), 259–294. doi:10.2307/1942578
Merlis, T. M., Schneider, T., Bordoni, S., and Eisenman, I. (2013). The Tropical Precipitation Response to Orbital Precession. J. Clim. 26 (6), 2010–2021. doi:10.1175/jcli-d-12-00186.1
Meyers, S. R. (2014). Astrochron: An R Package for Astrochronology. Available: https://cran.r-project.org/package=astrochron.doi:10.4324/9781315712062
Mitani, M., Yamagiwa, J., Oko, R. A., Moutsambote, J.-M., Yumoto, T., and Maruhashi, T. (1993). Approaches in Density Estimates and Reconstruction of Social Groups in a Western Lowland Gorilla Population in the Ndoki Forest, Northern Congo. Tropics 2 (4), 219–229. doi:10.3759/tropics.2.219
Morrissey, A. (2014). Stratigraphic Framework and Quaternary Paleolimnology of the Lake Turkana Rift. KenyaNew York: Ph.D. Dissertation, Department of Earth Sciences, Syracuse University.
Morrissey, A., and Scholz, C. A. (2014). Paleohydrology of Lake Turkana and its Influence on the Nile River System. Palaeogeogr. Palaeoclimatol. Palaeoecol. 403, 88–100. doi:10.1016/j.palaeo.2014.03.029
Morrissey, A., Scholz, C. A., and Russell, J. M. (2017). Late Quaternary TEX86 Paleotemperatures from the World's Largest Desert lake, Lake Turkana, Kenya. J. Paleolimnol 59 (1), 103–117. doi:10.1007/s10933-016-9939-6
NASA (2019). Worldview Snapshots [Online]. Earth Observing System Data and Information System (EOSDIS). https://wvs.earthdata.nasa.gov. (Accessed July 29, 2019).
Nicholson, S. E. (2017). Climate and Climatic Variability of Rainfall over Eastern Africa. Rev. Geophys. 55 (3), 590–635. doi:10.1002/2016rg000544
Nicholson, S. E. (2018). The ITCZ and the Seasonal Cycle over Equatorial Africa. Bull. Am. Meteorol. Soc. 99 (2), 337–348. doi:10.1175/bams-d-16-0287.1
Nicholson, S. (2000). The Nature of Rainfall Variability over Africa on Time Scales of Decades to Millenia. Glob. Planet. Change 26, 137–158. doi:10.1016/s0921-8181(00)00040-0
Novello, A., Barboni, D., Sylvestre, F., Lebatard, A.-E., Paillès, C., Bourlès, D. L., et al. (2017). Phytoliths Indicate Significant Arboreal Cover at Sahelanthropus Type Locality TM266 in Northern Chad and a Decrease in Later Sites. J. Hum. Evol. 106, 66–83. doi:10.1016/j.jhevol.2017.01.009
Nutz, A., Schuster, M., Ghienne, J.-F., Roquin, C., and Bouchette, F. (2016). Wind-driven Waterbodies: a New Category of lake within an Alternative Sedimentologically-Based lake Classification. J. Paleolimnol 59 (2), 189–199. doi:10.1007/s10933-016-9894-2
Nutz, A., Schuster, M., Boës, X., and Rubino, J.-L. (2017). Orbitally-driven Evolution of Lake Turkana (Turkana Depression, Kenya, EARS) between 1.95 and 1.72 Ma: A Sequence Stratigraphy Perspective. J. Afr. Earth Sci. 125, 230–243. doi:10.1016/j.jafrearsci.2016.10.016
Nutz, A., Schuster, M., Barboni, D., Gassier, G., Van Bocxlaer, B., Robin, C., et al. (2020). Plio-Pleistocene Sedimentation in West Turkana (Turkana Depression, Kenya, East African Rift System): Paleolake Fluctuations, Paleolandscapes and Controlling Factors. Earth-Science Rev. 211, 103415. doi:10.1016/j.earscirev.2020.103415
Olang, M. O. (1984). “Vegetation Cover Assessment in Turkana District, Kenya,” in Proceedings of the Workshop on Land Evaluation and Extensive Grazing (LEEG) Addis Ababa, (Ethiopia. Netherlands: International Institute for Land Reclamation and Improvement), 183–219.
Oliveras, I., and Malhi, Y. (2016). Many Shades of green: the Dynamic Tropical Forest-Savannah Transition Zones. Phil. Trans. R. Soc. B 371 (1703), 20150308. doi:10.1098/rstb.2015.0308
Patterson, D. B., Braun, D. R., Behrensmeyer, A. K., Merritt, S., Zliobaite, I., Reeves, J. S., et al. (2017). Ecosystem Evolution and Hominin Paleobiology at East Turkana, Northern Kenya between 2.0 and 1.4 Ma. Palaeogeogr. Palaeoclimatol. Palaeoecol. 481, 1–13. doi:10.1016/j.palaeo.2017.05.001
Patterson, D. B., Braun, D. R., Allen, K., Barr, W. A., Behrensmeyer, A. K., Biernat, M., et al. (2019). Comparative Isotopic Evidence from East Turkana Supports a Dietary Shift within the Genus Homo. Nat. Ecol. Evol. 3 (7), 1048–1056. doi:10.1038/s41559-019-0916-0
Pays, O., Blanchard, P., Valeix, M., Chamaille-Jammes, S., Duncan, P., and Periquet, S. (2012). Detecting Predators and Locating Competitors While Foraging: An Experimental Study of a Medium-Sized Herbivore in an African Savanna. Oecologia 169, 419–430. doi:10.1007/s00442-011-2218-3
Peters, M. E., and Higuera, P. E. (2007). Quantifying the Source Area of Macroscopic Charcoal with a Particle Dispersal Model. Quat. Res. 67 (2), 304–310. doi:10.1016/j.yqres.2006.10.004
Polanco-Martínez, J. M. (2020). RolWinMulCor: An R Package for Estimating Rolling Window Multiple Correlation in Ecological Time Series. Ecol. Inform. 60, 101163. doi:10.1016/j.ecoinf.2020.101163
Prell, W. L., and Kutzbach, J. E. (1987). Monsoon Variability over the Past 150,000 Years. J. Geophys. Res. 92, 8411–8425. doi:10.1029/jd092id07p08411
Probert, J. R., Parr, C. L., Holdo, R. M., Anderson, T. M., Archibald, S., Courtney Mustaphi, C. J., et al. (2019). Anthropogenic Modifications to Fire Regimes in the Wider Serengeti-Mara Ecosystem. Glob. Change Biol. 25, 3406–3423. doi:10.1111/gcb.14711
Quigley, K. M., and Anderson, T. M. (2014). Leaf Silica Concentration in Serengeti Grasses Increases with Watering But Not Clipping: Insights From a Common Garden Study and Literature Review. Front. Plant Sci. 5, 568. doi:10.3389/fpls.2014.00568
Quinn, R. L., Lepre, C. J., Wright, J. D., and Feibel, C. S. (2007). Paleogeographic Variations of Pedogenic Carbonate δ13C Values from Koobi Fora, Kenya: Implications for floral Compositions of Plio-Pleistocene Hominin Environments. J. Hum. Evol. 53 (5), 560–573. doi:10.1016/j.jhevol.2007.01.013
R Core Team (2018). R: A Language and Environment for Statistical Computing [Online]. Vienna, Austria. Available: https://www.R-project.org/: R Foundation for Statistical Computinghttps://www.R-project.org/.
Roesch, A., and Schmidbauer, H. (2018). WaveletComp: Computational Wavelet Analysis. R package version 1.1. Available: https://CRAN.R-project.org/package=WaveletComp.
Rossignol-Strick, M. (1983). African Monsoons, an Immediate Climate Response to Orbital Insolation. Nature 304 (5921), 46–49. doi:10.1038/304046a0
Rugemalila, D. M., Anderson, T. M., and Holdo, R. M. (2016). Precipitation and Elephants, Not Fire, Shape Tree Community Composition in Serengeti National Park, Tanzania. Biotropica 48 (4), 476–482. doi:10.1111/btp.12311
Schuster, M., and Nutz, A. (2019). Lake-level changes and hominin occupations in the arid Turkana basin during volcanic closure of the Omo River outflows to the Indian Ocean - comment on the published paper by Boës et al. Quaternary Research (2018), Vol. 91.2, 892-909. Quat. Res. 92 (2), 598–600. doi:10.1017/qua.2019.14
Sier, M. J., Langereis, C. G., Dupont-Nivet, G., Feibel, C. S., Joordens, J. C. A., van der Lubbe, J. H. J. L., et al. (2017). The Top of the Olduvai Subchron in a High-Resolution Magnetostratigraphy from the West Turkana Core WTK13, Hominin Sites and Paleolakes Drilling Project (HSPDP). Quat. Geochronol. 42, 117–129. doi:10.1016/j.quageo.2017.08.004
Sponheimer, M., Alemseged, Z., Cerling, T. E., Grine, F. E., Kimbel, W. H., Leakey, M. G., et al. (2013). Isotopic Evidence of Early Hominin Diets. Proc. Natl. Acad. Sci. 110 (26), 10513–10518. doi:10.1073/pnas.1222579110
Stewart, K. M. (2014). Environmental Change and Hominin Exploitation of C4-Based Resources in Wetland/savanna Mosaics. J. Hum. Evol. 77, 1–16. doi:10.1016/j.jhevol.2014.10.003
Strömberg, C. A. E. (2009). Methodological Concerns for Analysis of Phytolith Assemblages: Does Count Size Matter? Quat. Int. 193 (1–2), 124–140. doi:10.1016/j.quaint.2007.11.008
Trauth, M. H., Maslin, M. A., Deino, A., and Strecker, M. R. (2005). Late Cenozoic Moisture History of East Africa. Science 309 (5743), 2051–2053. doi:10.1126/science.1112964
Tuenter, E., Weber, S. L., Hilgen, F. J., and Lourens, L. J. (2003). The Response of the African Summer Monsoon to Remote and Local Forcing Due to Precession and Obliquity. Glob. Planet. Change 36 (4), 219–235. doi:10.1016/s0921-8181(02)00196-0
Turner, R., Kelly, A., and Roberts, N. (2008). “A Critical Assessment and Experimental Comparison of Microscopic Charcoal Extraction Methods,” in Charcoals from the Past: Cultural and Palaeoenvironmental Implications. Editors G. Fiorentino, and D. Margi (Oxford: Archaeopress), 225–272.
Uno, K. T., Polissar, P. J., Kahle, E., Feibel, C., Harmand, S., Roche, H., et al. (2016). A Pleistocene Palaeovegetation Record from Plant Wax Biomarkers from the Nachukui Formation, West Turkana, Kenya. Phil. Trans. R. Soc. B. 371 (1698), 1–10. doi:10.1098/rstb.2015.0235
Vachula, R. S. (2021). A Meta-Analytical Approach to Understanding the Charcoal Source Area Problem. Palaeogeogr. Palaeoclimatol. Palaeoecol. 562. doi:10.1016/j.palaeo.2020.110111
van Breugel, P., Kindt, R., Lillesø, J. P. B., Bingham, M., Demissew, S., Dudley, C., et al. (2015). Potential Natural Vegetation Map of Eastern Africa (Burundi, Ethiopia, Kenya, Malawi, Rwanda, Tanzania, Uganda and Zambia). Version 2.0. (Forest & Landscape Denmark and World Agroforestry Centre (ICRAF)URL: http://vegetationmap4africa.org.
van der Lubbe, H. J. L., Krause-Nehring, J., Junginger, A., Garcin, Y., Joordens, J. C. A., Davies, G. R., et al. (2017). Gradual or Abrupt? Changes in Water Source of Lake Turkana (Kenya) during the African Humid Period Inferred from Sr Isotope Ratios. Quat. Sci. Rev. 174, 1–12. doi:10.1016/j.quascirev.2017.08.010
van Wyk, J. (1979). “A General Account of the Grass Cover of Africa,” in Ecology of Grasslands and Bamboolands of the World. Editor M. Numata (The Hague: Junk BV Publishers), 124–132.
Viste, E., and Sorteberg, A. (2013). Moisture Transport into the Ethiopian highlands. Int. J. Climatol. 33 (1), 249–263. doi:10.1002/joc.3409
Whitlock, C., and Anderson, R. S. (2003). “Fire History Reconstructions Based on Sediment Records from Lakes and Wetlands,”in Fire and Climatic Change in Temperate Ecosystems of the Western Americas. New York: Springer, 3–31.
Wood, B., and Leakey, M. (2011). The Omo-Turkana Basin Fossil Hominins and Their Contribution to Our Understanding of Human Evolution in Africa. Evol. Anthropol. 20 (6), 264–292. doi:10.1002/evan.20335
Wynn, J. G. (2004). Influence of Plio-Pleistocene Aridification on Human Evolution: Evidence from Paleosols of the Turkana Basin, Kenya. Am. J. Phys. Anthropol. 123 (2), 106–118. doi:10.1002/ajpa.10317
Yang, W., Seager, R., Cane, M. A., and Lyon, B. (2015). The Annual Cycle of East African Precipitation. J. Clim. 28 (6), 2385–2404. doi:10.1175/jcli-d-14-00484.1
Yost, C. L., Blinnikov, M. S., and Julius, M. L. (2013). Detecting Ancient Wild rice (Zizania Spp. L.) Using Phytoliths: a Taphonomic Study of Modern Wild rice in Minnesota (USA) lake Sediments. J. Paleolimnol 49 (2), 221–236. doi:10.1007/s10933-012-9670-x
Yost, C. L., Ivory, S. J., Deino, A. L., Rabideaux, N. M., Kingston, J. D., and Cohen, A. S. (2021). Phytoliths, Pollen, and Microcharcoal from the Baringo Basin, Kenya Reveal savanna Dynamics during the Plio-Pleistocene Transition. Palaeogeogr. Palaeoclimatol. Palaeoecol. 570, 109779. doi:10.1016/j.palaeo.2020.109779
Keywords: paleofire, phytoliths, phytoscape, orbital forcing, Nachukui formation, Nariokotome Boy, Homo ergaster, microcharcoal
Citation: Yost CL, Lupien RL, Beck C, Feibel CS, Archer SR and Cohen AS (2021) Orbital Influence on Precipitation, Fire, and Grass Community Composition From 1.87 to 1.38 Ma in the Turkana Basin, Kenya. Front. Earth Sci. 9:568646. doi: 10.3389/feart.2021.568646
Received: 01 June 2020; Accepted: 15 July 2021;
Published: 28 July 2021.
Edited by:
Christian Zeeden, Leibniz Institute for Applied Geophysics (LIAG), GermanyReviewed by:
Alberto Saez, University of Barcelona, SpainStefanie Kaboth-Bahr, University of Potsdam, Germany
Copyright © 2021 Yost, Lupien, Beck, Feibel, Archer and Cohen. This is an open-access article distributed under the terms of the Creative Commons Attribution License (CC BY). The use, distribution or reproduction in other forums is permitted, provided the original author(s) and the copyright owner(s) are credited and that the original publication in this journal is cited, in accordance with accepted academic practice. No use, distribution or reproduction is permitted which does not comply with these terms.
*Correspondence: Chad L. Yost, Chad.Yost@indstate.edu