Download presentation
Presentation is loading. Please wait.

1
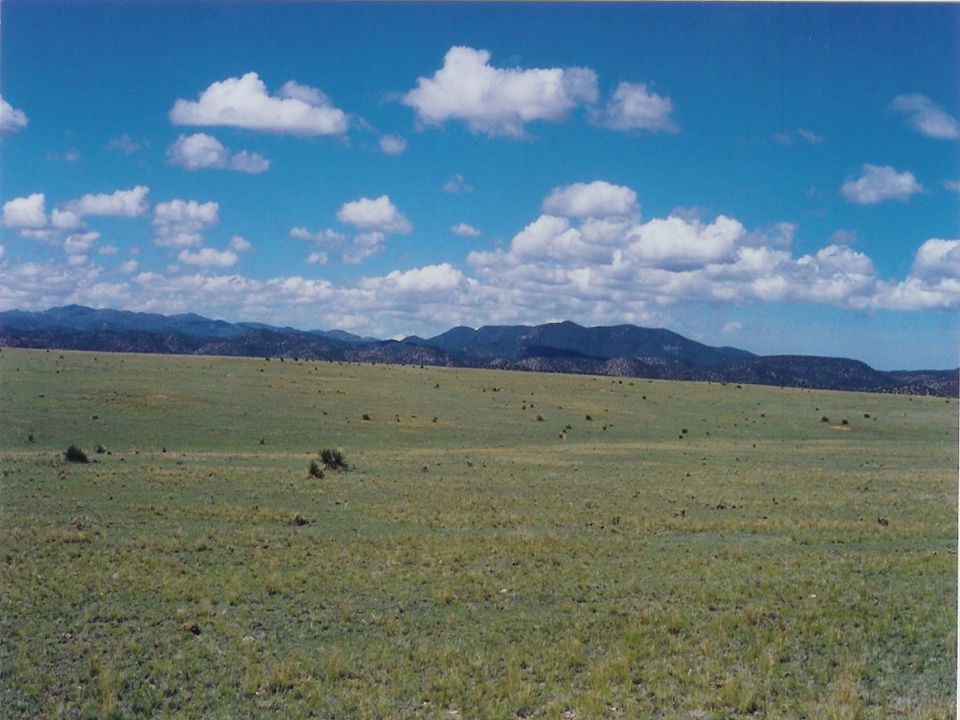
The Shortgrass Prairie

10
Plants of the Shortgrass Prairie 1.Bouteloua gracilis- Blue grama 2.Buchloe dactyloides- Buffalograss 3.Agropyron smithii- Western wheatgrass 4.Stipa comata- Needle-and-thread 5.Koeleria cristata- Prairie junegrass 6.Hilaria jamesii- Galleta grass 7.Muhlenbergia torreyi- Ring muhly

11
Plants of the Shortgrass Prairie cont. 8. Aristida longiseta- Red threeawn 9. Sphaeralcea coccinea- Scarlet globemalllow 10. Helianthus annuus- Annual sunflower 11. Artemisia frigida- Fringed sagewort

12
Heavy Moderate Light Average duration of study (years)11.4 11.4 11.4 Average annual precipitation (inches)20.7 20.7 20.7 Average use of forage (%)57 43 32 Average forage production (lbs/acre) 1,175 1 (1,065) 2 1,473 1 (1308) 2 1.597 1 Range trend down (23/25) up(13/25) up(14/18) Average calf crop (%) 80 84 85 Average lamp crop (%)78 82 87 Calf weaning wt (lbs) 429.7457.3 --- Lamb weaning wt (lbs)56.8 63.1 --- Gain per steer (lbs) 157.6 202.6 226.6 Steer/calf gain per day (lbs) 1.83 2.15 2.30 Net returns per animal ($) 38.06 1 (29.00) 2 51.57 1 (39.71) 2 58.89 1 Net returns per acre ($) 1.35 1 (2.07) 2 2.93 1 (2.72) 2 2.64 1 Table 3. Summary of 25 studies on effects of grazing intensity on native vegetation and livestock production in North America. 1 Average for those studies comparing heavy, moderate and light grazing (studies comparing only heavy and moderate grazing excluded). 2 Average for all studies
. 2 Average for all studies.")
13
Table 5. Summary of 15 studies on effects of rotation grazing systems on native rangeland vegetation and livestock production in North America. ___________________________________ Season long Characteristicor continuousRotation grazing grazing ________________________________________________ Average use of 41.842.4 Forage (%) Average forage Production (lb/ac) +7%
 Average forage Production (lb/ac) +7%.")
14
Table 5a. Summary of 15 studies on effects of rotation grazing systems on native rangeland vegetation and livestock production in North America. _________________________________ Season long Characteristicor continuousRotation grazing grazing _________________________________________ Range trend (%)up= 61 up= 69 stable= 31 stable= 8 down= 8 down=23 Average calf crop (%)89.485.9
up= 61 up= 69 stable= 31 stable= 8 down= 8 down=23 Average calf crop (%)")
15
Table 5b. Summary of 15 studies on effects of rotation grazing systems on native rangeland vegetation and livestock production in North America. ______________________________ Season long Characteristicor continuousRotation grazing grazing __________________________________________ Calf weaning weight504.6494.1 (lb) Net returns ($/ acre)6.606.37
 Net returns ($/ acre)")
16
Table 8. Yearling cattle production and financial return characteristics at the Central Great Plains Experimental Range, Colorado Grazing Intensity ExcessiveModerate Forage production (lbs/acre) 536 689 Forage utilization (%) 54 37 Weight again per animal (lbs) 218 268 Weight again per unit area (lbs/acre) 22 34 Death loss (%) 1.43 0.33 Gross income/acre ($) 1.54 1.93 Gross income/yearling ($) 81.22 96.02 Source; Kipple, G.E., and D.F. Costello. (1960). Vegetation and cattle to different intensities of grazing on shortgrass range of the central Great Plains. U.S. Dept. Agric. Tech. Bull. 1216.
 Forage utilization (%) Weight again per animal (lbs) Weight again per unit area (lbs/acre) Death loss (%) Gross income/acre ($) Gross income/yearling ($) Source; Kipple, G.E., and D.F. Costello. (1960). Vegetation and cattle to different intensities of grazing on shortgrass range of the central Great Plains. U.S. Dept. Agric. Tech. Bull")
17
Continuous Grazing 1. Works well in flat desert areas 2. Works well in flat shortgrass prairie areas 3. Works well in California annual grassland 4. Require the least fence of all the systems 5. Has given better livestock performance than rotation systems

18
Characteristic Season-long Deferred Time rotation controlled Duration of study (years) 13 13 13 Annual precipitation (inches) 15.1 15.1 15.1 Use of forage (%) 40 40 40 Acres/steer 5 5 5 Forage production (lbs./acre) No difference Range trend No difference Steer gains (lbs./acre) No difference Financial returns ($/acre) 15.20 13.72 12.07 Sources: Hart, R.H., M.J. Samuel, P.S. Test and M.A. Smith. 1988. Cattle, vegetation and economic responses to grazing systems and grazing pressure. J. Range Manage. 41:282-286, Manley, W.A., R.H. Hart, J.W. Waggoner Jr., and J.T. Manley.1997. Vegetation, cattle and economic responses to grazing strategies and pressure. J. Range Manage.50:638-646. Table 17. Effects of season-long, deferred rotation and time controlled on vegetation and cattle on vegetation and cattle on short grass range in Wyoming.

19
Table 12. Forage Production (lbs/acre) on Heavily and Moderately Stocked Pastures in Drought Compared to 10-years Average on the Fort Stanton Experimental Range in New Mexico. Drought 10 years Drought year Years Average as percent Grazing intensity 1974 (1970-1979) of average Heavy (50-55% use)10360717% Moderate (40-45% use)23574032% Source: Pieper et al. 1991, Holechek, 1994.
 on Heavily and Moderately Stocked Pastures in Drought Compared to 10-years Average on the Fort Stanton Experimental Range in New Mexico. Drought 10 years Drought year Years Average as percent Grazing intensity 1974 ( ) of average Heavy (50-55% use) % Moderate (40-45% use) % Source: Pieper et al. 1991, Holechek,")
23
Wildlife of the Shortgrass Prairie

29
Management of the Shortgrass Prairie

30
1. Graze either conservatively or moderately 2. Continuous grazing has worked best 3. Pronghorn should be considered in fence construction 4. Both cattle and sheep well suited for this type, cattle are more compatible with wildlife 5. Pronghorn complement cattle in food habits and can be important source of income 6. Conservation Reserve lands provide income diversification, erosion control and valuable wildlife habitat 7. Wheatgrasses and blue grama have been effective in seeding former farmland and returning it to rangeland and CRP land, legumes greatly enhance wildlife value

Similar presentations