Submit or Track your Manuscript LOG-IN

Proximate Composition and Minerals Content of Wheat (Triticum aestivum L.) Under Boric Acid Stress via Energy-Dispersive X-Ray (EDX) Fluorescence Based Analysis

Proximate Composition and Minerals Content of Wheat (Triticum aestivum L.) Under Boric Acid Stress via Energy-Dispersive X-Ray (EDX) Fluorescence Based Analysis

Muhammad Adnan1*, Muhammad Nauman Khan2,3, Barkat Ullah2, Faisal Zaman2, Alevcan Kaplan4, Hubert O. Dossou-Yovo5, Sajid Ali Khan Bangash6, Sana Wahab7, Mehreen Ghazal8 and Muhammad Hassan Sarfraz9

1Iqbal Ahamd Qarshi Laboratory, Qarshi Brands Departnment at Qarshi industries (Pvt.), Ltd. Hattar Haripur, Pakistan; 2Department of Botany, Islamia College Peshawar, 25120, Pakistan; 3Biology Laboratory, University Public School (UPS), University of Peshawar, 25120, Pakistan; 4Department of Crop and Animal Production, Sason Vocational School, Batman University, Batman 72060, Turkiye; 5Laboratory of Applied Ecology, Faculty of Agronomic Sciences, University of Abomey-Calavi, Benin, P.O Box 1974 Godomey, Benin; 6Institute of Biotechnology and Genetic Engineering, The University of Agriculture, 25130 Peshawar, Pakistan; 7Department of Plant Sciences, Faculty of Biological Sciences, Quaid-i-Azam University, Islamabad 45320, Pakistan; 8Centre of Plant Biodiversity, University of Peshawar, Peshawar 25120, Pakistan; 9Botnar Institute of Musculoskeletal Sciences, Nuffield Department of Orthopaedics, Rheumatology and Musculoskeletal Sciences, University of Oxford, OX3 7LD, United Kingdom.

 
*Correspondence | Muhammad Adnan, Iqbal Ahamd Qarshi Laboratory, Qarshi Brands Departnment at Qarshi industries (Pvt.), Ltd. Hattar Haripur, Pakistan; Email: muhammadadnan112255@gmail.com 

Figure 2:

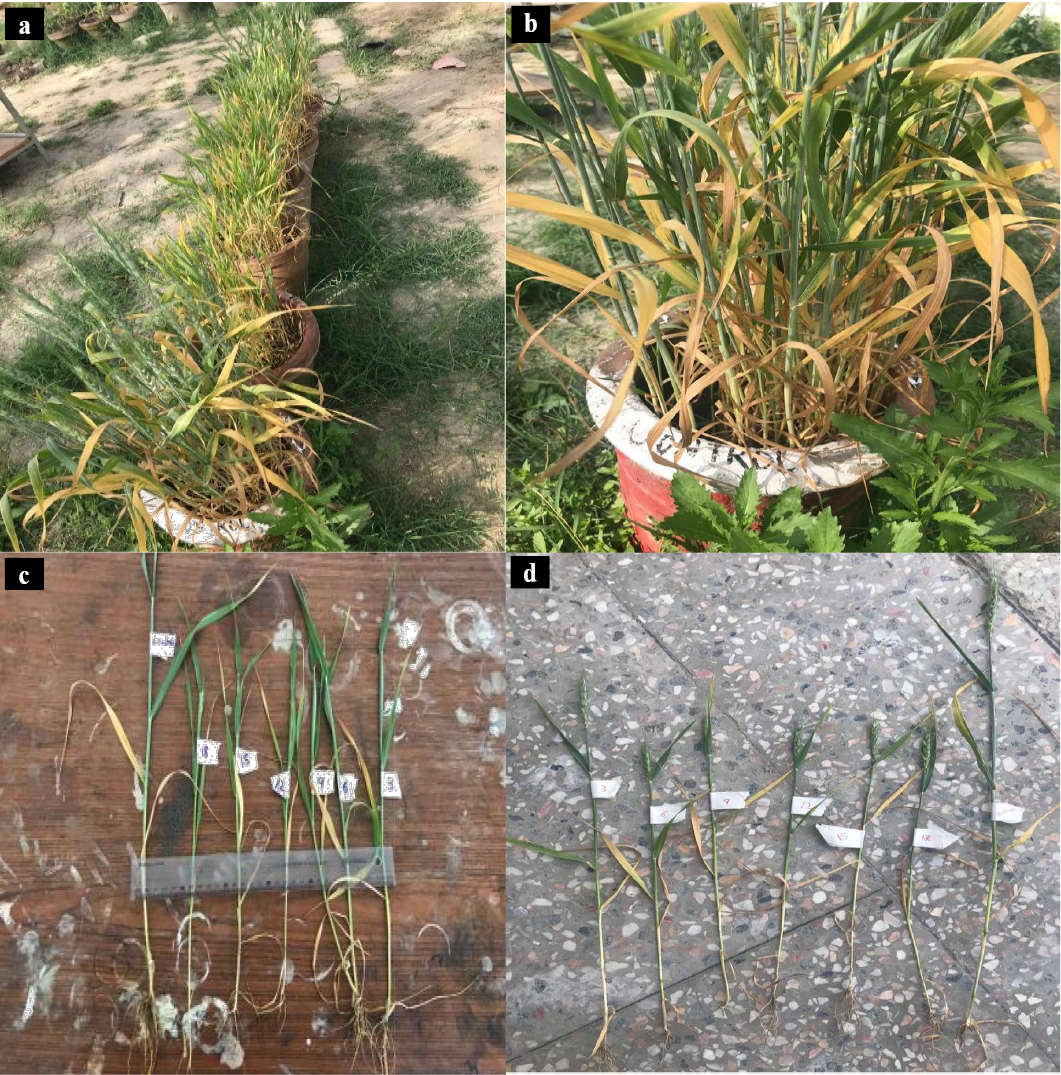
Plants affected under B stress. (a-b) General view of plants under B stress, (c) Measurement and observations of different plants under B stress at vegetative stage, (d) Observations of different plants under B stress at reproductive/ fruiting stage.

Figure 3:

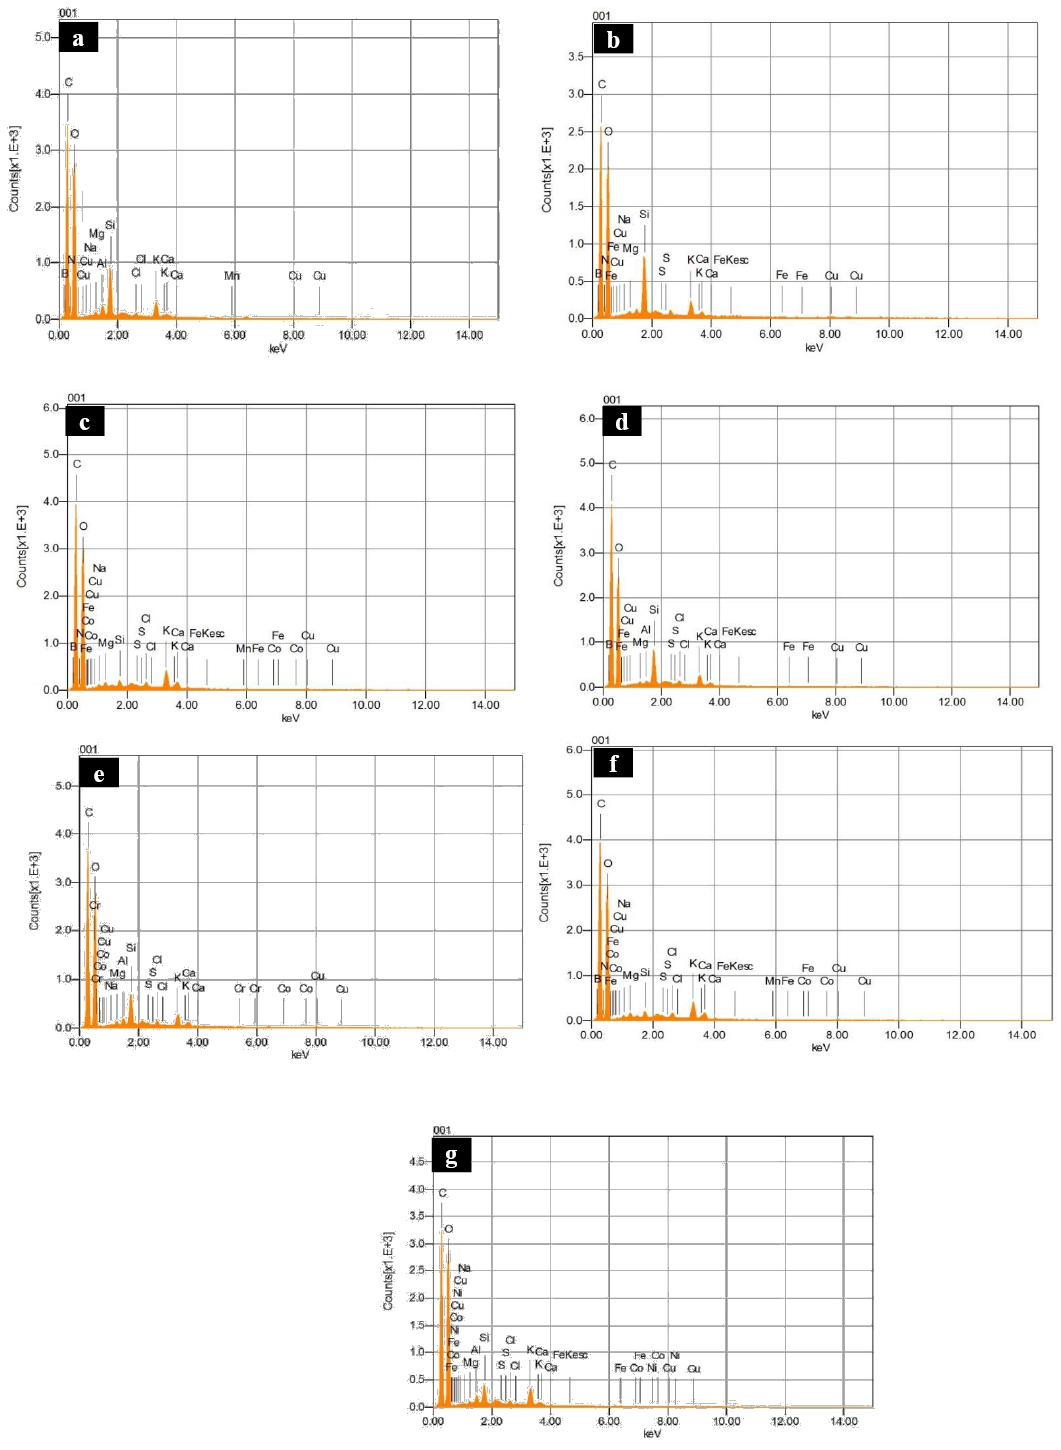
Different amount of elements detecting in wheat under B stress at (a) T0=0 mg/kg H3BO3; (b) T1=3 mg/kg H3BO3; (c) T2=6 mg/kg H3BO3; (d) T3=9 mg/kg H3BO3; (e) T4=12 mg/kg H3BO3; (f) T5=15 mg/kg H3BO3; (g) T6=18 mg/kg H3BO3.

Figure 4:

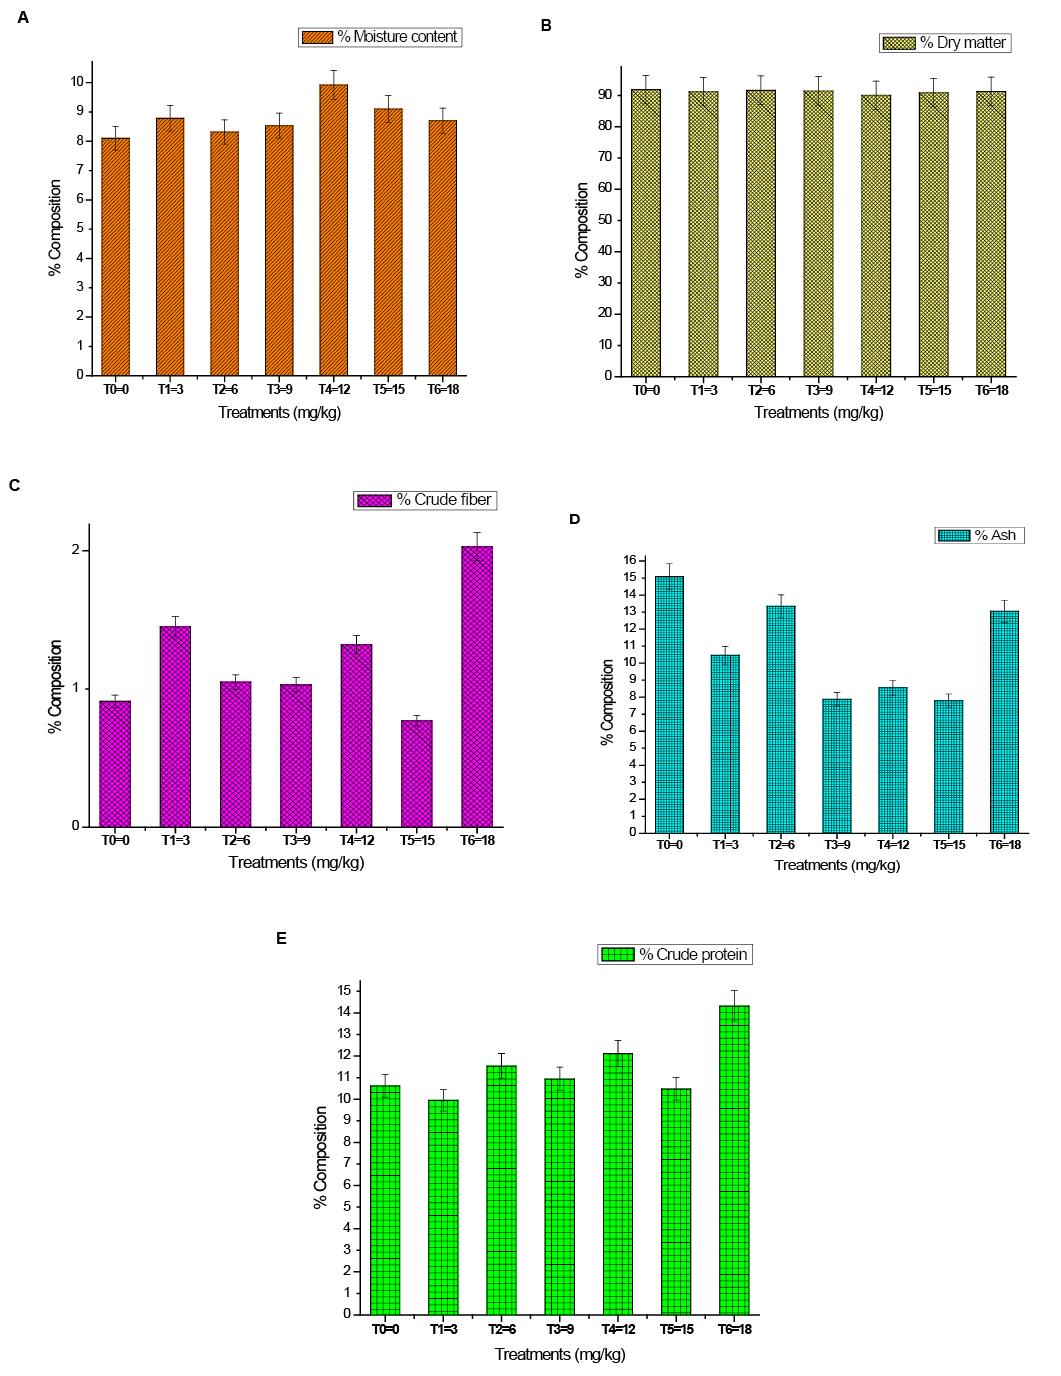
Different amount of nutrients detecting in wheat under B stress at different treatments (A) % Moisture content, (B) % Dry matter yield, (C) % Crude fiber, (D) % Ash, (E) % Crude protein.

Equation 1
Equation 2
Equation 3
Equation 4
Equation 5
Figure 1:

Map showing the location of the study area circled in red.

Pakistan Journal of Zoology

April

Pakistan J. Zool., Vol. 56, Iss. 2, pp. 503-1000

Featuring

Click here for more

Subscribe Today

Receive free updates on new articles, opportunities and benefits


Subscribe Unsubscribe