
Comparative analysis of the complete plastid genomes of Mangifera species and gene transfer between plastid and mitochondrial genomes
- Published
- Accepted
- Received
- Academic Editor
- Rogerio Sotelo-Mundo
- Subject Areas
- Agricultural Science, Genetics, Molecular Biology, Plant Science
- Keywords
- Mangifera, Chloroplast genome, DNA barcodes, Gene transfer, Phylogenetic analysis
- Copyright
- © 2021 Niu et al.
- Licence
- This is an open access article distributed under the terms of the Creative Commons Attribution License, which permits unrestricted use, distribution, reproduction and adaptation in any medium and for any purpose provided that it is properly attributed. For attribution, the original author(s), title, publication source (PeerJ) and either DOI or URL of the article must be cited.
- Cite this article
- 2021. Comparative analysis of the complete plastid genomes of Mangifera species and gene transfer between plastid and mitochondrial genomes. PeerJ 9:e10774 https://doi.org/10.7717/peerj.10774
Abstract
Mango is an important commercial fruit crop belonging to the genus Mangifera. In this study, we reported and compared four newly sequenced plastid genomes of the genus Mangifera, which showed high similarities in overall size (157,780–157,853 bp), genome structure, gene order, and gene content. Three mutation hotspots (trnG-psbZ, psbD-trnT, and ycf4-cemA) were identified as candidate DNA barcodes for Mangifera. These three DNA barcode candidate sequences have high species identification ability. We also identified 12 large fragments that were transferred from the plastid genome to the mitochondrial genome, and found that the similarity was more than 99%. The total size of the transferred fragment was 35,652 bp, accounting for 22.6% of the plastid genome. Fifteen intact chloroplast genes, four tRNAs and numerous partial genes and intergenic spacer regions were identified. There are many of these genes transferred from mitochondria to the chloroplast in other species genomes. Phylogenetic analysis based on whole plastid genome data provided a high support value, and the interspecies relationships within Mangifera were resolved well.
Introduction
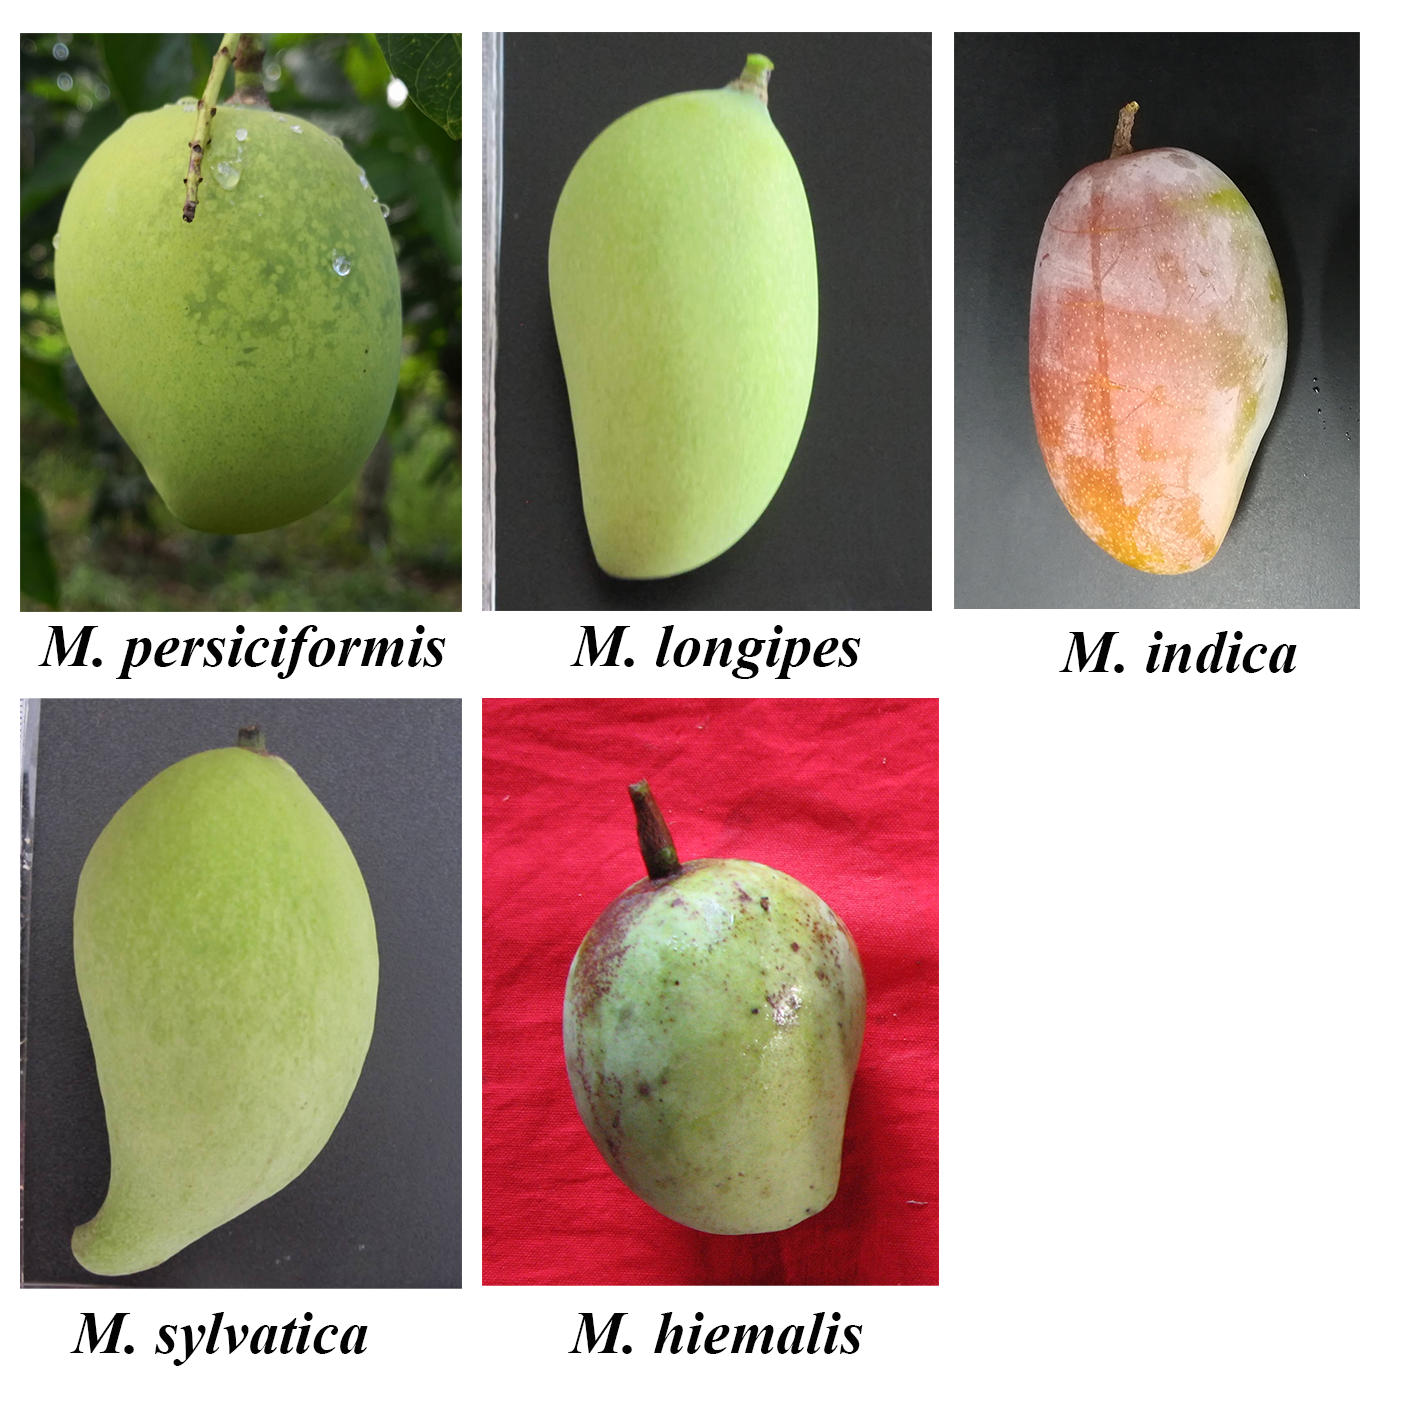
Mango is a tall, evergreen tree belonging to the genus Mangifera of the Anacardiaceae family. It is an important tropical fruit (Iquebal et al., 2017; Lora & Hormaza, 2018) that originates in tropical and subtropical regions in Southeast Asia (Dutta et al., 2013; Sherman et al., 2015). Owing to its wide range of cultivation (Bajpai et al., 2016), high nutrient value, pleasing appearance, and unique flavor (Surapaneni et al., 2013), it is widely loved by consumers and has the reputation of being known as the “King of Tropical Fruits” (Khan, Ali & Khan, 2015). Southeast Asian countries have a history of mango cultivation that spans thousands of years (Ravishankar et al., 2013). Mangoes were introduced to Africa, South America, and other continents hundreds of years ago, and several varieties suitable for local cultivation have been developed (Mansour, Mekki & Hussein, 2014; Sennhenn et al., 2014). There are 69 species of mango in the world that are mainly distributed in tropical and subtropical countries including India, Indonesia, the Malay Peninsula, Thailand, and South China, of which, five species are grown in China, namely M. indica, M. persiciformis, M. longipes, M. hiemalis, and M. sylvatica; however, the varieties cultivated in production belong to M. indica. Phylogenetic analysis of Mangifera species has been a hot topic of research (Nishiyama et al., 2006; Sankaran et al., 2018), while the whole chloroplast genome sequences can provide more genetic information and higher species resolution ability than other molecular data. However, the chloroplast genomes of most Mangifera plants remain unknown (Azim, Khan & Zhang, 2014).
Chloroplasts are special organelles that are involved in photosynthesis and consist of layers of thylakoids. They have their own DNA and can split. The chloroplast genome is conserved and consists of four parts. Two inverted repeat (IR) regions separate the small copy region (SSC) and large copy region (LSC). Currently, with the rapid development of next-generation sequencing (NGS) technology, the entire chloroplast genome has been widely used for phylogenetic analysis. They can provide a large number of variable sites for phylogenetic analysis (Gitzendanner et al., 2018). Thus, the entire chloroplast genome shows the potential to resolve evolutionary relationships and produce highly resolved phylogenetic and genetic diversity, particularly in some complex taxa or at low taxonomic levels, which have unresolved relationships (Hu et al., 2016; Huang et al., 2020; Xu et al., 2019).
In this study, the chloroplast genomes of four Mangifera species were sequenced and compared with M. Indica and 21 Sapindales plastids. The objectives of this study were as follows: (1) to comparatively analyze the chloroplast genome structure of five species of Mangifera; (2) to identify highly divergent regions of the chloroplast genomes of Mangifera; (3) to determine the insertion of chloroplast genes into mitochondria; (4) to explore the evolutionary relationship between the genus, Mangifera, and Sapindales. Overall, this study would be helpful to further understand plastid evolution and phylogeny of the genus, Mangifera.
Materials and Methods
Plant material, DNA extraction, and sequencing
Fresh leaves of four Mangifera species (M. hiemalis, M. persiciformis, M. longipes, and M. sylvatica) were collected from Xishuangbanna Tropical Flowers and Plants Garden, South Yunnan, China, and frozen in liquid nitrogen. Total genomic DNA was extracted from all samples according to CTAB method (Li et al., 2013). DNA quality was detected using 1% agarose gel electrophoresis and samples were stored at −80 °C until further use.
About 5–10 µg of total DNA were extracted from each of the Mangifera samples to construct a shotgun library with an average insertion size of 300 bp. Paired-end libraries were constructed with NEBNext® DNA Library Prep Master Mix Set for Illumina according to the manufacturer’s recommendation. Illumina HiSeq 2500 system (Illumina, San Diego, CA, USA) was used to sequence DNA samples in the paired-end sequencing mode by Novogene Bioinformatics Technology Co. Ltd (Beijing, China), generating approximately 8.0 Gb of raw data per sample. The plastome depth of coverage was more than 2000 ×.
Chloroplast genome assembly and annotation
The Trimmomatic v0.38 was used to filter raw sequencing data (Bolger, Lohse & Usadel, 2014), and the obtained clean data were de novo assembled using SPAdes v3.61 under different K-mer parameters (Bankevich et al., 2012). The scaffolds that were positively associated with chloroplasts were arranged on the reference chloroplast genome of M. indica (NC_035239). Paired-end reads were remapped to consensus assembly and multiple iterations were performed to fill in the gaps in the final consensus sequence using Geneious software v2020.0.4 (Kearse et al., 2012).
Chloroplast genome annotation was performed using GeSeq (https://chlorobox.mpimp-golm.mpg.de/geseq.html) to predict genes encoding proteins, transfer RNA (tRNA), and ribosomal RNA (rRNA), and was adjusted manually as needed (Tillich et al., 2017). We also manually examined the IR junctions of all Mangifera species. A circular diagram of the chloroplast genomes of Mangifera was subsequently drawn using OGDRAW v1.3.1 (Greiner, Lehwark & Bock, 2019).
Genome comparative analysis and divergent hotspot identification
MAFFT v7.221 was used to align the chloroplast genome sequences of five Mangifera plants (Katoh & Standley, 2013). Next, DnaSP v6.12 was used to perform a sliding window analysis with the step size of 200 bp and window length of 600 bp, to detect the rapidly evolving molecular markers for performing phylogenetic analysis (Librado & Rozas, 2009).
Identification of chloroplast gene insertion in mitochondria
First, we removed the BLAST hits of genes transferred between chloroplast and mitochondrial genomes by mapping the mitochondrial genome of M. indica (GenBank: CM021857) to the plastid genomes. Circos v0.69-9 (Krzywinski et al., 2009) software was used to map the mitochondrial and chloroplast genomes of the Mangifera species as well as gene-transfer fragments.
Phylogenetic analysis
Phylogenetic analyses were performed for five Mangifera (4 species sequenced here) and 21 Sapindales species, using Arabidopsis thaliana as outgroups. MAFFT 7.221 (Katoh & Standley, 2013) was used to align the chloroplast genome sequences of Sapindales species. We used the following three methods to perform phylogenetic analyses of Mangifera species: Bayesian Inference (BI) with a GTR + I + G model using MrBayes v3.2 (Ronquist et al., 2012), the Markov chain Monte Carlo (MCMC) algorithm was run for 1 million generations and sampled every 100 generations. Maximum Likelihood (ML) using MEGA v7.0 with 1000 bootstrap replicates (Kumar, Stecher & Tamura, 2016), and Maximum Parsimony (MP) with a heuristic search in PAUP v4.0 with 1,000 random taxon stepwise addition sequences (Swofford, 1993). A 50% majority-rule consensus phylogeny was constructed using 1,000 bootstrap replications.
Results and Discussion
Basic characteristics of the Mangifera chloroplast genomes
Raw data (approximately from 7.1 × 10⁹ to 8.3 × 10⁹ bp) were obtained from M. hiemalis (MN917208), M. persiciformis (MN917209), M. longipes (MN917210), and M. sylvatica (MN917211). The four newly sequenced Mangifera chloroplast genomes have been presented to the GenBank database.
Characteristics of four newly sequenced and one reported Mangifera chloroplast genomes were investigated. Mangifera chloroplast genome sequence sizes were 157,780∼157,853 bp (Fig. 1), with the largest and smallest being those of M. longipes and M. indica, respectively. Mangifera chloroplast genomes are characterized by a typical four-part structure, two IR copies (26,354–26,379 bp) separating the LSC (86,673–86,726 bp) and SSC (18,347–18,369 bp) regions. In addition, the GC content of Mangifera genomes was similar, ranging from 37.88–37.89%. Five Mangifera chloroplast genomes contained 113 predicted functional genes, including 79 protein-coding genes, four ribosomal RNA (rRNA) genes, and 30 transfer RNA (tRNA) genes (Tables 1 and 2). Furthermore, 15 functional genes, including four protein-coding genes, four ribosomal RNA genes, and seven transfer RNA gene replicate in the IR regions of the chloroplast genome. The number, type, and order of genes were found to be very similar among the five Mangifera chloroplast genomes (Jo et al., 2017; Rabah et al., 2017; Zhang et al., 2020). The whole chloroplast genome sequences of four Mangifera species were submitted to GenBank with the accession numbers of MN917208 to MN917211.
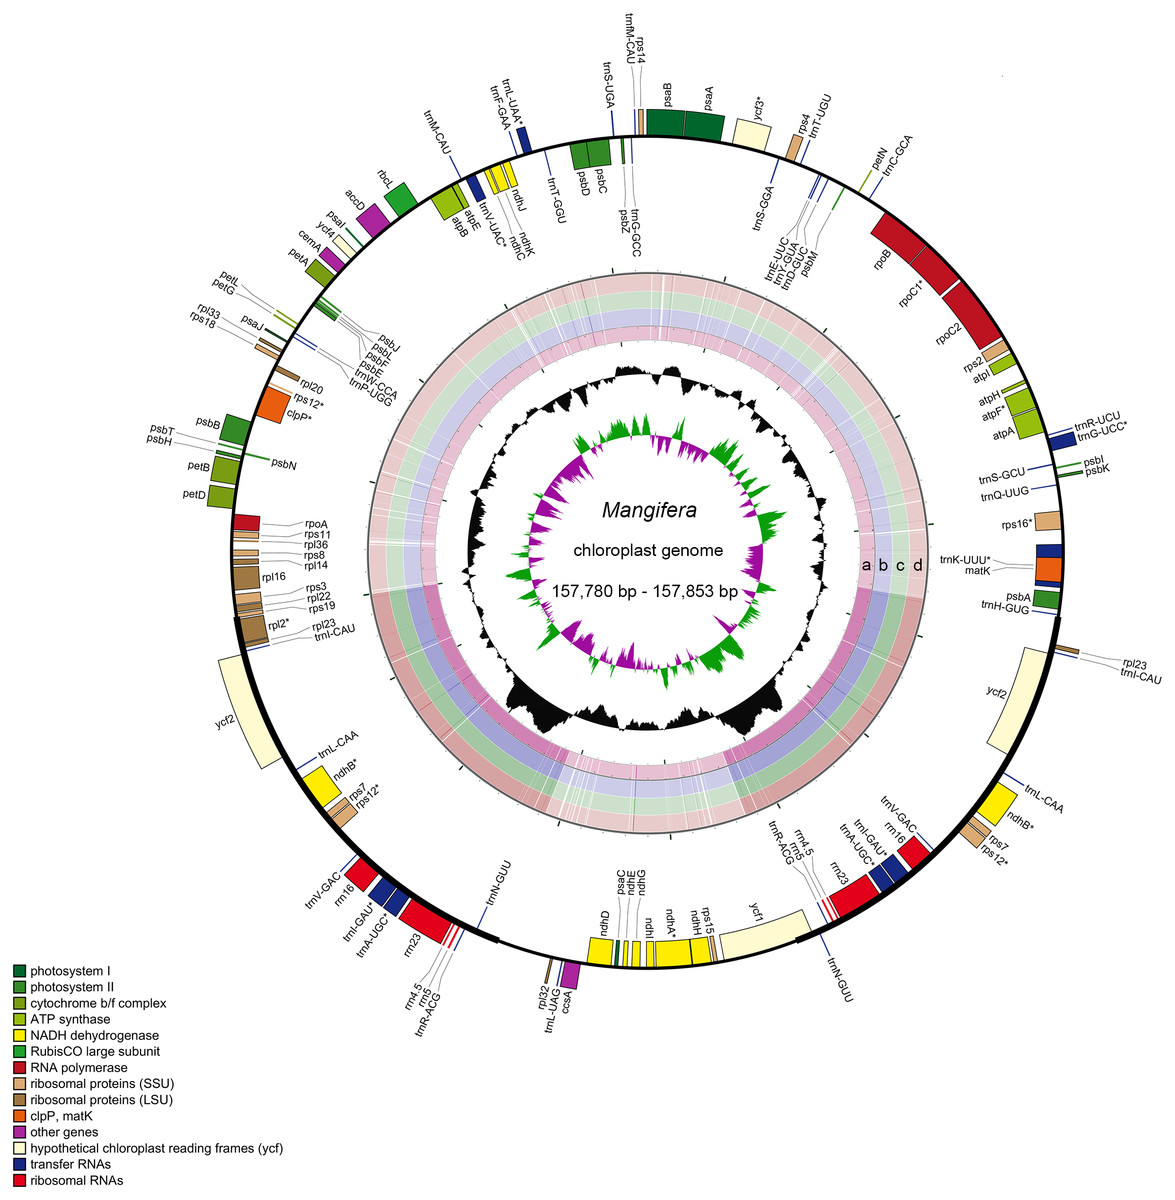
Figure 1: Sequence diagram of Mangifera chloroplast genomes.
Gene map of Mangifera chloroplast genomes, sequence alignment of Mangifera species chloroplast genome ((A) M. Sylvatica, (B) M. hiemalis, (C) M. longipes, (D) M. persiciformis with reference to M. indica), GC content, and GC skew from the outside to inside.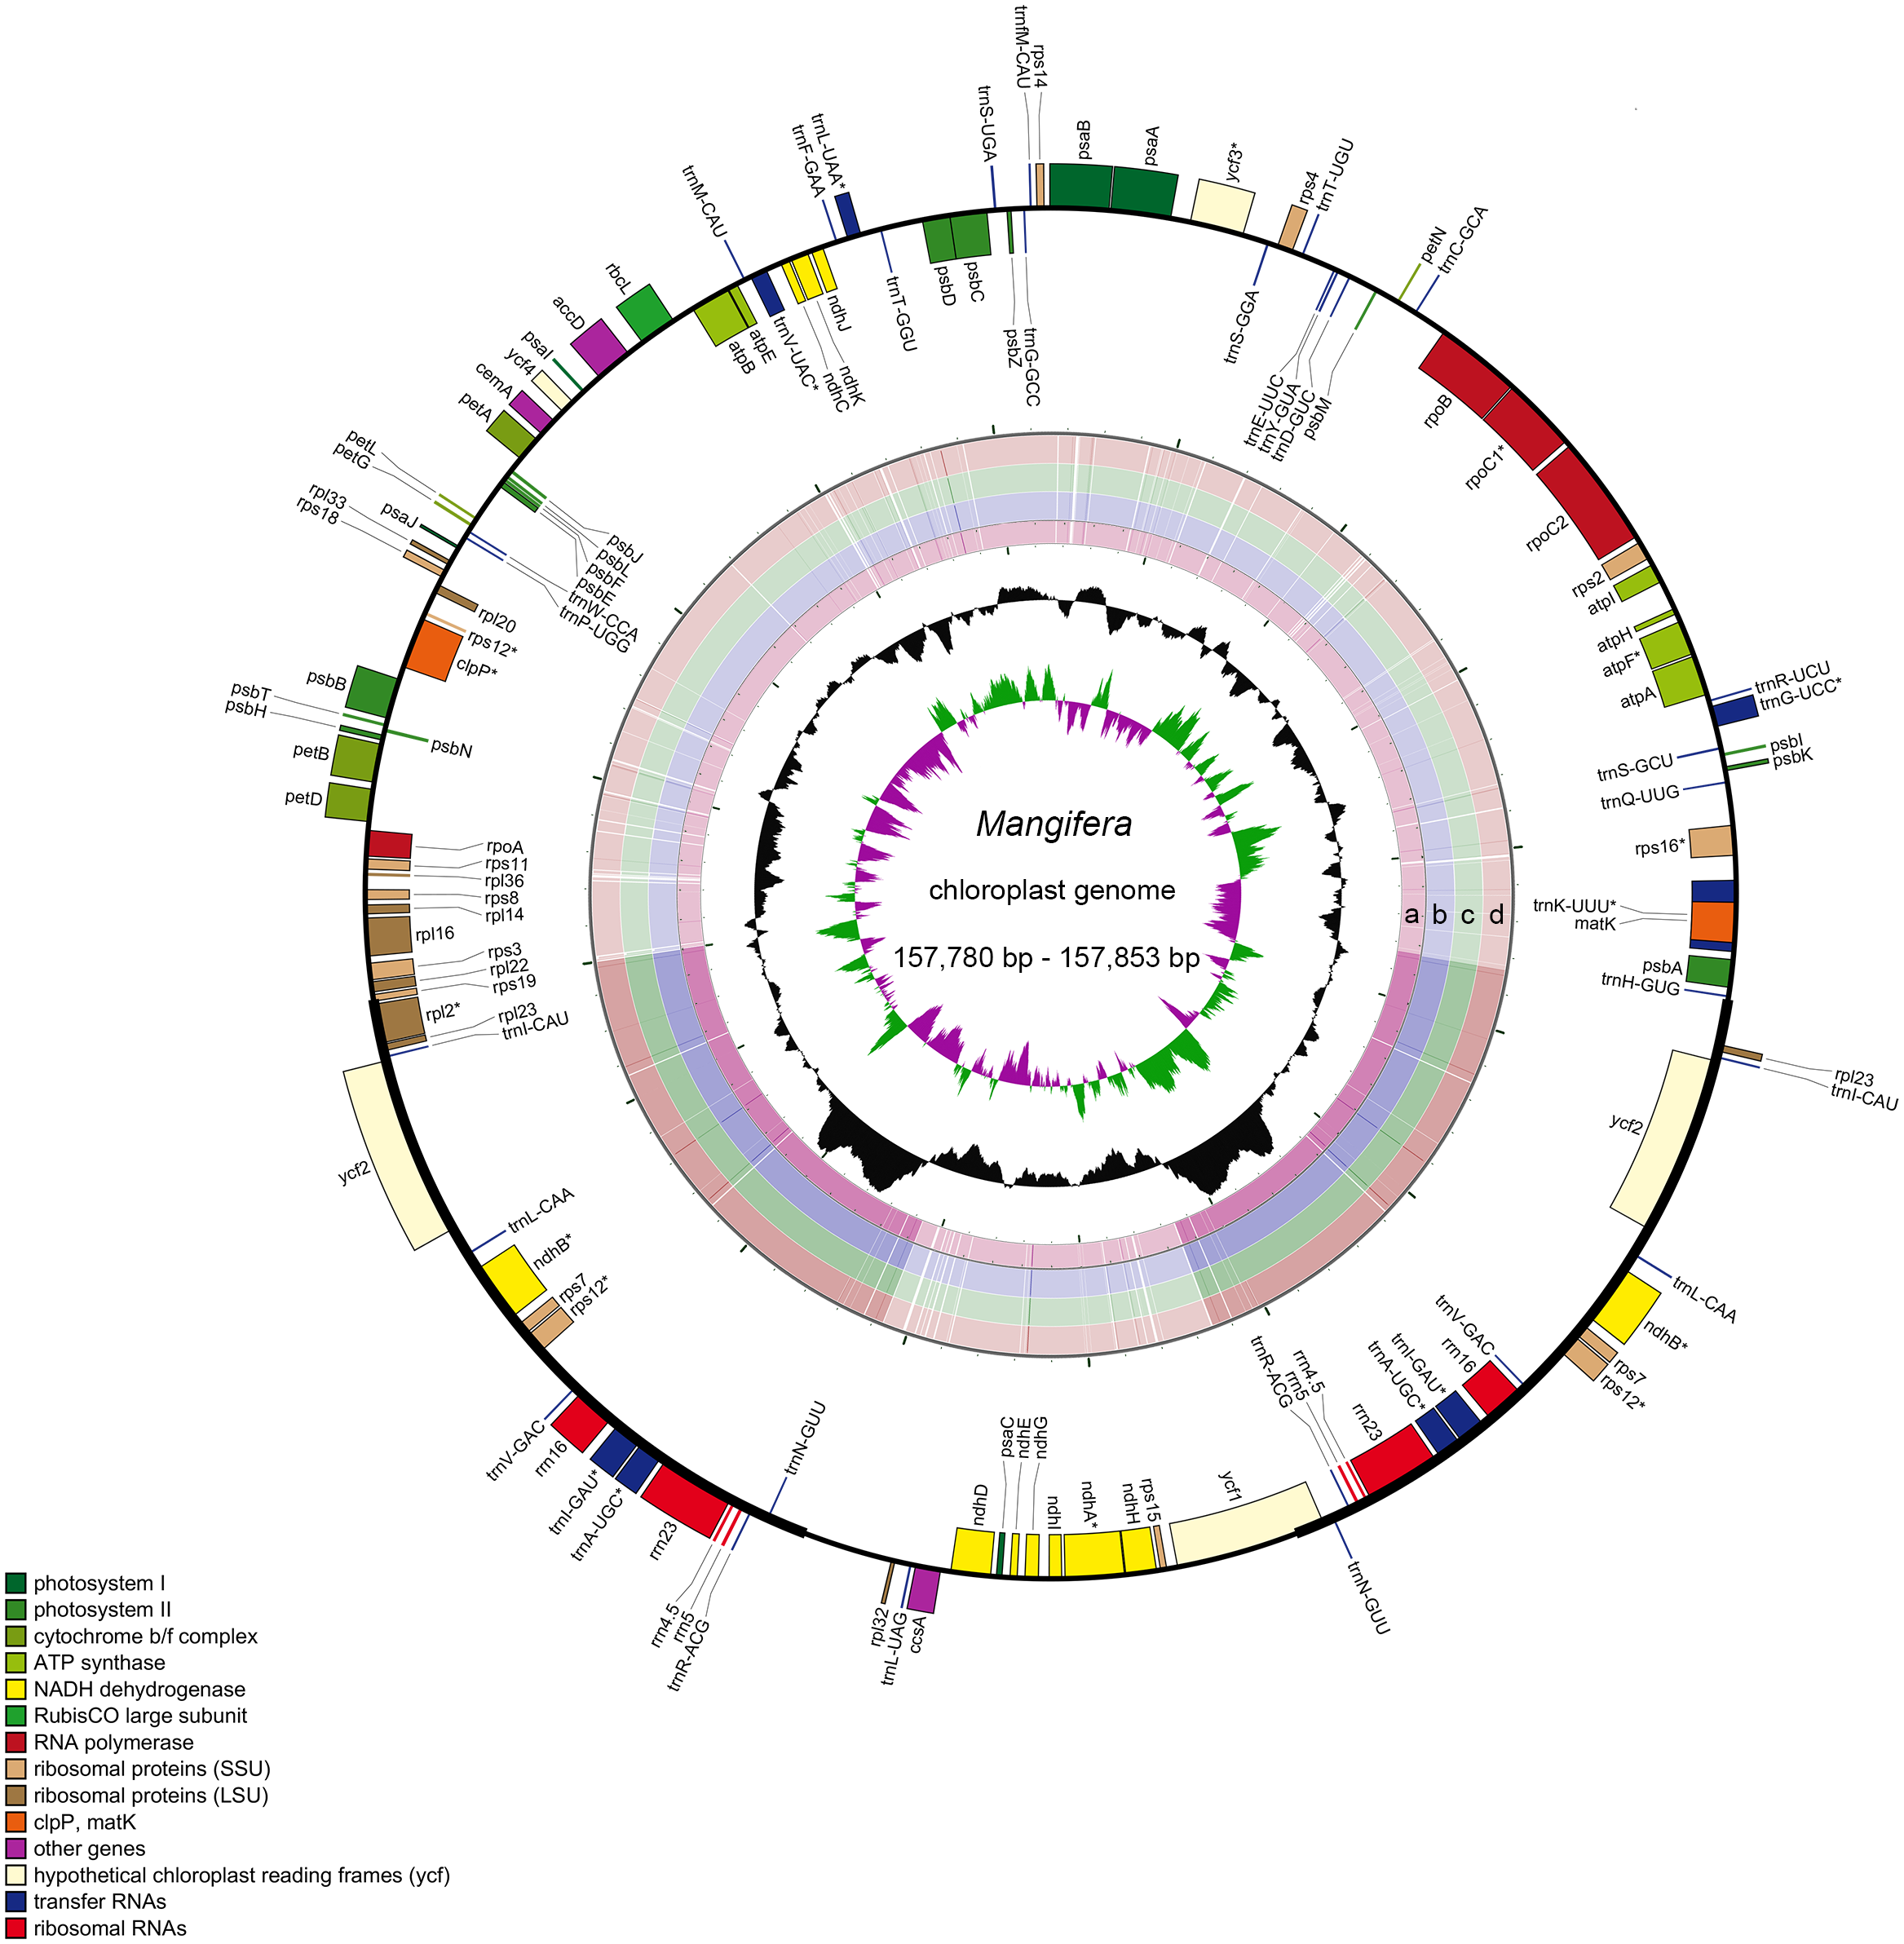
The IR/SC connected regions were found nearly identical relative positions in the five Mangifera chloroplast genomes (Fig. 2). All LSC-IRb connections were found to be located within the rps19 gene, resulting in a partial expansion of the IRb region to the rps19 gene (80–104 bp). The IRb-SSC boundary was located in the ndhF gene, while the SSC-IRa boundary in the five chloroplast genomes was located in the ycf1 gene.
Comparative Mangifera chloroplast genomes and Divergence Hotspot Regions
Using the comparative sequence analysis of the five species of Mangifera, we found that the plastid genome was quite conservative in the five taxa, although there were a few regions with variations. In general, sequences are conserved in the coding region, and most of the detected variations are in the non-coding region. The results agree with previous reports that non-coding regions showed greater divergence than coding regions, this is possibly caused by coding regions affected by stronger selective pressure (Li et al., 2018). Consistent with similar studies involving other plants, the IR regions appear to be more conservative than the LSC and SSC regions (Fig. 1) (Liang et al., 2019; Song et al., 2019). A search for nucleotide substitutions identified 638 variable sites (0.40%) in the five chloroplast genomes, including 489 parsimony-informative sites (0.31%), this number is smaller than other genus species (Gao et al., 2020; Nguyen et al., 2020).
| Genome feature | M. indica | M. longipes | M. persiciformis | M. hiemalis | M. sylvatica |
|---|---|---|---|---|---|
| Total size (bp) | 157,780 | 157,853 | 157,799 | 157,796 | 157,824 |
| LSC Length (bp) | 86,673 | 86,726 | 86,724 | 86,718 | 86,719 |
| SSC Length (bp) | 18,349 | 18,369 | 18,367 | 18,368 | 18,347 |
| IR Length (bp) | 26,379 | 26,379 | 26,354 | 26,355 | 26,379 |
| Total Genes | 113 | 113 | 113 | 113 | 113 |
| Protein coding Genes | 79 | 79 | 79 | 79 | 79 |
| Structure RNAs | 34 | 34 | 34 | 34 | 34 |
| GC Content (%) | 37.89% | 37.88% | 37.88% | 37.89% | 37.89% |
| GenBank Accessions | NC035239 | MN917210 | MN917209 | MN917208 | MN917211 |
| Category | Group of genes | Name of genes |
|---|---|---|
| Self replication | Ribosomal RNA genes | rrn4.5, rrn5, rrn16, rrn23 |
| Small subunit of ribosome | rps2, rps3, rps4, rps7, rps8, rps11, rps12, rps14, rps15, rps16, rps18, rps19 | |
| Transfer RNA genes | trnR-UCU, trnS-GCU, trnA-UGC, trnC-GCA, trnF-GAA, trnG-GCC, trnG-UCC, trnD-GUC, trnE-UUC, trnH-GUG, trnN-GUU, trnP-UGG, trnQ-UUG, trnR-ACG, trnI-GAU, trnY-GUA, trnK-UUU, trnL-CAA, trnL-UAA, trnI-CAU, trnV-GAC, trnV-UAC, trnW-CCA, trnL-UAG, trnfM-CAU, trnM-CAU, trnS-GGA, trnS-UGA, trnT-GGU, trnT-UGU | |
| DNA dependent RNA polymerase | rpoA, rpoB, rpoC1, rpoC2 | |
| Large subunit of ribosome | rpl2, rpl14, rpl16, rpl20,rpl22, rpl23, rpl32, rpl33, rpl36 | |
| Photosynthesis | Subunits of photosystem I | psaA, psaB, psaC, psaI, psaJ, ycf3, ycf4 |
| Subunits of NADH-dehydrogenase | ndhA, ndhB, ndhC, ndhD, ndhE, ndhF, ndhG, ndhH, ndhI, ndhJ, ndhK | |
| Subunits of ATP synthase | atpA, atpB, atpE, atpF, atpH, atpI | |
| Subunits of photosystem II | psbA, psbB, psbC, psbD, psbE, psbF, psbH, psbI, psbJ, psbK, psbL, psbM, psbN, psbT, psbZ | |
| Subunits of cytochrome complex | petA, petB, petD, petG, petL, petN | |
| Protease | clpP | |
| Other genes | Maturase | matK |
| Acetyl-CoA-carboxylase c-type Cytochrome synthesis gene | ccsA | |
| Large subunit of rubisco | rbcL | |
| Envelop membrane protein | cemA | |
| Subunit of Acetyl-CoA-carboxylase | accD | |
| Hypothetical chloroplast | ycf1, ycf2, ycf15 |
To identify hotspots of sequence divergence, the nucleotide diversity (Pi) values within the 600 bp window of the Mangifera chloroplast genomes were calculated (Fig. 3). We found that Pi values varied from 0–0.033, and the three hypervariable regions (Pi > 0.02) of the five Mangifera chloroplast genomes were trnG-psbZ, psbD-trnT, and ycf4-cemA. The trnG-psbZ region exhibited the highest variability (7.44%).
Here, we found an increase in the number of variable sites in the following three specific regions based on the results of pairwise plastid genomic alignment and SNP analysis: trnG-psbZ, psbD-trnT, and ycf4-cemA. Thus, Mangifera species may be detected using these regions as novel candidate fragments. Figure S1 presents the graphical representation of these results using the ML method. These three DNA barcode candidate sequences have high species identification ability. However, further experiments are required to support this Mangifera plastid sequence data.
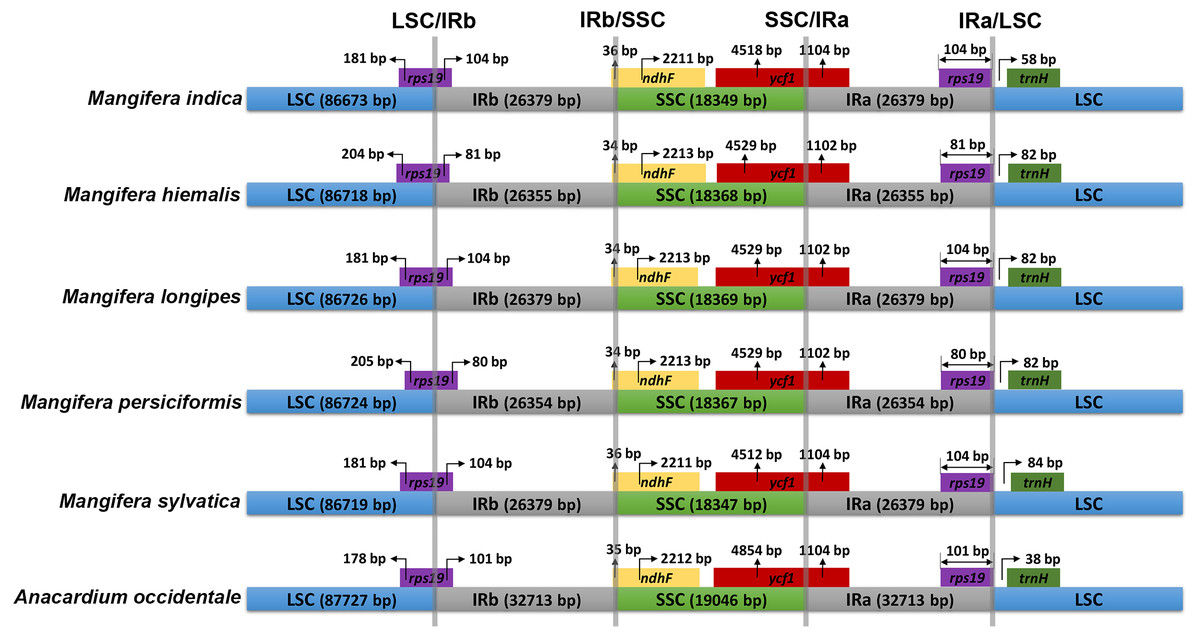
Figure 2: Comparison of inverted repeat (IR) boundary among Mangifera species, where genes and gene fragments across IRa/b junctions are represented in color boxes above the horizontal line.
Genes and IR segments are not mapped to scale.
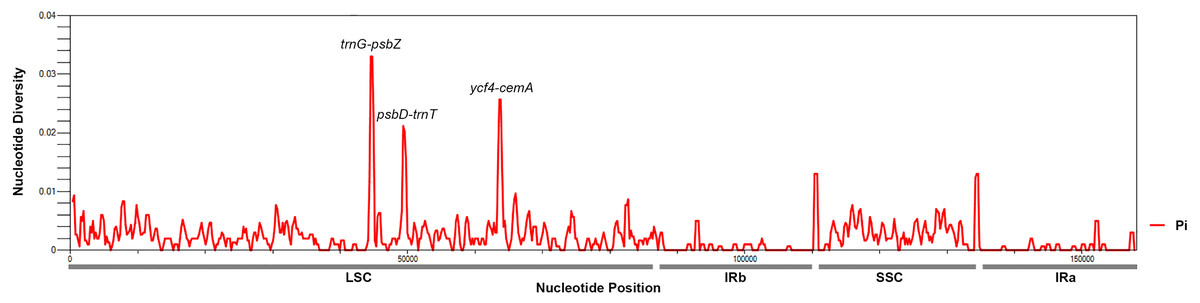
Figure 3: Mangifera Chloroplast genomes sliding window analysis (window length: 600 bp; step size: 200 bp).
X-axis, Position of a window; Y-axis, Genetic diversity per window.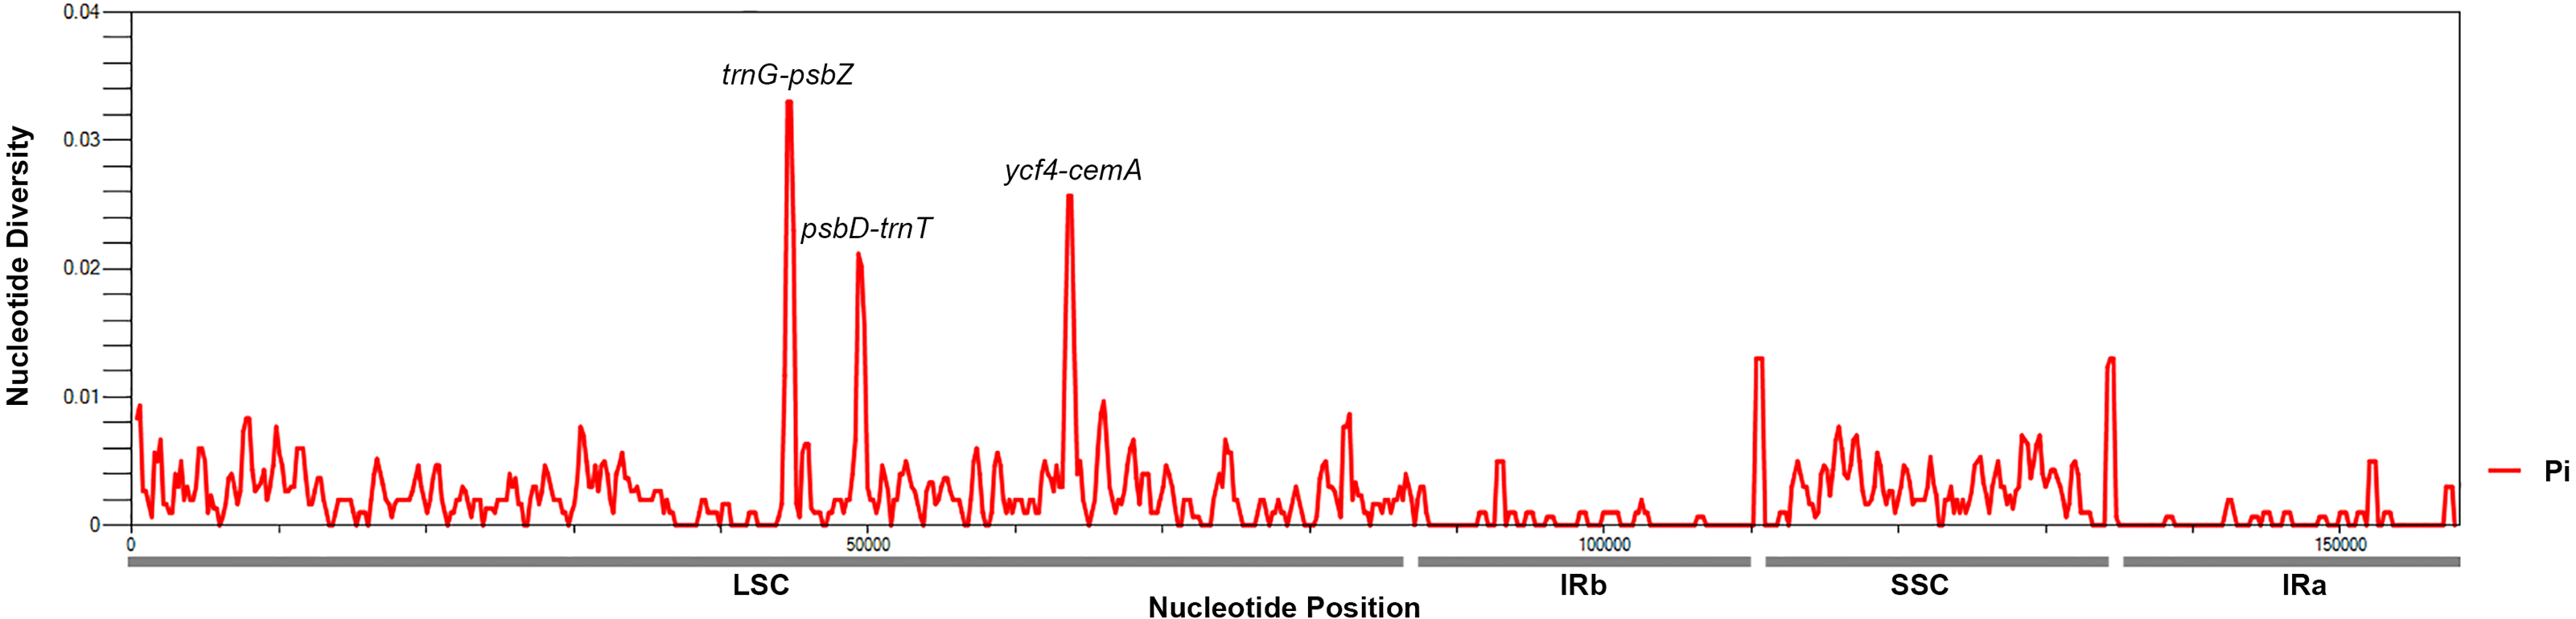
Characterization of gene transfer of Mangifera chloroplast genome to mitochondrial genome
The mitochondrial genome of M. indica was obtained from GenBank and was 87,1458 bp in size, approximately 5.5 times that of the chloroplast genome consisting of 94 functional genes. We identified 12 large chloroplast genome fragments in the mitochondrial genome, including genes and intergenomic regions. These fragments ranged from 1,522–5,400 bp and the sequences were over 99% consistent. The total length of these fragments was 35,652 bp, accounting for 22.6% of the chloroplast genome (Fig. 4 and Table S1). Fifteen intact chloroplast genes (rps19, rpl2, rpl23, petN, rbcL, accD, psbJ, psbL, psbF, psbE, petL, petG, psaA, atpA, cemA ), four tRNAs (trnI-CAU, trnC-GCA, trnW-CCA, trnP-UGG) and numerous partial genes and intergenic spacer regions were identified. There are many of these genes transferred from mitochondria to the chloroplast in other species genomes, such as rps12, rpl23, rbcL, petL, petG, trnW-CCA and trnP-UGG (Gao et al., 2020; Gui et al., 2016).
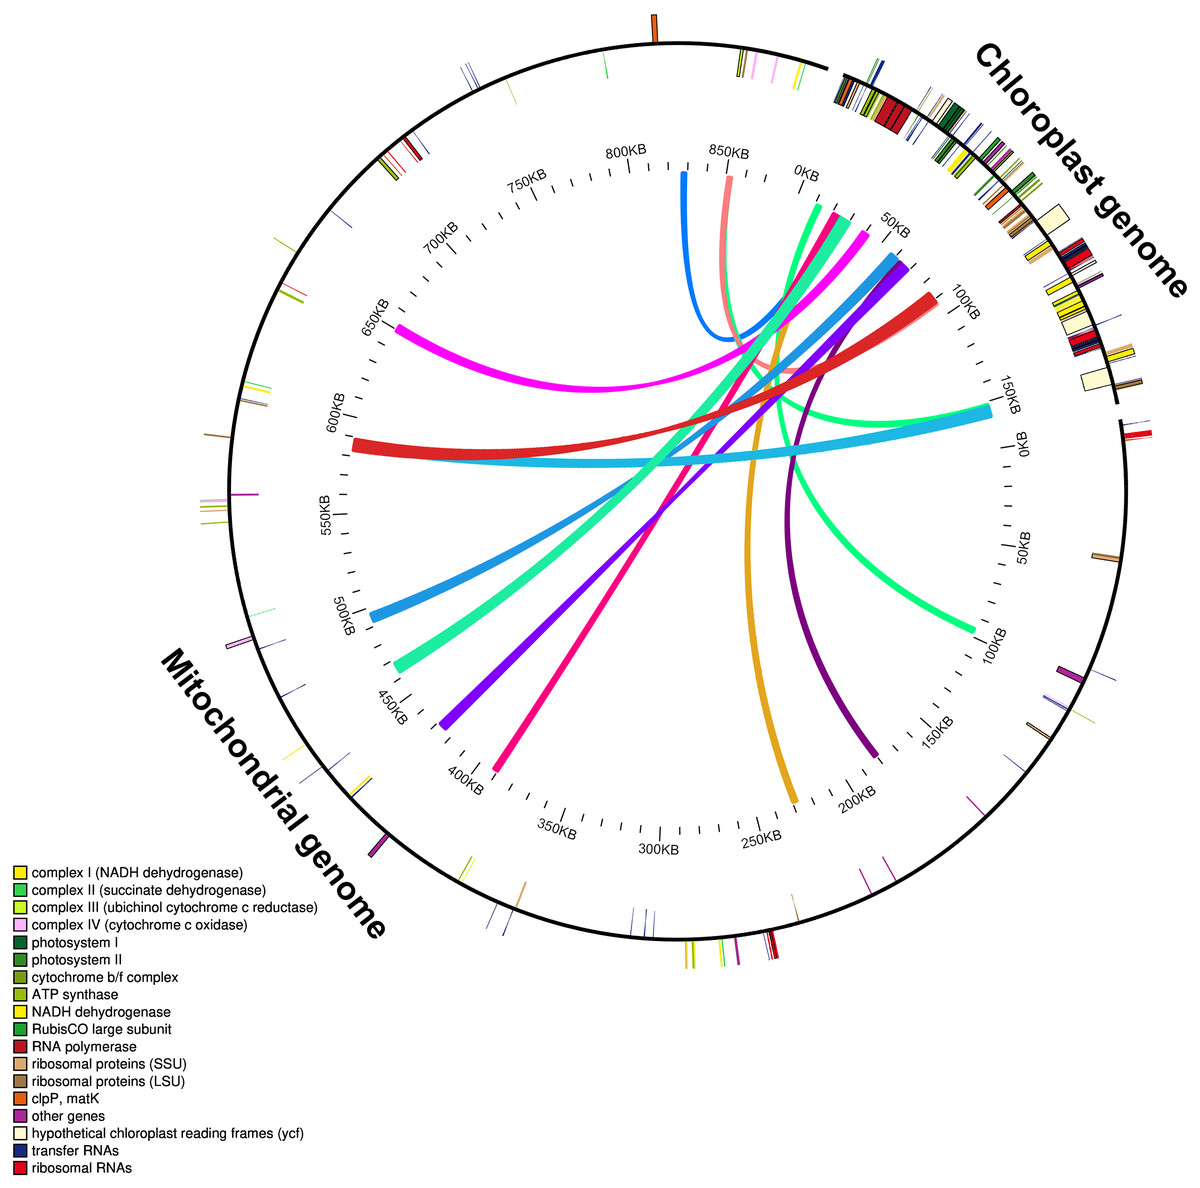
Figure 4: Schematic diagram of gene transfer between chloroplast and mitochondria in Mangifera species.
Colored lines within the circle show where the chloroplast genome is inserted into the mitochondrial genome. Genes within a circle are transcribed clockwise, while those outside the circle are transcribed counterclockwise.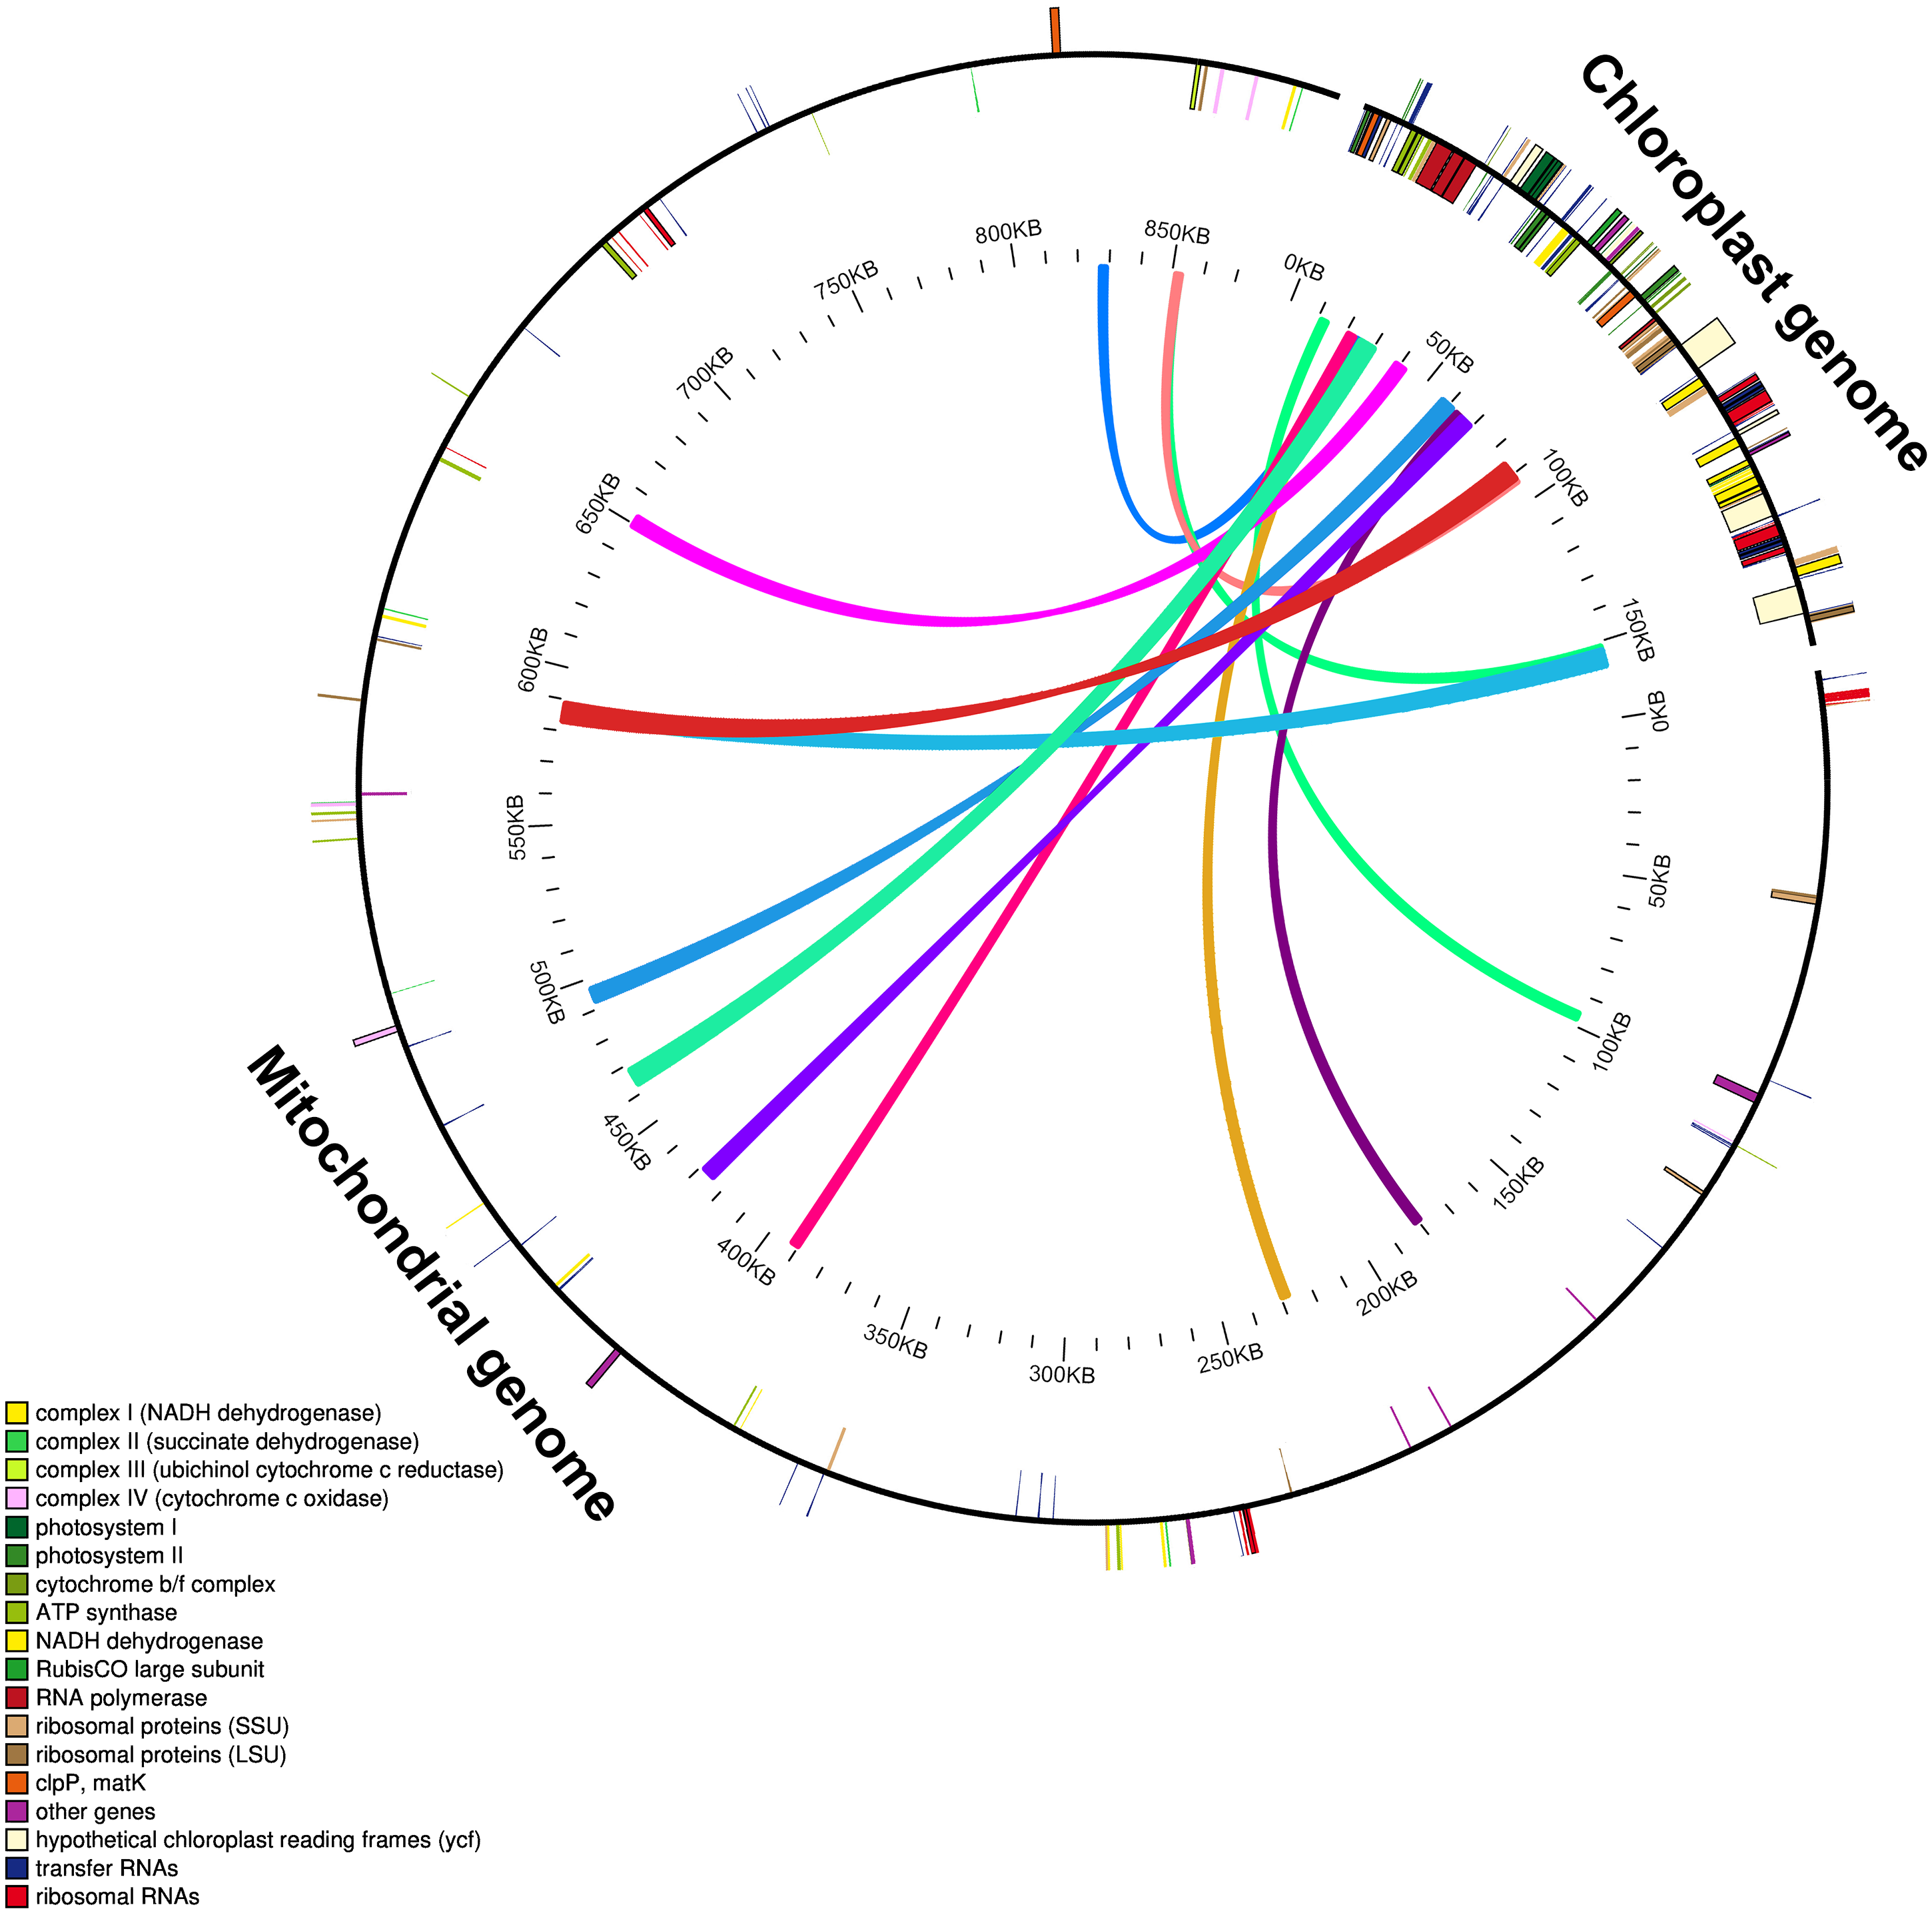
Intracellular gene transfer exists between different genomes, including those of the chloroplasts, mitochondria, and nuclei (Nguyen et al., 2020; Timmis et al., 2004). Research shows that the frequency of nuclear DNA transfer from organelles in angiosperms is very high (Hazkani-Covo, Zeller & Martin, 2010; Park et al., 2014; Smith, 2011). Gene transfer from chloroplast to mitochondrial genomes is a common phenomenon during long-term evolution (Gui et al., 2016; Nguyen et al., 2020). Due to high sequence identity between the transferred chloroplast genome fragments in the mitochondrial and original chloroplast genomes, gene transfer can lead to assembly errors in these genomes.
Phylogenetic relationship of chloroplast genomes
In this study, the chloroplast genome was used for infer the phylogenetic location of Mangifera in Sapindales (Fig. 5) and performed a phylogenetic analysis of the chloroplast genome using three different methods, namely, ML, MP, and BI. BI and ML analyses revealed almost the same topology, and most branches had very high support (Fig. S2). However, MP trees differed slightly from BI and ML trees in some taxa (Fig. S3). Despite differences between these three approaches, the relationships between most groups were well resolved and highly supported, suggesting that the use of chloroplast genome data does significantly improve the resolution of phylogenetic analysis. Previous studies have revealed the genetic relationship of Mangifera through morphological, nuclear, amplified fragment length polymorphism, ribosomal internal transcribed spacer (ITS), and partial chloroplast gene analysis (Eiadthong et al., 2000; Nishiyama et al., 2006; Sankaran et al., 2018; Yonemori et al., 2002). The whole chloroplast genome sequence-based phylogenetic tree was built to explore the evolutionary similarities/differences between Mangifera species and between genera in the Sapindales. Phylogenetic analysis based on complete genome sequences, rather than a few genes, has been carried out in a large number of higher plant species, significantly improving the resolution of phylogenetic analysis (Zhai et al., 2019).

Figure 5: ML phylogenetic tree of five Mangifera species with 21 related species in the Sapindales based on whole chloroplast genome sequence.
Numbers related to the branches are ML bootstrap value, MP bootstrap value, and Bayesian posterior probability, respectively. Asterisk denotes 100% bootstrap support or 1.0 posterior probability.
Conclusions
In this study, the chloroplast genomes of four Mangifera species were sequenced and compared. It was found that the size, structure, and gene content of the Mangifera chloroplast genomes were conserved. Comparative analysis showed a low degree of sequence variation. We identified 13 large fragments that were transferred from the chloroplast genome to the mitochondrial genome. In addition, we identified three mutation hotspots as DNA barcodes for the identification of Mangifera species. These complete chloroplast genome sequences and highly variable markers provide sufficient genetic information for the phylogenetic reconstruction and species identification of the genus Mangifera.