 When an airplane crashes, the first thing to do (after searching for survivors of course) is to search for the “blackbox” since it would contain vital information about what might have caused the plane to crash. You can apply this technique on your servers as well.
The “PerfMon BlackBox” is an always-running capture of key performance counters. So when a server crashes, hangs or starts to slow down significantly, you can take the collected data (the blg file) and analyze it for memory leaks or other unexpected resource consumption.
For this, you’ll need a set of two files. One (BlackBox_Counters.txt) containing the list of performance counters to be collected, and a second (BlackBox.cmd) containing the script set of commands to create the data collector using logman.exe.
BlackBox_Counters.txt:
\Cache\Dirty Pages
\Cache\Lazy Write Flushes/sec
\LogicalDisk(*)\% Free Space
\LogicalDisk(*)\% Idle Time
\LogicalDisk(*)\Avg. Disk Bytes/Read
\LogicalDisk(*)\Avg. Disk Bytes/Write
\LogicalDisk(*)\Avg. Disk Queue Length
\LogicalDisk(*)\Avg. Disk sec/Read
\LogicalDisk(*)\Avg. Disk sec/Write
\LogicalDisk(*)\Current Disk Queue Length
\LogicalDisk(*)\Disk Bytes/sec
\LogicalDisk(*)\Disk Reads/sec
\LogicalDisk(*)\Disk Transfers/sec
\LogicalDisk(*)\Disk Writes/sec
\LogicalDisk(*)\Free Megabytes
\Memory\% Committed Bytes In Use
\Memory\Available MBytes
\Memory\Cache Bytes
\Memory\Commit Limit
\Memory\Committed Bytes
\Memory\Free & Zero Page List Bytes
\Memory\Free System Page Table Entries
\Memory\Pages Input/sec
\Memory\Pages Output/sec
\Memory\Pages/sec
\Memory\Pool Nonpaged Bytes
\Memory\Pool Paged Bytes
\Memory\System Cache Resident Bytes
\Memory\Transition Pages RePurposed/sec
\Network Inspection System\Average inspection latency (sec/bytes)
\Network Interface(*)\Bytes Received/sec
\Network Interface(*)\Bytes Sent/sec
\Network Interface(*)\Bytes Total/sec
\Network Interface(*)\Current Bandwidth
\Network Interface(*)\Output Queue Length
\Network Interface(*)\Packets Outbound Errors
\Network Interface(*)\Packets Received/sec
\Network Interface(*)\Packets Sent/sec
\Network Interface(*)\Packets/sec
\Paging File(*)\% Usage
\PhysicalDisk(*)\Avg. Disk Queue Length
\PhysicalDisk(*)\Avg. Disk sec/Read
\PhysicalDisk(*)\Avg. Disk sec/Write
\PhysicalDisk(*)\Current Disk Queue Length
\PhysicalDisk(*)\Disk Bytes/sec
\PhysicalDisk(*)\Disk Reads/sec
\PhysicalDisk(*)\Disk Writes/sec
\Process(*)\% Privileged Time
\Process(*)\% Processor Time
\Process(*)\Handle Count
\Process(*)\ID Process
\Process(*)\IO Data Operations/sec
\Process(*)\IO Other Operations/sec
\Process(*)\IO Read Operations/sec
\Process(*)\IO Write Operations/sec
\Process(*)\Private Bytes
\Process(*)\Thread Count
\Process(*)\Virtual Bytes
\Process(*)\Working Set
\Processor Information(*)\% of Maximum Frequency
\Processor Information(*)\Parking Status
\Processor(*)\% DPC Time
\Processor(*)\% Interrupt Time
\Processor(*)\% Privileged Time
\Processor(*)\% Processor Time
\Processor(*)\% User Time
\Processor(*)\DPC Rate
\Server\Pool Nonpaged Failures
\Server\Pool Paged Failures
\System\Context Switches/sec
\System\Processor Queue Length
\System\System Calls/sec
\TCPv4\Connection Failures
BlackBox.cmd:
set “LogName=BlackBox”
set “LogsPath=D:\Perflogs”
set “CountersFile=BlackBox_Counters.txt”logman query |find /i /c “%LogName%”
if ERRORLEVEL 1 goto CreateLog:UpdateLog
logman update %LogName% -v nnnnnn -cf “%~dp0%CountersFile%” -si 00:01:00 -f bincirc -o “%LogsPath%\%LogName%_%COMPUTERNAME%” -max 1024
goto StartLog:CreateLog
logman create counter %LogName% -v nnnnnn -cf “%~dp0%CountersFile%” -si 00:01:00 -f bincirc -o “%LogsPath%\%LogName%_%COMPUTERNAME%” -max 1024:StartLog
logman start %LogName%:ClearOldLogs
forfiles /p %LogsPath% /m *.blg /d -7 /c “cmd /c del /q @path”
Now you can set your server’s “PerfMon BlackBox” by putting both files in a folder under your %USERDOMAIN%\NETLOGON folder, then create a new GPO, and assign the BlackBox.cmd script as the computer startup script. This way, whenever a server boots up, it will cerate/update the BlackBox collector and run it.
Note: The last line of the script file (under ClearOldLogs) is responsible for deleting blg files older than 7 days, so your disk is not bloated with old and irrelevant counter files.
Before you go and analyze the counters using perfmon, I recommend you use a set of registry tweaks that will make your life working with PerfMon a little easier.
PerfMonTweaks.reg:
Windows Registry Editor Version 5.00
#http://support.microsoft.com/kb/281884
#The Process object in Performance Monitor can display Process IDs (PIDs)
[HKEY_LOCAL_MACHINE\SYSTEM\CurrentControlSet\Services\PerfProc\Performance]
“ProcessNameFormat”=dword:00000002#http://support.microsoft.com/kb/300884
#Display Comma Separators in the Windows Performance Tool
[HKEY_CURRENT_USER\Software\Microsoft\SystemMonitor]
“DisplayThousandsSeparator”=dword:00000001#http://support.microsoft.com/kb/283110
#Vertical lines are displayed in the Sysmon tool that obscure the graph view
[HKEY_CURRENT_USER\Software\Microsoft\SystemMonitor]
“DisplaySingleLogSampleValue”=dword:00000001
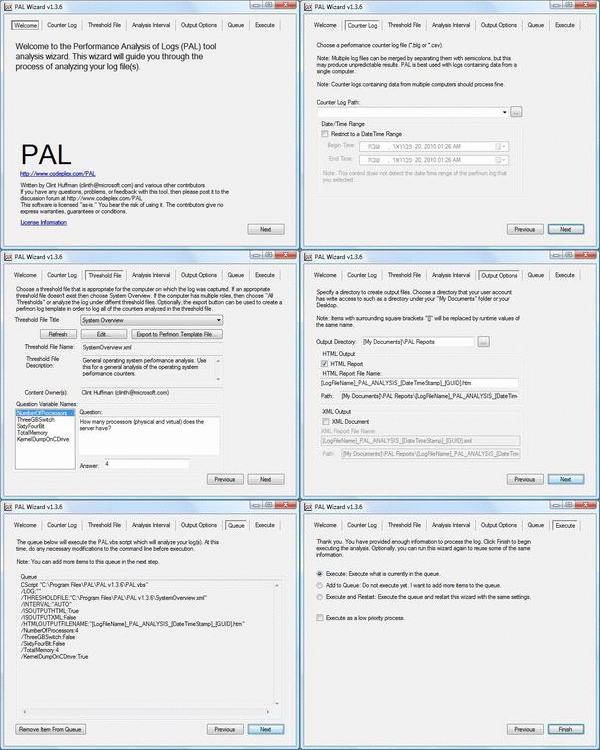
And if you don’t know how, you can always use PAL to analyze the performance logs. It generates an HTML based report which graphically charts important performance counters and show alerts when thresholds are exceeded. Just remember PAL is not a replacement of traditional performance analysis, but it automates the analysis of performance counter logs enough to save you time.
Related reading:
