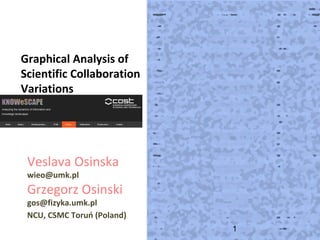
![Brain Spirography (BS) – investigated activity of “natural neurons” on breath
center in human brain.
Neural nets
Breath center
in human brain
stem
Total activity of neurons network as Time Series
Return Map Plot
of activity
40 50 60 70 80 90
0,4
0,2
Czas [s]
FD =2.32
2](data:image/gif;base64,R0lGODlhAQABAIAAAAAAAP///yH5BAEAAAAALAAAAAABAAEAAAIBRAA7)
Recomendados
Recomendados
Más contenido relacionado
Similar a Graphical Analysis of Scientific Collaboration Variations Interactions
Similar a Graphical Analysis of Scientific Collaboration Variations Interactions (20)
Más de KNOWeSCAPE2014
Más de KNOWeSCAPE2014 (15)
Último
Último (20)
Graphical Analysis of Scientific Collaboration Variations Interactions
- 1. 1/14 Graphical Analysis of Scientific Collaboration Variations 1 Veslava Osinska wieo@umk.pl Grzegorz Osinski gos@fizyka.umk.pl NCU, CSMC Toruń (Poland)
- 2. Brain Spirography (BS) – investigated activity of “natural neurons” on breath center in human brain. Neural nets Breath center in human brain stem Total activity of neurons network as Time Series Return Map Plot of activity 40 50 60 70 80 90 0,4 0,2 Czas [s] FD =2.32 2
- 3. Clinical application for BS measurements Total activity of NN FD = 1.78 3
- 4. Transfer from clinical aplication for scientific collaboration Neurons Scientists 25 20 15 10 5 0 40 50 60 70 80 90 0,4 0,2 Czas [s] How to calculate ? /14 4
- 5. Procedure 1. Mycielski construction – for pairs or small groups of scientists 2. The longest path length 3. Different groups of collaborators 4. Reconstruction of time series based on scientist activity 5. Construction of Return Map Plot and calculation of Fractal Dimention Mycielski graph G it is μ(G) constructed by procedure of Jan Mycielski (1955) based on theorem that bigest clique has a dimenstion ≤ 2 and maximum chromatic number. MG will select a pairs of different colors (specialization) scientist 5
- 6. Selected groups of collaboration Leaders Connectors Performers („doits”) Outliers 5 10 15 20 80 70 60 50 40 30 20 10 2 group 3 group 4 group 0,000 3,750 7,500 11,25 15,00 18,75 22,50 26,25 30,00 1 group 6
- 7. Data Members Activity • Source: Knowescape.org: participants, their groups, Steering Commitee • Mobility & Coorganization Members' Publications • ResearchGate • Mendeley • Knowescape • Personal websites 7
- 10. Leader - performer FD = 1.24 10
- 11. Performer - performer FD = 1.39 11
- 12. FD = 1.46 12 Connector - performer
- 13. Discussion • Stable/unstable collaboration’s state - analogy to breathing • 2 NEW parameters for graphical analysis of scientists’ collabaration 1. Shape of Poincare section (RMP) The level of nonlinearity – the S.C. factor of collaboration is proportional for quantity curves of higher degree than one (linear) 2. Value of FD for pairs The value of FD is proportional for the ability (dynamics?) to cooperate. 13
- 14. contact: wieo@umk.pl 1.Osinska V, Osinski G, Kwiatkowska A. Visualization in Learning: Perception, Aesthetics and Pragmatism. In: Maximizing Cognitive Learning through Knowledge Visualization, IGI Global 2015 (in press) 2.R. Mazur, G. Osiński, A. Ogonowski, G.Mikolaiczik, Analysis of Brain Stem Respiratory Center Function by Use of Mathematical Apparatus of Chaos Theory 1st CENTRAL EUROPEAN BIOMEDICAL CONGRESS, p. 53-54, 2014 3.R. Mazur, G. Osiński, M. Świerkocka, G, Evaluation of the dynamics of energetic changes in the brain stem respiratory centre in the course of increasing disorders of consciousness, Act. Nerv. Super. Rediviva, V 51, 2009. 4.M Świerkocka-Miastkowska, G Osiński , Nonlinear analysis of dynamic changes in brain spirography. Results in patients with ischemic stroke, Clinical Neurophysiology, 2007 5.Tamassia, R. "Graph Drawing." Ch. 21 in Handbook of Computational Geometry (Ed. J.- R. Sack and J. Urrutia). Amsterdam, Netherlands: North-Holland, pp. 937-971, 2000 TThhaannkk yyoouu ffoorr aatttteennttiioonn 14 References
Notas del editor
- The shortest path length – standard procedure The longest path length – as time series how close an actor is to all others is to ask what portion of all others ego can reach in one step, two steps, three steps, etc. The eigenvector approach is an effort to find the most central actors (i.e. those with the smallest farness from others) in terms of the "global" or "overall" structure of the network, and to pay less attention to patterns that are more "local." The method used to do this (factor analysis) is beyond the scope of the current text. In a general way, what factor analysis does is to identify "dimensions" of the distances among actors. The location of each actor with respect to each dimension is called an "eigenvalue," and the collection of such values is called the "eigenvector." Usually, the first dimension captures the "global" aspects of distances among actors; second and further dimensions capture more specific and local sub-structures.